

Abstract
Enucleation is the step in erythroid terminal differentiation when the nucleus is expelled from developing erythroblasts creating reticulocytes and free nuclei surrounded by plasma membrane. We have studied protein sorting during human erythroblast enucleation using fluorescence activated cell sorting (FACS) to obtain pure populations of reticulocytes and nuclei produced by in vitro culture. Nano LC mass spectrometry was first used to determine the protein distribution profile obtained from the purified reticulocyte and extruded nuclei populations. In general cytoskeletal proteins and erythroid membrane proteins were preferentially restricted to the reticulocyte alongside key endocytic machinery and cytosolic proteins. The bulk of nuclear and ER proteins were lost with the nucleus. In contrast to the localization reported in mice, several key erythroid membrane proteins were detected in the membrane surrounding extruded nuclei, including band 3 and GPC. This distribution of key erythroid membrane and cytoskeletal proteins was confirmed using western blotting. Protein partitioning during enucleation was investigated by confocal microscopy with partitioning of cytoskeletal and membrane proteins to the reticulocyte observed to occur at a late stage of this process when the nucleus is under greatest constriction and almost completely extruded. Importantly, band 3 and CD44 were shown not to restrict specifically to the reticulocyte plasma membrane. This highlights enucleation as a stage at which excess erythroid membrane proteins are discarded in human erythroblast differentiation. Given the striking restriction of cytoskeleton proteins and the fact that membrane proteins located in macromolecular membrane complexes (e.g. GPA, Rh and RhAG) are segregated to the reticulocyte, we propose that the membrane proteins lost with the nucleus represent an excess mobile population of either individual proteins or protein complexes.
Introduction
During the final stages of erythroid terminal differentiation, the orthochromatic erythroblast enucleates to form the reticulocyte. Whilst undergoing this dramatic process, erythroid membrane proteins, cytoskeletal proteins and other cellular machinery required by the nascent reticulocyte must be selectively retained or will be lost with the extruded nucleus [1]. Studies using mouse erythroblasts have shown that the spectrin cytoskeleton, along with microtubules, myosin and actin partitions to the reticulocyte as the nucleus is removed [2], [3], [4]. Key erythroid membrane surface proteins were observed to be segregated to the nascent reticulocyte following enucleation including band 3 [5], [6], GPA [5], GPC [5] and RhAG [5] in murine cells. Several membrane proteins are selectively lost, such as the Beta 1 integrin [7], the vitamin C transporter SVCT2 [8] and erythroblast macrophage protein (EMP) [7], [9]. A mechanism has been proposed whereby retention of erythrocyte membrane proteins occurs by attachment to the cytoskeletal network via associated adaptor proteins or indirectly via multiprotein membrane protein complexes comprising band 3 or GPC [10]. Supporting this hypothesis, GPA cytoskeletal attachment is greater in erythroblasts than in reticulocytes [7], and the disruption of cytoskeletal attachment in ankyrin and protein 4.1R knockout mice resulted in the mislocalisation of specific membrane proteins (band 3 and RhAG for ankyrin disruption and GPC for protein 4.1) to the plasma membrane surrounding the nucleus [5].
It is currently unknown whether the protein sorting mechanism during enucleation is similar in humans. Griffiths et al recently presented confocal images of a selected number of membrane proteins, including GPA, GPC and Rh. Some immunofluorescence surrounding the extruding nucleus was perceivable in the images presented, and both basigin and beta 1 integrin were lost along with the nucleus [11]. However, partitioning of the majority of key erythrocyte membrane proteins (e.g. band 3, RhAG, Glut1, CD44) and many cytoskeletal proteins (alpha and beta spectrin, ankyrin or protein 4.2) was not investigated. We hypothesized that since differences in membrane protein multiprotein complex composition are known to exist between humans and mice [10], subtle differences may exist in the sorting process that occurs during enucleation. Identifying potential disparities is important to fully understand how specific protein deficiencies occur in human red blood cell diseases such as Hereditary Spherocytosis.
This study has adopted a global proteomic approach in combination with biochemical and detailed immunofluorescence analysis to explore the protein distribution and partitioning that occurs during human erythroblast enucleation. In general we find that there is a preferential restriction of erythroid membrane proteins to the reticulocyte and that this partitioning occurs at a very late stage during enucleation. Importantly, a substantial proportion of some membrane proteins, in particular band 3, CD44, GPC, Glut1 and stomatin are lost in the plasma membrane surrounding the nucleus in humans.
Methods
Antibodies
Monoclonal mouse antibodies used were BRIC256 (GPA), BRIC170 (band 3), LA1818 (RhAG), BRIC69 (Rh), BRIC4 (GPC), BRIC272/BRIC274 (ankyrin), BRIC273 (protein 4.2), BRAC65 (beta spectrin), BRIC172/BRIC276 (alpha spectrin), BRIC32 (CD47) (IBGRL, Filton, Bristol, UK), beta actin (Sigma), PDI (Assay Designs) and calnexin (RDI). BRIC272, BRIC273, BRIC276 and BRAC65 are all novel unpublished monoclonal antibodies. The novel antibodies were characterised using GFP-tagged cDNA expression, shRNA knockdown in K562 cells, and by using mature erythrocytes with a known protein deficiency. Rabbit monoclonal antibody used was beta 1 integrin (Novus). Rabbit polyclonal antibodies used were band 3, RhAG, GPC, Rh, Glut1, protein 4.1, p55, stomatin and CD44 (all available in house), flotillin-2 (Cell Signalling), alpha adducin (Santa Cruz). A goat polyclonal to lamin B was purchased from Santa Cruz. Secondary antibodies used were goat anti–mouse-Alexa 488 and goat anti-rabbit-Alexa 594 (Invitrogen), rabbit anti-mouse RPE, HRP-conjugated swine anti-rabbit and rabbit anti-mouse (Dako) and HRP conjugated donkey anti-goat (Jackson ImmunoResearch).
Erythroblast Cell Culture
Peripheral blood mononuclear cells were isolated from platelet apheresis waste blood (NHSBT, Bristol) from healthy donors with written informed consent for research use in accordance with the Declaration of Helsinki and approved by local Research Ethics Committee (Southmead Research Ethics Committee reference 08/H0102/26 and Bristol Research Ethics Committee Centre reference 12/SW/0199). Erythroblasts were expanded and differentiated using either the whole population of Peripheral Blood Mononuclear cells or from CD34+ as described previously [11], [12], [13]. The culture method for the PBMC population was modified as follows; a lineage depletion step (Lineage Cell Depletion Kit, Miltenyi Biotec, UK) was performed following Percoll on day 5 to ensure complete removal of lineage positive cells at this stage. IMDM (Source Biosciences) supplemented with 2% (v/v) fetal bovine serum (Hyclone, Fisher Scientific UK Ltd), 10 µg/ml insulin (Sigma), 200 µg/ml holotransferrin (Sigma), 3% (v/v) AB serum (Sigma) and 3 U/ml heparin (Sigma) replaced StemSpan SFEM during the expansion (phase 2) and differentiation phases (phase 3). Therefore, during Phase 2 of the culture IMDM base medium was supplemented with 2 U/ml Epo (Bristol Royal Infirmary, Bristol, UK), 1 µM dexamethasone (Sigma), 40 ng/ml IGF-1 (R&D systems), 40 µg/ml cholesterol-rich lipids (Sigma) and SCF (100 ng/ml). For Phase 3 of the culture, IMDM base medium was supplemented with 10 U/ml Epo, 1 mg/ml holotransferrin (Sigma), 3% human AB plasma (Sigma), 10 µg/ml insulin (Sigma), 1 µM thyroid hormone (Sigma), 40 ng/ml IGF-1, and 40 µg/ml cholesterol-rich lipids.
FACS Sorting
5×10⁷ batches of enucleating erythroblasts were washed with PBS, then dual labelled with Hoechst 33342 (5 µg/ml) (Sigma) and BRIC256 (GPA) (detected with PE conjugated secondary). The reticulocyte and nuclei populations were then sorted using a BD Influx Cell Sorter. 1×10⁵ cells from each population were cytospun as previously described [13]. The reticulocyte or nuclei populations were pelleted and stored at −80°C.
Proteomics
1×10⁶ reticulocytes or nuclei were fractionated by 1D SDS-PAGE, gel lanes were cut into 4 equal portions and in-gel digested with trypsin. Extracted peptides were subjected to Nano LC mass spectrometry as described [14] but with modifications. The raw data files were processed using Proteome Discoverer software v1.2 (Thermo Scientific) and searched against the UniProt/SwissProt Human database release version 57.3 (20326 entries) using the SEQUEST (Ver. 28 Rev. 13) algorithm. Peptide precursor mass tolerance was set at 10 ppm, and MS/MS tolerance was set at 0.8 Da. Search criteria included carbamidomethylation of cysteine (+57.0214) as a fixed modification and oxidation of methionine (+15.9949) as a variable modification. Searches were performed with full tryptic digestion and a maximum of 1 missed cleavage was allowed. The reverse database search option was enabled and all peptide data was filtered to satisfy false discovery rate (FDR) of 5%. The Proteome Discoverer software generates a reverse “decoy” database from the same protein database and any peptides passing the initial filtering parameters that were derived from this decoy database are defined as false positive identifications. The minimum cross-correlation factor (Xcorr) filter was readjusted for each individual charge state separately to optimally meet the predetermined target FDR of 5% based on the number of random false positive matches from the reverse decoy database. Thus each data set has its own passing parameters.
Immunofluorescence
Immunostaining of enucleating erythroblasts were conducted as described previously [13]. Briefly, 6 × 10⁵ cells were fixed in suspension in 0.5% acrolein in PBS (Sigma-Aldrich), washed 3 times in PBS-0.1M glycine before being cytospun onto coverslips coated with Cell-Tak (BD Biosciences). Cells were then permeabilized with 0.05% Triton X-100 for 5 minutes at room temperature and then blocked in PBS-4% BSA for 45 minutes, incubated with primary antibodies in PBS-4% BSA for 1 hour, washed with PBS, and incubated for 1 hour with goat anti–mouse Alexa 488–conjugated (Invitrogen) secondary antibodies and 4′,6-diamidino-2-phenylindole (Invitrogen). Coverslips were washed and mounted on microscope slides using Mowiol (Calbiochem) containing 2.5% (w/v) Dabco antifade reagent (Sigma-Aldrich). Confocal images were taken using a Leica AOBS SP2 confocal microscope (63×/1.4 NA oil-immersion lens and processed using Adobe Photoshop 9.0).
SDS-PAGE and Western Blotting
0.5−1×10⁶ cells were lysed for 10 min on ice in lysis buffer (20 mM Tris-HCl, pH 8.0, 137 mM NaCl, 10 mM EDTA, 100 mM NaF, 1% (v/v) Nonidet P-40, 10% (v/v) glycerol, 10 mM Na3VO4, 2 mM PMSF and protease inhibitors, Calbiochem). Omnicleave (10 U/µl, Epicentre) was added to lysis buffer supplemented with 10 mM MgCl2 to digest the DNA present in the nuclei pellets. Equal numbers of lysed reticulocytes and nuclei were loaded and separated by SDS-PAGE and then immunoblotted.
Results
Protein Distribution in Reticulocyte and Nuclei Populations by Proteomics
GPA expression combined with Hoechst staining was exploited to separate reticulocytes and extruded nuclei [15] produced by in vitro erythroblast culture [11], [12], [13]. Three discrete populations were identified by flow cytometry; the reticulocyte population (GPAhigh:Hoechstnegative), extruded nuclei (GPAlow:Hoechstpositive) and nucleated erythroblasts (GPAhigh, Hoechstpositive) (Figure 1A). These populations were isolated using FACS sorting, and cytospins (Figure 1B) confirmed the purity of the reticulocyte (95.3+/−0.65% (n = 3, +/− SEM)) and nuclei (96.9+/−0.56% (n = 3,+/− SEM)) populations.
Figure 1. FACs sorting of reticulocytes and extruded nuclei.

A) Extruded nuclei and reticulocytes were separated by fluorescence activated cell sorting based on fluorescence intensity of DNA (Hoechst) and GPA (BRIC256) staining as outlined in the Materials and Methods. B) Representative cytospins from the sorted reticulocyte (upper panel) and extruded nuclei (lower panel) populations are shown.
To determine the protein distribution during enucleation, a proteomic comparison of the reticulocyte and extruded nuclei populations was undertaken. Tables 1–4 show a summarised list of peptides detected in the reticulocyte and nuclei populations. Table 1 shows membrane protein peptides detected, Table 2 shows examples of cytoskeletal or cytoskeletal interacting proteins detected, Table 3 nuclear and ER proteins and Table 4 cytosolic proteins and endocytic machinery. As expected, reticulocytes were enriched for peptides of cytoskeletal and erythrocyte membrane proteins. In addition a host of peptides derived from proteins from other cellular compartments such as cytosolic enzymes and endocytic proteins (e.g. Lamp1, clathrin, adaptor proteins, dynamin, sorting nexins,) were enriched in reticulocytes.
Table 1. Proteomic profile of membrane protein distribution in sorted populations of reticulocytes and extruded nuclei.
| Nuclei | Reticulocytes | ||||
| Accession | Description | Total peptides | Unique peptides | Total peptides | Unique peptides |
| Q9HDC9 | Adipocyte plasma membrane-associated protein | 22 | 12 | 6 | 4 |
| Q02094 | Ammonium transporter Rh type A | 3 | 2 | 6 | 2 |
| B4DNW4 | Aquaporin 1 | 9 | 3 | 12 | 4 |
| Q5T5M0 | Aquaporin 7 | 4 | 1 | 3 | 1 |
| Q9NP58 | ATP-binding cassette sub-family B member 6, mitochondrial | 4 | 4 | 40 | 18 |
| P02730 | Band 3 anion transport protein | 195 | 28 | 477 | 36 |
| Q54A51 | Basigin | 36 | 8 | 32 | 8 |
| B6EAT9 | CD44 | 2 | 2 | 4 | 2 |
| E9PB22 | CD47 | 3 | 1 | ||
| Q99808 | Equilibrative nucleoside transporter 1 | 11 | 5 | 14 | 5 |
| Q96PL5 | Erythroid membrane-associated protein | 14 | 7 | ||
| O75955 | Flotillin-1 | 9 | 8 | 46 | 20 |
| Q14254 | Flotillin-2 | 6 | 5 | 42 | 20 |
| P11166 | Glucose transporter, type 1 | 51 | 10 | 78 | 12 |
| P04921 | Glycophorin-C | 13 | 2 | 29 | 3 |
| Q86SU0 | Immunoglobulin-like domain-containing receptor 1 | 9 | 1 | 1 | 1 |
| P20702 | Integrin alpha-X | 6 | 2 | 1 | 1 |
| P05556 | Integrin beta-1 | 11 | 7 | 2 | 2 |
| P23276 | Kell blood group glycoprotein | 6 | 4 | ||
| O75387 | Large neutral amino acids transporter small subunit 3 | 2 | 1 | 4 | 2 |
| P51811 | Membrane transport protein XK | 4 | 3 | ||
| O15173 | Membrane-associated progesterone receptor component 2 | 25 | 6 | 4 | 2 |
| P53985 | Monocarboxylate transporter 1 | 7 | 4 | 6 | 4 |
| O15439 | Multidrug resistance-associated protein 4 | 2 | 2 | 12 | 10 |
| Q6PIU2 | Neutral cholesterol ester hydrolase 1 | 52 | 16 | 12 | 7 |
| P20020 | Plasma membrane calcium-transporting ATPase 1 | 7 | 5 | 14 | 11 |
| Q16720 | Plasma membrane calcium-transporting ATPase 3 | 6 | 4 | 9 | 7 |
| P23634 | Plasma membrane calcium-transporting ATPase 4 | 12 | 10 | 20 | 16 |
| Q9Y4D8 | Probable E3 ubiquitin-protein ligase C12orf51 | 1 | 1 | 44 | 33 |
| Q5VSJ9 | Rh blood group, CcEe antigens | 3 | 2 | 8 | 4 |
| E9PS74 | SLC43A3 | 3 | 2 | 4 | 3 |
| Q96QG1 | Sodium/calcium exchanger SCL8A3 | 2 | 2 | ||
| B7Z3U6 | Sodium/potassium-transporting ATPase subunit alpha-1 | 14 | 9 | 14 | 12 |
| P54709 | Sodium/potassium-transporting ATPase subunit beta-3 | 4 | 3 | 2 | 2 |
| P27105 | Stomatin | 118 | 16 | 126 | 16 |
| Q9UJZ1 | Stomatin-like protein 2 | 5 | 4 | 13 | 11 |
| Q9H1E5 | Thioredoxin-related transmembrane protein 4 | 3 | 2 | ||
| A6NJC0 | TMCC2 | 65 | 13 | 18 | 6 |
| P02786 | Transferrin receptor protein 1 | 81 | 26 | 75 | 25 |
| B7Z1P7 | Transmembrane and coiled-coil domain family 2 | 151 | 25 | 36 | 15 |
| Q13336 | Urea transporter 1 | 2 | 2 | ||
| Q9Y6M5 | Zinc transporter 1 | 2 | 1 | 4 | 4 |
Sorted populations of reticulocytes and extruded nuclei were fractionated by 1D SDS-PAGE and subjected to Nano LC mass spectrometry. An abridged list containing key erythroid membrane proteins of interest is shown. Total peptide column is the total number of peptides (and therefore an indication of a particular protein’s abundance) detected in the population, whilst the unique peptide column indicates the number of unique peptides detected. To assess differences between nuclei and reticulocyte populations the total peptide number should be used.
Table 4. Proteomic profile of cytosolic and endocytic protein distribution in sorted populations of reticulocytes and extruded nuclei.
| Nuclei | Reticulocytes | ||||
| Accession | Description | Total peptides | Unique peptides | Total peptides | Unique peptides |
| P62258 | 14-3-3 protein epsilon | 43 | 16 | 85 | 20 |
| P61981 | 14-3-3 protein gamma | 26 | 12 | 34 | 11 |
| P63104 | 14-3-3 protein zeta/delta | 35 | 12 | 50 | 11 |
| Q01813 | 6-phosphofructokinase type C | 1 | 1 | 47 | 21 |
| B4DQJ8 | 6-phosphogluconate dehydrogenase, decarboxylating | 24 | 12 | 84 | 24 |
| P49588 | Alanyl-tRNA synthetase, cytoplasmic | 13 | 10 | 93 | 37 |
| Q10567 | AP-1 complex subunit beta-1 | 3 | 3 | 28 | 21 |
| O95782 | AP-2 complex subunit alpha-1 | 6 | 6 | 69 | 32 |
| P63010 | AP-2 complex subunit beta | 6 | 5 | 46 | 27 |
| Q2M2I8 | AP2-associated protein kinase 1 | 5 | 5 | ||
| C9JPM4 | ARF4 | 23 | 6 | 7 | 4 |
| P53396 | ATP-citrate synthase | 26 | 16 | 166 | 49 |
| P07738 | Bisphosphoglycerate mutase | 34 | 13 | 78 | 17 |
| P11586 | C-1-tetrahydrofolate synthase, cytoplasmic | 26 | 17 | 141 | 48 |
| P07384 | Calpain-1 catalytic subunit | 7 | 6 | 78 | 36 |
| P00915 | Carbonic anhydrase 1 | 32 | 11 | 64 | 14 |
| P00918 | Carbonic anhydrase 2 | 49 | 15 | 92 | 21 |
| P04040 | Catalase | 95 | 32 | 376 | 47 |
| Q00610 | Clathrin heavy chain 1 | 49 | 35 | 243 | 80 |
| P53675 | Clathrin heavy chain 2 | 6 | 6 | 40 | 17 |
| P30046 | D-dopachrome decarboxylase | 1 | 1 | 7 | 5 |
| Q16531 | DNA damage-binding protein 1 | 41 | 22 | 89 | 48 |
| P46734 | Dual specificity mitogen-activated protein kinase kinase 3 | 33 | 15 | 57 | 20 |
| P50570 | Dynamin-2 | 3 | 3 | 23 | 16 |
| E9PD66 | E3 ubiquitin-protein ligase HUWE1 | 12 | 7 | 118 | 84 |
| Q15075 | Early endosome antigen 1 | 2 | 2 | 1 | 1 |
| P13639 | Elongation factor 2 | 23 | 11 | 84 | 32 |
| P60842 | Eukaryotic initiation factor 4A-I | 52 | 18 | 90 | 23 |
| P49327 | Fatty acid synthase | 19 | 15 | 135 | 76 |
| P30043 | Flavin reductase | 123 | 16 | 253 | 19 |
| P04075 | Fructose-bisphosphate aldolase A | 55 | 20 | 181 | 31 |
| P11413 | Glucose-6-phosphate 1-dehydrogenase | 13 | 9 | 84 | 31 |
| P48506 | Glutamate–cysteine ligase catalytic subunit | 4 | 4 | 81 | 31 |
| E7EU54 | Glyceraldehyde-3-phosphate dehydrogenase | 42 | 11 | 104 | 14 |
| P49840 | Glycogen synthase kinase-3 alpha | 3 | 3 | 7 | 4 |
| P08107 | Heat shock 70 kDa protein 1A/1B | 77 | 23 | 96 | 32 |
| P34932 | Heat shock 70 kDa protein 4 | 10 | 7 | 77 | 35 |
| P17066 | Heat shock 70 kDa protein 6 | 39 | 9 | 35 | 8 |
| P07900 | Heat shock protein HSP 90-alpha | 114 | 35 | 177 | 45 |
| P08238 | Heat shock protein HSP 90-beta | 77 | 31 | 94 | 33 |
| P54652 | Heat shock-related 70 kDa protein 2 | 61 | 11 | 54 | 12 |
| P69905 | Hemoglobin subunit alpha | 532 | 14 | 713 | 17 |
| P68871 | Hemoglobin subunit beta | 802 | 20 | 1199 | 21 |
| P07195 | L-lactate dehydrogenase B chain | 35 | 14 | 118 | 23 |
| P11279 | Lysosome-associated membrane glycoprotein 1 | 3 | 2 | 10 | 5 |
| P32119 | Peroxiredoxin-2 | 107 | 18 | 282 | 18 |
| P30041 | Peroxiredoxin-6 | 41 | 13 | 95 | 18 |
| Q13492 | Phosphatidylinositol-binding clathrin assembly protein | 1 | 1 | 18 | 13 |
| P00558 | Phosphoglycerate kinase 1 | 46 | 20 | 102 | 28 |
| F2Z2J9 | Phosphoglycerate mutase | 1 | 1 | 55 | 15 |
| P08397 | Porphobilinogen deaminase | 55 | 18 | 111 | 22 |
| Q9UKV8 | Protein argonaute-2 | 6 | 4 | 43 | 22 |
| P00491 | Purine nucleoside phosphorylase | 67 | 16 | 141 | 21 |
| P30613 | Pyruvate kinase isozymes R/L | 17 | 13 | 97 | 32 |
| P50395 | Rab GDP dissociation inhibitor beta | 54 | 28 | 132 | 40 |
| Q96NA2 | Rab-interacting lysosomal protein | 2 | 2 | 27 | 14 |
| Q99986 | Serine/threonine-protein kinase VRK1 | 41 | 20 | ||
| F5GWT4 | Serine/threonine-protein kinase WNK1 | 1 | 1 | 24 | 20 |
| A6NKH4 | Sorting nexin 1 | 8 | 7 | ||
| B4DEK4 | Sorting nexin 2 | 1 | 1 | 16 | 13 |
| Q9NRS6 | Sorting nexin-15 | 3 | 3 | ||
| Q9Y5X3 | Sorting nexin-5 | 1 | 1 | 4 | 4 |
| Q9UNH7 | Sorting nexin-6 | 2 | 1 | 10 | 9 |
| Q9Y5X1 | Sorting nexin-9 | 4 | 3 | ||
| Q9H2G2 | STE20-like serine/threonine-protein kinase | 1 | 1 | 22 | 16 |
| P31948 | Stress-induced-phosphoprotein 1 | 28 | 17 | 101 | 39 |
| P17987 | T-complex protein 1 subunit alpha | 43 | 22 | 122 | 31 |
| P37837 | Transaldolase | 44 | 20 | 74 | 26 |
| P29401 | Transketolase | 42 | 14 | 117 | 33 |
| P60174 | Triosephosphate isomerase | 44 | 15 | 104 | 23 |
| P29144 | Tripeptidyl-peptidase 2 | 1 | 1 | 78 | 45 |
| P54578 | Ubiquitin carboxyl-terminal hydrolase 14 | 18 | 9 | 87 | 27 |
| Q9C0C9 | Ubiquitin-conjugating enzyme E2 O | 5 | 3 | 77 | 37 |
| Q96RL7 | Vacuolar protein sorting-associated protein 13A | 11 | 9 | ||
| F5GYF5 | Vacuolar protein sorting-associated protein 35 | 1 | 1 | 14 | 11 |
Sorted populations of reticulocytes and extruded nuclei were fractionated by 1D SDS-PAGE and subjected to Nano LC mass spectrometry. An abridged list containing key cytosolic and endocytic proteins of interest is shown. Total peptide column is the total number of peptides (and therefore an indication of a particular protein’s abundance) detected in the population, whilst the unique peptide column indicates the number of unique peptides detected. To assess differences between nuclei and reticulocyte populations the total peptide number should be used.
Table 2. Proteomic profile of erythroid cytoskeletal protein distribution in sorted populations of reticulocytes and extruded nuclei.
| Nuclei | Reticulocytes | ||||
| Accession | Description | Total peptides | Unique peptides | Total peptides | Unique peptides |
| Q00013 | 55 kDa erythrocyte membrane protein | 27 | 15 | 93 | 27 |
| P68032 | Actin, alpha cardiac muscle | 116 | 16 | 127 | 15 |
| P60709 | Actin, cytoplasmic | 223 | 25 | 228 | 24 |
| P61160 | Actin-related protein 2 | 6 | 5 | 22 | 11 |
| O15143 | Actin-related protein 2/3 complex subunit 1B | 2 | 2 | 14 | 7 |
| O15144 | Actin-related protein 2/3 complex subunit 2 | 4 | 3 | 25 | 11 |
| P61158 | Actin-related protein 3 | 12 | 9 | 44 | 15 |
| O43707 | Alpha-actinin-4 | 4 | 4 | 12 | 7 |
| P35611 | Alpha-adducin | 9 | 5 | 78 | 20 |
| P16157 | Ankyrin-1 | 123 | 65 | 476 | 104 |
| E9PE32 | Ankyrin-3 | 8 | 5 | 31 | 9 |
| Q562R1 | Beta-actin-like protein 2 | 41 | 6 | 46 | 6 |
| P35612 | Beta-adducin | 72 | 25 | ||
| B1AK87 | Capping protein (Actin filament) muscle Z-line, beta | 10 | 4 | 43 | 12 |
| Q96H99 | Cortactin | 1 | 1 | 20 | 13 |
| Q08495 | Dematin | 16 | 10 | 83 | 21 |
| A8K8J9 | Dynactin 2 (P50), isoform CRA_b | 6 | 5 | 32 | 16 |
| Q4KKX0 | Erythrocyte membrane protein band 4.2 | 30 | 13 | 164 | 40 |
| P21333 | Filamin-A | 27 | 23 | 94 | 66 |
| Q9UEY8 | Gamma-adducin | 14 | 7 | ||
| A2A418 | Gelsolin | 23 | 9 | 15 | 7 |
| P33176 | Kinesin-1 heavy chain | 17 | 12 | ||
| Q15691 | Microtubule-associated protein RP/EB family member 1 | 5 | 3 | 12 | 8 |
| P12829 | Myosin light chain 4 | 10 | 5 | 24 | 8 |
| P60660 | Myosin light polypeptide 6 | 3 | 1 | 4 | 3 |
| Q3MIV8 | Myosin, heavy chain 11, smooth muscle | 12 | 9 | 43 | 19 |
| P35580 | Myosin-10 | 48 | 38 | 210 | 106 |
| Q7Z406 | Myosin-14 | 10 | 8 | 25 | 12 |
| P35579 | Myosin-9 | 75 | 54 | 373 | 124 |
| P11171 | Protein 4.1 | 38 | 17 | 159 | 33 |
| P02549 | Spectrin alpha chain, erythrocyte | 138 | 87 | 735 | 176 |
| P11277 | Spectrin beta chain, erythrocyte | 105 | 70 | 637 | 165 |
| Q9Y490 | Talin-1 | 66 | 48 | 224 | 102 |
| Q9Y4G6 | Talin-2 | 6 | 6 | 24 | 11 |
| P28289 | Tropomodulin-1 | 4 | 4 | 32 | 16 |
| D9YZV5 | Tropomyosin 1 (Alpha) isoform 4 | 9 | 5 | 10 | 4 |
| Q5VU58 | Tropomyosin 3 | 19 | 9 | 37 | 12 |
| P06753 | Tropomyosin alpha-3 chain | 11 | 6 | 18 | 6 |
| Q71U36 | Tubulin alpha-1 chain | 61 | 13 | 141 | 21 |
| P07437 | Tubulin beta chain | 89 | 23 | 249 | 28 |
| A8MUB1 | Tubulin, alpha 1 (Testis specific) | 49 | 9 | 119 | 20 |
| B3KPW9 | Tubulin, alpha 8 | 33 | 7 | 80 | 13 |
| B3KS31 | Tubulin, beta 6 | 23 | 7 | 61 | 9 |
| P18206 | Vinculin | 9 | 6 | 57 | 35 |
Sorted populations of reticulocytes and extruded nuclei were fractionated by 1D SDS-PAGE and subjected to Nano LC mass spectrometry. An abridged list containing key cytoskeletal proteins of interest is shown. Total peptide column is the total number of peptides (and therefore an indication of a particular protein’s abundance) detected in the population, whilst the unique peptide column indicates the number of unique peptides detected. To assess differences between nuclei and reticulocyte populations the total peptide number should be used.
Table 3. Proteomic profile of nuclear and ER protein distribution in sorted populations of reticulocytes and extruded nuclei.
| Nuclei | Reticulocytes | ||||
| Accession | Description | Total peptides | Unique peptides | Total peptides | Unique peptides |
| P11021 | 78 kDa glucose-regulated protein | 96 | 30 | 48 | 24 |
| P46013 | Antigen KI-67 | 262 | 132 | 14 | 12 |
| O00148 | ATP-dependent RNA helicase DDX39A | 57 | 19 | 18 | 9 |
| Q8IWX8 | Calcium homeostasis endoplasmic reticulum protein | 3 | 3 | ||
| P27824 | Calnexin | 45 | 15 | 8 | 5 |
| P27797 | Calreticulin | 95 | 16 | 27 | 13 |
| P11387 | DNA topoisomerase 1 | 129 | 33 | 2 | 2 |
| P78527 | DNA-dependent protein kinase catalytic subunit | 194 | 113 | 55 | 47 |
| O60762 | Dolichol-phosphate mannosyltransferase | 21 | 15 | ||
| P39656 | Dolichyl-diphosphooligosaccharide–protein glycosyltransferase 48 kDa subunit | 20 | 11 | 4 | 4 |
| P04843 | Dolichyl-diphosphooligosaccharide–protein glycosyltransferase subunit 1 | 56 | 26 | 9 | 7 |
| P49792 | E3 SUMO-protein ligase RanBP2 | 61 | 47 | ||
| Q9NZ08 | Endoplasmic reticulum aminopeptidase 1 | 4 | 4 | ||
| P30040 | Endoplasmic reticulum resident protein 29 | 20 | 8 | 3 | 1 |
| Q9BS26 | Endoplasmic reticulum resident protein 44 | 16 | 9 | 6 | 3 |
| Q969X5 | Endoplasmic reticulum-Golgi intermediate compartment protein 1 | 3 | 3 | ||
| P14625 | Endoplasmin | 33 | 22 | 12 | 9 |
| Q9P0I2 | ER membrane protein complex subunit 3 | 3 | 3 | ||
| O75396 | ER-Golgi SNARE of 24 kDa | 40 | 11 | 8 | 5 |
| Q9Y5B9 | FACT complex subunit SPT16 | 62 | 30 | 4 | 4 |
| A8K318 | Glucosidase 2 subunit beta | 23 | 13 | 6 | 6 |
| P09601 | Heme oxygenase 1 | 16 | 9 | ||
| Q9BXL5 | Hemogen | 119 | 21 | 42 | 16 |
| Q5SSJ5 | Heterochromatin protein 1-binding protein 3 | 40 | 18 | 1 | 1 |
| P09429 | High mobility group protein B1 | 160 | 16 | 14 | 5 |
| P26583 | High mobility group protein B2 | 188 | 17 | 23 | 10 |
| Q02539 | Histone H1.1 | 144 | 10 | 18 | 4 |
| P04908 | Histone H2A type 1-B/E | 182 | 6 | 14 | 4 |
| P68431 | Histone H3.1 | 117 | 12 | 22 | 5 |
| P62805 | Histone H4 | 266 | 14 | 33 | 10 |
| Q5TCI8 | Lamin A/C | 212 | 43 | 40 | 19 |
| P42166 | Lamina-associated polypeptide 2, isoform alpha | 148 | 34 | 11 | 5 |
| P42167 | Lamina-associated polypeptide 2, isoforms beta/gamma | 137 | 22 | 13 | 7 |
| Q14739 | Lamin-B receptor | 53 | 17 | 2 | 2 |
| P20700 | Lamin-B1 | 162 | 43 | 22 | 13 |
| Q03252 | Lamin-B2 | 103 | 35 | 5 | 4 |
| P43243 | Matrin-3 | 28 | 13 | 5 | 2 |
| Q8N4V1 | Membrane magnesium transporter 1 | 2 | 1 | ||
| Q9UNW1 | Multiple inositol polyphosphate phosphatase 1 | 25 | 14 | 5 | 5 |
| Q8NFW8 | N-acylneuraminate cytidylyltransferase | 111 | 24 | 8 | 4 |
| Q14697 | Neutral alpha-glucosidase AB | 88 | 32 | 22 | 14 |
| Q8N1F7 | Nuclear pore complex protein Nup93 | 33 | 18 | 6 | 4 |
| Q8TEM1 | Nuclear pore membrane glycoprotein 210 | 60 | 33 | 2 | 2 |
| Q9NR30 | Nucleolar RNA helicase 2 | 39 | 20 | ||
| P19338 | Nucleolin | 99 | 32 | 18 | 15 |
| Q5SRE5 | Nucleoporin NUP188 homolog | 15 | 13 | 1 | 1 |
| P12270 | Nucleoprotein TPR | 105 | 68 | 17 | 12 |
| P02545 | Prelamin-A/C | 284 | 56 | 54 | 26 |
| P07237 | Protein disulfide-isomerase | 74 | 22 | 27 | 16 |
| P13667 | Protein disulfide-isomerase A4 | 7 | 7 | ||
| B7Z254 | Protein disulfide-isomerase A6 | 24 | 12 | 7 | 5 |
| P49257 | Protein ERGIC-53 | 3 | 3 | 3 | 2 |
| Q5JYR6 | Ribophorin II | 31 | 10 | 5 | 3 |
| P55072 | Transitional endoplasmic reticulum ATPase | 57 | 25 | 133 | 50 |
| Q9NYU2 | UDP-glucose:glycoprotein glucosyltransferase 1 | 75 | 45 | 28 | 19 |
| O95292 | Vesicle-associated membrane protein-associated protein B/C | 11 | 3 | 2 | 1 |
Sorted populations of reticulocytes and extruded nuclei were fractionated by 1D SDS-PAGE and subjected to Nano LC mass spectrometry. An abridged list containing key nuclear proteins and ER proteins of interest is shown. Total peptide column is the total number of peptides (and therefore an indication of a particular protein’s abundance) detected in the population, whilst the unique peptide column indicates the number of unique peptides detected. To assess differences between nuclei and reticulocyte populations the total peptide number should be used.
The extruded nuclei population was enriched for peptides from nuclear proteins (e.g. histones, lamins, DNA topoisomerase, nuclear pore proteins), ER proteins (e.g. PDI, calnexin, calreticulin), and a number of membrane proteins (e.g. integrins). Generally, low numbers of erythrocyte membrane protein peptides were detected in the nuclei but equal numbers of peptides for several membrane proteins including stomatin, transferrin receptor, Na+K+ ATPase and basigin were detected in both the nuclei and reticulocyte samples. Interestingly, peptides from actin and actin binding proteins (e.g cortactin, actinin, ARP 2/3 components) were also detected in the nuclei population, suggesting that some actin and associated proteins are lost with the nucleus at this stage, reflecting their additional role in nuclear processes [16]. It is notable that although higher numbers of peptides for band 3, CD44, GPC, Glut1 and Aquaporin1 were detected in the reticulocytes, considerable numbers of peptides for these proteins were also detected in the nuclei sample. Overall this proteomic dataset confirms the enrichment of erythroid membrane proteins to the reticulocyte and also reflects the fact that the extruded nucleus contains ER proteins, a proportion of cytosol and is surrounded by plasma membrane.
Distribution of Membrane Proteins in Reticulocyte and Nuclei Populations by Western Blotting
The partitioning observed for key membrane and cytoskeletal proteins using proteomics was confirmed by western blotting (Figure 2A–B). Importantly, cytoskeletal proteins (alpha and beta spectrin) or cytoskeletal adaptor proteins (ankyrin, 4.1, adducin, protein 4.2) were clearly restricted to the reticulocyte. Interestingly two components of the erythroid cytoskeleton, p55 and actin, were not totally restricted (Figure 2B). Lamin B, a protein of the nuclear lamina, was found only in the nuclei illustrating the purity of the reticulocyte and nuclei populations (Figure 2C). Nuclei contained high levels of the ER protein calnexin consistent with the loss of the majority of the ER with the nucleus (Figure 2D). Some membrane proteins (e.g. Rh and RhAG) were barely detectable in the nuclei population by western blot, highlighting the sensitivity of the mass spectrometry approach and the heightened retention of these proteins in reticulocytes. Importantly, we consistently detected significant amounts of band 3, GPC, CD44 and Glut1 in both reticulocyte and nuclei samples highlighting differential retention of specific membrane proteins to the reticulocyte during the enucleation process. This work also highlights enucleation as a significant stage of stomatin loss, since stomatin partitioned equally between reticulocyte and nuclei populations whereas another lipid microdomain protein, flotillin-2, was restricted to reticulocytes (Figure 2A).
Figure 2. Erythroid protein distribution in sorted populations of reticulocytes and extruded nuclei.

Sorted populations of extruded nuclei and reticulocytes were lysed and either 5×10⁵ or 1×10⁶ reticulocytes and nuclei were loaded depending on the protein expression levels or antibody sensitivity. Western blotting was conducted on A) membrane proteins using a mouse monoclonal antibody to Band 3, rabbit polyclonals to RhAG, Rh, Flotillin-2, Glut1, GPC, CD44 and stomatin and a rabbit monoclonal to beta 1 integrin B) cytoskeletal proteins using mouse monoclonal antibodies to alpha spectrin, beta spectrin, ankyrin, protein 4.2 and actin and rabbit polyclonals to alpha adducin, protein 4.1 and p55. C) nuclear protein Lamin B using a goat polyclonal. D) ER protein calnexin using a monoclonal antibody. Blots for RhAG, Rh, band 3, GPC, CD44, alpha spectrin, beta spectrin, ankyrin, protein 4.2 and lamin B are representative of 3–4 repeats from 3–4 independent cultures and sorting experiments. Blots for flotillin-2, Glut1, stomatin, beta 1 integrin, alpha adducin, protein 4.1, p55, actin and calnexin are representative of 2 repeats from 2 independent cultures and sorting experiments. All western blots shown were conducted on material isolated from the same reticulocyte and nuclei sorting experiment.
Imaging Protein Distribution during Early and Late Stages of Enucleation
To investigate the localisation and distribution of cytoskeletal and membrane proteins during enucleation, confocal imaging of acrolein fixed erythroblasts was undertaken (Figure 3). No obvious change in membrane protein distribution was observed during the early stages of nuclear extrusion (top row, Figure 3) where the nucleus has polarised and begins to deform the membrane. However, in cells where the nucleus is being deformed as it is squeezed out of the cell (bottom row, Figure 3), complete or partial partitioning of certain erythroid membrane proteins (GPA, GPC, Rh, RhAG and CD47) and cytoskeletal proteins/cytoskeleton associated proteins (alpha spectrin, beta spectrin and ankyrin) to the reticulocyte was observed. We conclude that remodelling of the cytoskeleton and of the majority of membrane components occurs during the late stages of enucleation. Confocal imaging of the ER protein Protein Disulphide Isomerase (PDI) confirmed that ER membrane surrounding the nucleus partitions with the nuclei (Figure 4A). Although the majority of the PDI staining localised as a ring around the nucleus, some remnants of PDI were observed in nascent reticulocytes (results not shown) further supporting the distribution of calnexin shown by Western blot in Figure 2D.
Figure 3. Immunofluorescence of membrane and cytoskeletal protein localisation during human erythroblast enucleation.
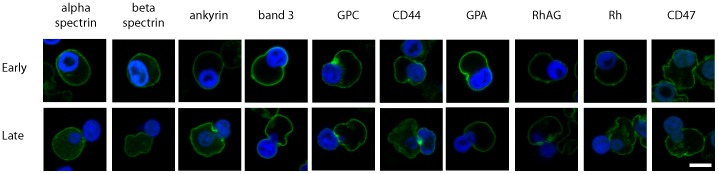
Human orthochromatic erythroblasts undergoing enucleation after 144 h of differentiation were removed from culture, fixed in 0.5% acrolein and permeabilised using 0.05% Triton X-100. Images shown are slices through cells in early (upper row) and late stages (lower row) of the enucleation process and detected with monoclonal antibodies against alpha spectrin, beta spectrin, ankyrin, band 3, GPC, GPA, RhAG, Rh, CD47 and a rabbit polyclonal antibody against CD44 and a suitable species specific fluorescent secondary as described in materials and methods. N = 5 for each antibody (although generally between 5–20) except for beta spectrin due to problems with high background fluorescence in the nucleus. Scale bar = 5 µm.
Figure 4. Immunofluorescence microscopy confirms that band 3 and ER are lost during nuclear extrusion.

Human orthochromatic erythroblasts undergoing enucleation after 144 h of differentiation were removed from culture, fixed in 0.5% acrolein and permeabilised using 0.05% Triton X-100. A) Confocal section of enucleating cells labelled with PDI and band 3 antibodies. B) Confocal section showing extruded nuclei (marked with arrows) labelled with band 3 (BRIC170). C) Confocal section of an erythroblast in the late stage of enucleation co-labelled with ankyrin and band 3 antibodies. The non-association of band 3 with ankyrin was observed in every cell identified at the late stage of enucleation (n = 10). Scale bar represents 5 µm.
Interestingly, Figure 3 shows by immunofluorescence that band 3 and CD44 were distributed evenly around the plasma membrane surrounding both the reticulocyte and nucleus throughout enucleation. Band 3 was also detected on isolated extruded nuclei (Figure 4B). However, proteins which connect band 3 to the spectrin cytoskeleton (protein 4.2 and ankyrin) together with other membrane proteins located within band 3 multiprotein complexes (Rh, RhAG, CD47, GPA) were largely excluded from the extruding nucleus as illustrated in Figure 3 and by the co-labelling of band 3 and ankyrin (Figure 4C).
Discussion
We have provided the most detailed study to date of the protein distribution between reticulocytes and the extruded nuclei. This has confirmed that many erythroid membrane and cytoskeletal proteins partition predominantly or exclusively to the reticulocyte during this process. In contrast, nuclear proteins, ER proteins, and a contingent of cytosolic and plasma membrane proteins distribute with the extruded nucleus. This is consistent with observations using electron microscopy where the extruded nucleus is described as being accompanied by a thin rim of cytoplasm, surrounded by plasma membrane [17], [18]. Furthermore, we have demonstrated here that the majority of the ER is lost with the extruded nucleus, building on the observation by imaging that the ER protein calreticulin is lost with the nucleus [11]. ER remnants are still detectable by western blotting (see Figure 2D) and by confocal imaging (results not shown) in the reticulocyte, which we presume are lost upon further reticulocyte maturation.
This work highlights the enucleation step as a significant point of membrane remodelling in human erythropoiesis where excess erythroid membrane proteins are discarded. Unlike in mouse erythroblasts [5], [6], a significant population of human band 3 and to a lesser extent GPC is lost during enucleation. The apparent disparity in distribution, particularly for band 3, between species during enucleation may be due to intrinsic differences in the membrane protein complex composition known to exist between mice and humans [10] or due to mechanistic differences in the process of erythroblast protein sorting. Other membrane proteins were lost during enucleation including CD44, Glut1 and stomatin. For CD44, this further compounds the loss observed in human in vitro cultures during terminal differentiation [19] and since CD44 can bind ankyrin, this additional loss may result from continued competition for ankyrin binding sites with the band 3 population.
It is interesting that several of the proteins lost with the nucleus during enucleation are located in membrane protein complexes. Glut1 and band 3 interact in vitro [20] and stomatin interacts with the C-terminus of Glut1 [21]. Similarly an association may also exist between the GPC and p55 [22] observed in the nuclei population. The loss of these proteins with the nucleus, taken in conjunction with the restriction of the majority of membrane proteins to the reticulocyte, suggests that these represent proteins/complexes that are most likely synthesized in excess which are not attached to the cytoskeleton (e.g. by incorporation into ankyrin or junctional complexes) leaving them vulnerable to loss during enucleation. In addition, low numbers of peptides were detected in the nuclei relative to the reticulocytes for several cytosolic enzymes (e.g. 6-phosphofructokinase and calpain; see Table 4), therefore a mechanism may also exist for segregation of certain key cytosolic proteins in the reticulocyte, perhaps by incorporation into membrane/cytoskeletal complexes.
In summary, isolated pure populations of human reticulocytes and nuclei have been used to study protein partitioning during human erythroblast enucleation. This work is the first reported proteomic dataset for reticulocytes and extruded nuclei and provides the foundations for investigating reticulocyte maturation, sorting defects in human erythrocyte membrane disorders, and for comparison of protein sorting using erythroblasts produced using other cell sources (e.g. iPS or embryonic stem cells). Our observations here during human enucleation are generally supportive of the hypothesis that the cytoskeleton plays an important part in the segregation of membrane proteins to the reticulocyte during enucleation. Nevertheless in humans the partitioning and retention of specific proteins including the abundantly expressed band 3 to the reticulocyte, occurs in a less definitive manner than observed in mice. Further studies are needed to establish whether the loss of proteins during enucleation in human erythroblasts is an active or passive process and to ascertain whether disruption of the cytoskeleton, mimicking that of hereditary anaemias, leads to additional loss of proteins in humans in the same manner as has been reported in mice.
Acknowledgments
The authors thank Professor Jon Morrow (Yale University) for the gift of GFP tagged alpha and beta spectrin. Dr Lesley Bruce (NHSBT Filton) for providing the rabbit polyclonal anti-stomatin antibody and Dr Steve Parsons (NHSBT Filton) for providing the rabbit polyclonal anti-CD44.
Funding Statement
AB was funded by a Wellcome Trust PhD studentship and TJS by a Wellcome Trust project grant (094277). This work was funded in part by National Institute for Health Research programme grant to NHSBT (RP-PG-0310-1004 -AMT) and by NHSBT R&D. The funders had no role in study design, data collection and analysis, decision to publish, or preparation of the manuscript.
References
- 1. Keerthivasan G, Wickrema A, Crispino JD (2011) Erythroblast enucleation. Stem Cells Int 2011: 139851. [DOI] [PMC free article] [PubMed] [Google Scholar]
- 2. Geiduschek JB, Singer SJ (1979) Molecular changes in the membranes of mouse erythroid cells accompanying differentiation. Cell 16: 149–163. [DOI] [PubMed] [Google Scholar]
- 3. Koury ST, Koury MJ, Bondurant MC (1989) Cytoskeletal distribution and function during the maturation and enucleation of mammalian erythroblasts. J Cell Biol 109: 3005–3013. [DOI] [PMC free article] [PubMed] [Google Scholar]
- 4. Wang J, Ramirez T, Ji P, Jayapal SR, Lodish HF, et al. (2012) Mammalian erythroblast enucleation requires PI3K-dependent cell polarization. J Cell Sci 125: 340–349. [DOI] [PMC free article] [PubMed] [Google Scholar]
- 5. Salomao M, Chen K, Villalobos J, Mohandas N, An X, et al. (2010) Hereditary spherocytosis and hereditary elliptocytosis: aberrant protein sorting during erythroblast enucleation. Blood 116: 267–269. [DOI] [PMC free article] [PubMed] [Google Scholar]
- 6. Patel VP, Lodish HF (1987) A fibronectin matrix is required for differentiation of murine erythroleukemia cells into reticulocytes. J Cell Biol 105: 3105–3118. [DOI] [PMC free article] [PubMed] [Google Scholar]
- 7. Lee JC, Gimm JA, Lo AJ, Koury MJ, Krauss SW, et al. (2004) Mechanism of protein sorting during erythroblast enucleation: role of cytoskeletal connectivity. Blood 103: 1912–1919. [DOI] [PubMed] [Google Scholar]
- 8. May JM, Qu ZC, Qiao H, Koury MJ (2007) Maturational loss of the vitamin C transporter in erythrocytes. Biochemical and Biophysical Research Communications 360: 295–298. [DOI] [PMC free article] [PubMed] [Google Scholar]
- 9. Soni S, Bala S, Gwynn B, Sahr KE, Peters LL, et al. (2006) Absence of erythroblast macrophage protein (Emp) leads to failure of erythroblast nuclear extrusion. J Biol Chem 281: 20181–20189. [DOI] [PubMed] [Google Scholar]
- 10. van den Akker E, Satchwell TJ, Williamson RC, Toye AM (2010) Band 3 multiprotein complexes in the red cell membrane; of mice and men. Blood Cells Mol Dis 45: 1–8. [DOI] [PubMed] [Google Scholar]
- 11.Griffiths RE, Kupzig S, Cogan N, Mankelow TJ, Betin VM, et al. (2012) Maturing reticulocytes internalise plasma membrane in glycophorin A-containing vesicles which fuse with autophagosomes prior to exocytosis. Blood. [DOI] [PMC free article] [PubMed]
- 12. van den Akker E, Satchwell TJ, Pellegrin S, Daniels G, Toye AM (2010) The majority of the in vitro erythroid expansion potential resides in CD34(-) cells, outweighing the contribution of CD34(+) cells and significantly increasing the erythroblast yield from peripheral blood samples. Haematologica 95: 1594–1598. [DOI] [PMC free article] [PubMed] [Google Scholar]
- 13. Satchwell TJ, Bell AJ, Pellegrin S, Kupzig S, Ridgwell K, et al. (2011) Critical band 3 multiprotein complex interactions establish early during human erythropoiesis. Blood 118: 182–191. [DOI] [PMC free article] [PubMed] [Google Scholar]
- 14. Pellegrin S, Heesom KJ, Satchwell TJ, Hawley BR, Daniels G, et al. (2012) Differential proteomic analysis of human erythroblasts undergoing apoptosis induced by epo-withdrawal. Plos One 7: e38356. [DOI] [PMC free article] [PubMed] [Google Scholar]
- 15. Ji P, Jayapal SR, Lodish HF (2008) Enucleation of cultured mouse fetal erythroblasts requires Rac GTPases and mDia2. Nat Cell Biol 10: 314–321. [DOI] [PubMed] [Google Scholar]
- 16. Visa N, Percipalle P (2010) Nuclear functions of actin. Cold Spring Harb Perspect Biol 2: a000620. [DOI] [PMC free article] [PubMed] [Google Scholar]
- 17. Skutelsky E, Danon D (1967) An electron microscopic study of nuclear elimination from the late erythroblast. J Cell Biol 33: 625–635. [DOI] [PMC free article] [PubMed] [Google Scholar]
- 18. Simpson CF, Kling JM (1967) The mechanism of denucleation in circulating erythroblasts. J Cell Biol 35: 237–245. [DOI] [PMC free article] [PubMed] [Google Scholar]
- 19. van den Akker E, Satchwell TJ, Pellegrin S, Flatt JF, Maigre M, et al. (2010) Investigating the key membrane protein changes during in vitro erythropoiesis of protein 4.2 (-) cells (mutations Chartres 1 and 2). Haematologica 95: 1278–1286. [DOI] [PMC free article] [PubMed] [Google Scholar]
- 20. Jiang W, Ding Y, Su Y, Jiang M, Hu X, et al. (2006) Interaction of glucose transporter 1 with anion exchanger 1 in vitro. Biochem Biophys Res Commun 339: 1255–1261. [DOI] [PubMed] [Google Scholar]
- 21. Zhang JZ, Abbud W, Prohaska R, Ismail-Beigi F (2001) Overexpression of stomatin depresses GLUT-1 glucose transporter activity. Am J Physiol Cell Physiol 280: C1277–1283. [DOI] [PubMed] [Google Scholar]
- 22. Marfatia SM, Morais-Cabral JH, Kim AC, Byron O, Chishti AH (1997) The PDZ domain of human erythrocyte p55 mediates its binding to the cytoplasmic carboxyl terminus of glycophorin C. Analysis of the binding interface by in vitro mutagenesis. J Biol Chem 272: 24191–24197. [DOI] [PubMed] [Google Scholar]