

Abstract
Despite living in an obesogenic environment, some individuals maintain a thin phenotype compared to the majority who are at risk for weight gain and obesity. Understanding how these different phenotypes regulate energy intake is critical. The objective of this study was to examine the differences in neuronal response to visual food cues in adults recruited as either obesity-resistant (OR) or obesity-prone (OP) based on self-identification, BMI, and personal/family weight history. 25 OR and 28 OP individuals were studied after 4 days of eucaloric energy intake. Functional magnetic resonance imaging (fMRI) was performed in the fasted and acute fed states (30 minutes after a test meal) while subjects viewed images of foods of high hedonic value and neutral non-food objects. Measures of appetite using visual analog scales were performed before and every 30 minutes after the test meal for 3 hours. In the fasted state, food as compared to nonfood images elicited significant response in the insula, somatosensory cortex, parietal cortex, and visual cortex in both OR and OP. The acute fed state resulted in significant attenuation of these and other brain areas in the OR but not OP individuals. Furthermore, OP as compared to OR individuals showed greater activation of medial and anterior prefrontal cortex (PFC) in response to the test meal. Adjusting for fat mass did not impact these results. Attenuation of insula/PFC response to food images in the fed state was associated with greater reductions in hunger. These findings suggest that individuals prone to weight gain and obesity have altered neuronal responses to food cues in brain regions known to be important in energy intake regulation. These altered responses may represent an important mechanism contributing to excess energy intake and risk for obesity.
Keywords: fMRI, neuroimaging, pre-obesity, overweight, insula, prefrontal cortex
1. Introduction
Obesity is a serious public health problem of dramatically rising prevalence in recent decades in the United States and the world, with two-thirds of adults in the U.S. currently classified as either overweight or obese [1]. While genes undoubtedly play an important role in the risk for obesity, genetic influences would not be expected to change over such a brief period of time, suggesting that environmental influences are playing a critical role in the current obesity epidemic [2]. Not all individuals, though, appear to be at risk for obesity despite being in the same obesogenic environment. An individual’s susceptibility to weight gain and obesity may relate to the capacity to adapt to these environmental influences. Moreover, those who appear to be predisposed to thinness may be able to more rapidly and accurately respond to food-related physiologic and environmental signals [3, 4].
Interactions between physiologic and both internal and external signals appear to be critical to the complex regulation of energy balance [5]. Advances in neuroimaging techniques have allowed us to better understand the neuroanatomical and neurophysiologic factors associated with energy balance regulation and how these processes may be altered in obesity. Most neuroimaging studies on obesity have focused on how the condition alters the cortical response to food cues using functional magnetic resonance imaging (fMRI) [4, 6–11]. These studies have generally found altered responses to visual, gustatory and olfactory cues associated with high-calorie foods in obesity. Regions of increased response include areas such as the hypothalamus, amygdala, hippocampus, orbitofrontal and prefrontal cortex, and insula [7, 10, 11]. Furthermore, our group has shown that reduced-obese individuals have a decreased ability to “turn off” the response to food cues after overfeeding as compared to thin individuals [4]. These studies suggest that obesity is not only associated with altered response to food cues, but also a deficit in the ability to modulate this response based on metabolic need. Furthermore, MRI studies have found that brain structure, as assessed by gray matter volume, is also altered in human obesity [12–17].
Although previous neuroimaging studies have shown that the obese phenotype is associated with structural and functional brain alterations, it is unclear whether these changes are a core feature of the condition that gives rise to the obese phenotype, i.e. in “at risk” individuals, or are simply a consequence of gained excess body fat. We thus designed the present study to examine the neuronal response to food cues in ‘never-obese’ individuals who identified themselves as being at risk for weight gain and obesity, i.e. obesity-prone (OP), as compared to thin individuals who identified themselves as being resistant to weight gain and obesity, i.e. obesity-resistant (OR). Subjects were empirically classified as OR or OP based on personal and family weight history, as previously defined, with a key feature of the characterization being the reliance on the subject’s own perception of their tendency to gain weight or not [17–19]. Studying OP individuals, as opposed to already obese or reduced-obese individuals, may reveal functional brain differences that may precede weight gain and obesity and therefore could be a causative mechanism and/or be used as a predictor of obesity risk. Furthermore, by further characterizing OR individuals we hope to develop better strategies for the prevention and treatment of overweight and obesity in those at risk. We hypothesized that an acute meal would result in significantly greater attenuation of the neuronal response to visual food cues (in a network of brain regions including the insula and prefrontal cortex) in OR as compared to OP individuals.
2. Methods
2.1. Research participants
This study was conducted according to the principles expressed in the Declaration of Helsinki and was approved by the Colorado Multiple Institutional Review Board. All research participants provided written informed consent for the collection of samples and subsequent analysis.
Subjects were recruited to have a propensity to be resistant to weight gain and obesity (obesity-resistant - OR) or to be prone to weight gain and obesity (obesity-prone - OP) as previously defined [17–19]. Subjects were 25–40 years of age (OR: 31.4±3.4 years; OP: 30.2±3.8 years, p=0.22) and were free of significant medical and psychiatric disease, including eating disorders as assessed by screening medical history, physical examination, biochemical testing and questionnaires (Eating Attitudes Test[20] and Center for Epidemiologic Studies depression Scale[21]).
Specifically, OR subjects responded to advertisements for “naturally thin people”. They defined themselves as constitutionally thin based on their perception of difficulty gaining weight, expending little effort to maintain their current body weight, and reporting a sense that their weight regulation was “different” from other people. OR subjects had a BMI of 17–25 kg/m2 (mean 20.8 ± 2.0 kg/m2) and reported no obese first degree relatives, never being overweight, weight stability despite few to no attempts to lose weight and no high levels of physical activity. OP subjects, in contrast, responded to advertisements for “people who struggle with their weight” and defined themselves as chronically struggling with body weight control. They had a BMI of 20–30 kg/m2 (mean 26.2 ± 2.9 kg/m2) and reported at least one obese first degree relative, a history of past weight fluctuations despite putting effort into not gaining weight, but were not actively attempting to lose weight and were weight stable for at least 3 months before being studied. Subjects were right-handed and could not have MRI exclusions. 28 subjects in each group were studied, but three subjects were removed from the analysis due to technical problems or head movement of greater than 2 mm during scanning. Thus, 25 OR (14 men, 11 women) and 28 OP individuals (14 men, 14 women) are included in the current analyses.
2.2. Study design and measurements
2.2.1 Baseline assessments
Subjects first underwent baseline assessments, including anthropometric measurements (body weight, height) and body composition (lean body mass, fat mass) measurement by dual-energy x-ray absorptiometry (DPX whole-body scanner, Lunar Radiation Corp., Madison, WI, USA).
2.2.2 Run-in diet
Subjects then completed a four day eucaloric run-in diet (50% carbohydrate, 30% fat, and 20% protein) to ensure energy and macronutrient balance. Estimates of daily energy needs were made using lean body mass plus an activity factor [22]. All food was prepared and provided by the University of Colorado Clinical and Translational Research Center (CTRC) metabolic kitchen. Subjects presented to the CTRC every morning for the four days to pick up the eucaloric diet. They were weighed, ate breakfast, and picked up the remainder of their daily meals in coolers. Subjects were asked to maintain their usual pattern of physical activity and were regularly questioned regarding activity and compliance. Subjects were asked to not consume any alcoholic or calorie-containing beverages during the study period. In women, studies were performed in the follicular phase of their menstrual cycle.
2.2.3. Study day
The next day, subjects presented to the outpatient clinic of the CTRC after an overnight fast of at least 10 hours. They first completed baseline (fasting) appetite ratings by visual analog scale (VAS) [3]. Hunger was rated by VAS on a line preceded by the question, “How hungry are you right now?” and anchored on the left by “not at all hungry” and by “extremely hungry” on the right. Subjects were then escorted to the Brain Imaging Center at the University of Colorado where they underwent fasting fMRI measures (described below). Subjects then consumed a liquid breakfast meal over 20 minutes. The caloric content of the liquid breakfast was equal to 25% of the energy provided during the run-in diet and had an identical macronutrient composition. Repeat fMRI measures were performed 30 minutes after the meal followed by repeat image ratings. Repeat appetite ratings by VAS were also performed 30, 90, 120, 150, and 180 minutes after the meal (60 minute ratings could not be performed due to subjects being in the MR scanner).
2.2.4 Functional Magnetic Resonance Imaging
Imaging studies were performed using a General Electric (Milwaukee, WI, USA) 3.0 T MR scanner equipped with high speed gradients (300 μs rise time and maximum gradient strength 24 mT/m). Prior to functional imaging, high-resolution, T1-weighted 3D anatomical scan over 10 minutes was acquired for each subject. Functional images were then acquired with an echo-planar gradient-echo T2* blood oxygenation level dependent (BOLD) imaging contrast technique, with TR = 2000 ms, TE = 30 ms, 642 matrix, 240 mm2 FOV, 27 axial slices angled parallel to the planum sphenoidale, 2.6 mm thick, 1.4 mm gap. Additionally, one inversion-recovery echo-planar-image (TI=505 ms) volume was acquired to improve coregistration between the echo planar images and gray matter templates used in pre-processing. The acquisition voxel size was 3.43 × 3.43 × 2.6 mm. Head motion was minimized with a VacFix head-conforming vacuum cushion (Par Scientific A/S, Odense, Denmark). Functional imaging was performed while the participants were presented visual stimuli using a projector and screen system. Previously validated visual stimuli consisted of three different categories: neutral nonfood-related objects, foods of high hedonic value, and foods of neutral hedonic value [23]. To reduce the potential for habituation, different but similar images were used in the two scanning sessions (fasted, fed). Because previous studies have shown that comparisons involving neutral food objects to be qualitatively similar but less sensitive [24], the primary analysis examined differences between hedonic foods and nonfood objects. Images of nonfood objects included images of sceneries, furniture, buildings, tools, vehicles, books, and others. Two runs were performed with each run consisting of a pseudo-randomized block design with 6 blocks of pictures of each category. Seven blocks of a low-level baseline (fixation cross) were also included in each run. Each block consisted of 4 stimuli shown for 4 seconds each for a total of 16 seconds per block. Four additional scans were acquired at the beginning of each run to minimize saturation effects. Subjects were asked lie quietly and to view the images.
2.3. Calculations and Statistical Analyses
fMRI data were analyzed using Statistical Parametric Mapping 8 software (SPM8, Wellcome Dept. of Imaging Neuroscience, London, England). Data analyses were blind to participant group. Data from each subject were realigned to the first echo-planar image, normalized to the Montreal Neurological Institute (MNI) template, using a gray-matter-segmented IR-EPI as an intermediate to improve registration, and smoothed with a 6 mm FWHM Gaussian kernel. Movement parameters derived from the realignment procedure were included in the model to reduce the effects of residual motion-related noise. The hemodynamic response was modeled with a double gamma function, without temporal derivatives, using the general linear model in SPM8. A 128s high pass filter was applied to remove low-frequency fluctuation in the BOLD signal. To account for both within-group and within-subject variance, a random effects analysis was implemented. Parameter estimates for each individual’s first level analysis (SPM contrast images) contrasting “hedonic food cues” to “nonfood objects” were entered into second-level repeated measures ANOVA. Comparisons across conditions (fasted-fed) were evaluated with directional contrasts (SPM t-contrasts). Results were considered significant at a whole-brain level if they exceeded a voxel-wise threshold of p < 0.01 and a cluster-level false discovery rate (FDR) threshold of q < 0.05. Results in all figures are statistical parametric maps (i.e. colored voxels indicate t-values), thresholded at the above level, overlaid on the group averaged anatomical image.
Non-imaging analyses were performed using SigmaStat software (Jandel Scientific, San Rafael, CA, USA). The total area under the curve (AUC) for hunger ratings was calculated using the Trapezoid Method, using all time points over three hours post-test meal. Group differences were analyzed using a two-sided t-test with significance set at a level of 0.05. Finally, the Pearson Product Correlation between the fMRI BOLD % signal change, relative to the global mean (local maxima) and appetite measures was examined.
3. Results
3.1. Subject Characteristics
25 OR and 28 OP subjects were studied. Compared to OR subjects, OP subjects had higher BMI (20.9 ± 2.0 vs. 26.2 ± 2.9 kg/m2, p < 0.001) and body fat mass (14.8 ± 13.7 vs. 23.8 ± 11.3 kg, p = 0.01) but had similar fat free mass (51.3 ± 10.8 vs. 56.1 ± 11.0 kg, p = 0.11). No significant group differences were seen in hunger ratings in either the fasted state (OR: 66±20 mm, OP: 70±23 mm, p=0.55) or in the AUC response to the test meal (OR: 7,325±3,259 mm/180 min, OP: 8,698±3,331 mm/180 min, p=0.14).
3.2. Obesity-Resistant Individuals
First we describe the neuronal responses to visual stimuli as measured by fMRI in the OR group. In the fasted state, images of foods of high hedonic value as compared to neutral nonfood objects resulted in greater activation of insula/inferior prefrontal cortex (PFC), somatosensory cortex, parietal cortex, and visual cortex (Figure 1 and Table 1). As shown in Figure 2 and Table 2, the acute fed state was associated with significant attenuation of the activation seen in the fasted state. Specifically, there was significantly reduced activation of the insula, inferior PFC, somatosensory cortex, visual cortex, putamen, and posterior cingulate cortex in the fed as compared to the fasted state. The fed state, however, was not associated with greater activation of any brain regions as compared to the fasted state in this group.
Figure 1. Neuronal response to visual foods cues in obesity-resistant (OR) individuals in the fasted state.
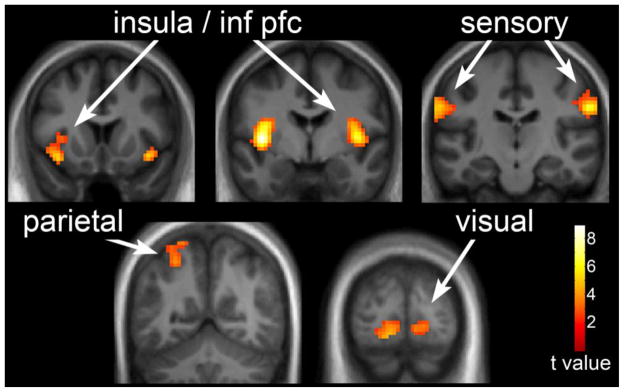
The neuronal response in OR individuals to visual stimuli of foods of high hedonic value as compared to non-food objects in the fasted state is shown. Robust activation is observed in the insula, sensory cortex, posterior cingulate, parietal cortex, and inferior temporal visual cortex. Statistical maps thresholded at a voxel-wise threshold of p < 0.01 and a cluster-level false discovery rate (FDR) threshold of q < 0.05 and overlaid onto the group averaged anatomical image. Data are shown in the neurological convention (right hemisphere on the right).
Table 1.
Response to visual food cues in the fasted state in obesity-resistant and obesity-prone individuals.
| Brain Region | MNI Coordinatesa | T Valueb | Cluster size | ||
|---|---|---|---|---|---|
| x | y | z | |||
| Obesity-Resistant | |||||
| Insula (L) | −39 | −4 | 4 | 8.88 | 269 |
| Insula (R) | 42 | −1 | 1 | 7.56 | 209 |
| Somatosensory Cortex (R) | 60 | −16 | 28 | 7.12 | 201 |
| Somatosensory Cortex (L) | −63 | −22 | 31 | 5.63 | 467 |
| Parietal Cortex (L) | −27 | −61 | 52 | 3.84 | |
| Visual Cortex (L) | −30 | −79 | −11 | 5.03 | 450 |
| Obesity-Prone | |||||
| Somatosensory cortex (L) | −60 | −19 | 31 | 10.99 | 1253 |
| Parietal cortex (L) | −24 | −67 | 40 | 5.17 | |
| Somatosensory cortex (R) | 60 | −13 | 25 | 7.96 | 1016 |
| Parietal cortex (R) | 27 | −67 | 43 | 4.32 | |
| Insula (R) | 39 | 8 | −11 | 9.87 | 479 |
| Insula (L) | −39 | −4 | 1 | 9.07 | 685 |
| Visual cortex (L) | −9 | −100 | 1 | 7.65 | 1560 |
| Posterior cingulate cortex (L) | −3 | −31 | 34 | 5.95 | 545 |
| Orbitofrontal cortex (L) | −12 | 50 | −5 | 4.17 | 211 |
Stereotactic coordinates in MNI space.
T values reported for local maxima within clusters. All values in table significant at a voxel-wise threshold of p < 0.01 and a cluster-corrected FDR threshold of q < 0.05.
Figure 2. Neuronal response in fasted as compared to fed state in obesity-resistant (OR) individuals.
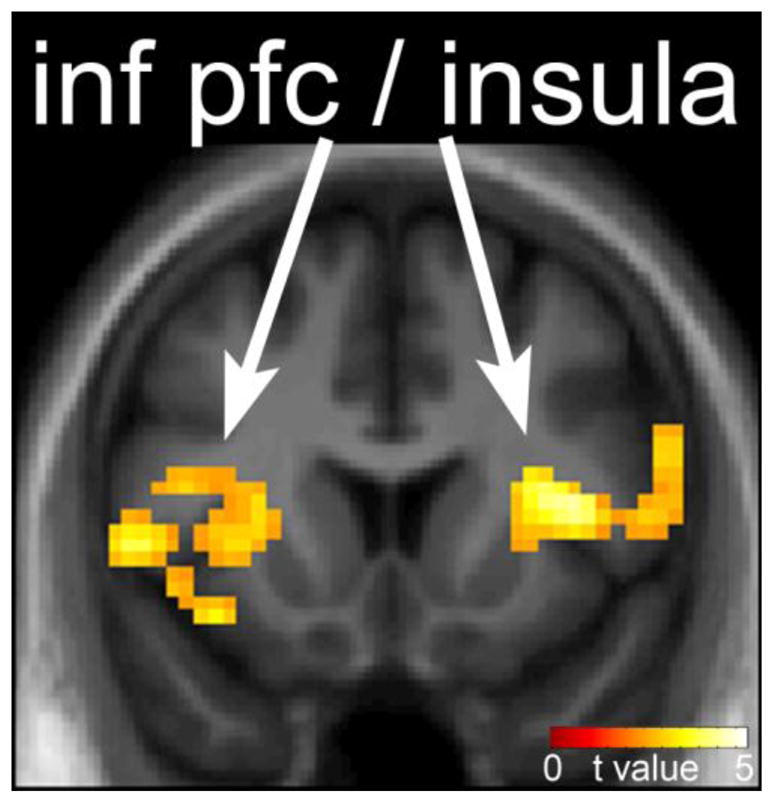
The difference in neuronal response to foods of high hedonic value in the fasted as compared to fed state in OR individuals is shown. Reduced response in the insula and prefrontal cortex is observed after the test meal. Statistical maps thresholded at a voxel-wise threshold of p < 0.01 and a cluster-level false discovery rate (FDR) threshold of q < 0.05 and overlaid onto the group averaged anatomical image. Data are shown in the neurological convention (right hemisphere on the right).
Table 2.
Altered response to visual food cues following a meal in obesity-resistant (OR) and obesity-prone (OP) Individuals.
| Brain Region | MNI Coordinatesa | T Valueb | Cluster sizec | ||
|---|---|---|---|---|---|
| x | y | z | |||
| Decreased response in obesity-resistant | |||||
| Visual cortex (L/R) | 0 | −94 | 7 | 5.16 | 444 |
| Insula (R) | 42 | 8 | 10 | 4.6 | 660 |
| Putamen (R) | 24 | −1 | 1 | 4.07 | |
| Prefrontal cortex (R) | 60 | 5 | 13 | 3.9 | |
| Insula (L) | −42 | −4 | 4 | 4.06 | 603 |
| Putamen (L) | −30 | −1 | 13 | 4.38 | |
| Prefrontal cortex (L) | −51 | 11 | 1 | 3.9 | |
| Somatosensory cortex (R) | 60 | −16 | 28 | 4.51 | 182 |
| Posterior cingulate cortex (L) | −15 | −31 | 40 | 3.74 | 593 |
| Increased response in obesity-prone | |||||
| Medial prefrontal cortex (L) | 0 | 20 | 55 | 4.8 | 662 |
| Lateral prefrontal cortex (L) | −54 | 29 | 10 | 4.54 | 238 |
| Inferior prefrontal cortex/Insula (R) | 39 | 20 | 13 | 4.23 | 183 |
| Dorsolateral prefrontal cortex (L) | −39 | 14 | 49 | 4.14 | 182 |
| Anterior prefrontal cortex (L) | −24 | 47 | 22 | 3.55 | 189 |
Stereotactic coordinates in MNI space.
T values reported for local maxima within clusters. All values in table significant at a voxel-wise threshold of p < 0.01 and a cluster-corrected FDR threshold of q < 0.05.
Responses in putamen and prefrontal cortex were included in a larger cluster with a local maximum located in the insula.
3.3. Obesity-Prone Individuals
The OP group had a similar response to images of foods of high hedonic value as the OR group in the fasted state, showing activation of insula, orbitofrontal cortex, somatosensory cortex, posterior cingulate cortex, parietal cortex, and visual cortex (Table 1). The fed state, however, was not associated with significant attenuation of any brain regions as compared to the fasted state. In fact, increased activation of the middle PFC, anterior PFC, lateral PFC, dorsolateral PFC, and insula/inferior PFC was observed in the fed as compared to fasted state in this group (Table 2).
3.4. Obesity-Prone Compared to Obesity-Resistant
Next, we turn our attention to how the responses differed between the OR and OP individuals. In the fasted state, while no group differences survived the stringent whole-brain cluster-level correction for multiple comparisons used in this study, OP individuals tended to have higher t values and greater spatial extent of response in a number of brain regions compared to OR (Table 1). One region, the left somatosensory cortex (x = −57, y = −19, z = 34), did survive a whole-brain correction, with t = 5.02, voxel-level family-wise error (FWE) correction of p = 0.03. Unlike in the OR group, the test meal did not attenuate the neuronal responses seen in the fasted state in OP individuals. As shown in Figure 3 and Table 3, the fed state resulted in significantly greater attenuation of insula, inferior PFC, and medial PFC response in OR as compared to OP individuals and significantly greater response in the medial and anterior PFC in OP as compared to OR individuals. Thus, the acutely fed state did not attenuate the neuronal responses to food cues in these brain regions in OP individuals and was associated with increased activation of medial and anterior PFC (i.e. a group by feeding state interaction). Figure 3 also shows neuronal responses for local maxima in the insula/PFC and medial PFC, in terms of BOLD % signal change, relative to the global mean. Because of the differences in fat mass between groups, we repeated the above analyses adjusting for fat mass. This had no impact on the results, suggesting that the differences seen are not a result of differences in fat mass.
Figure 3. Neuronal response in the fasted as compared to fed state in obesity-resistant (OR) as compared to obesity-prone (OP) individuals.
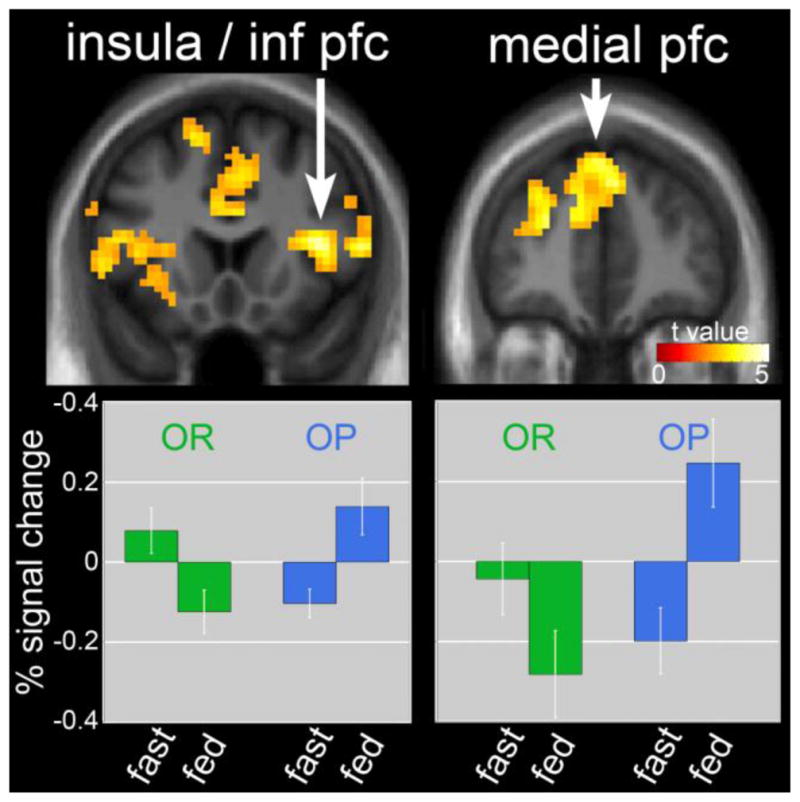
The difference in neuronal response in the fasted as compared to fed state in OR as compared to OP individuals when viewing foods of high hedonic value is shown. Greater deactivation of the insula, prefrontal cortex (PFC) and medial PFC seen in OR as compared to OP individuals is shown in upper panel. Lower panel shows reductions in both insula/inferior PFC and medial prefrontal cortex in the fed as compared to fasted state in OR. In OP, the opposite effect was observed, with increased responses in these regions in the fed as compared to the fasted state. Statistical maps thresholded at a voxel-wise threshold of p < 0.01 and a cluster-level false discovery rate (FDR) threshold of q < 0.05 and overlaid onto the group averaged anatomical image. Data are shown in the neurological convention (right hemisphere on the right). Mean BOLD responses (± SEM) are shown for the insula/PFC and medial PFC.
Table 3.
Differential response to visual food cues following a meal in obesity-resistant compared to obesity-prone Individuals.
| Brain Region | MNI Coordinatesa | T Valueb | Cluster sizec | ||
|---|---|---|---|---|---|
| x | y | z | |||
| Inferior prefrontal cortex/Insula (R) | 39 | 20 | 13 | 5.87 | 449 |
| Medial prefrontal cortex (L) | 6 | 41 | 37 | 4.39 | 1524 |
| Anterior prefrontal cortex (L) | −24 | 47 | 22 | 4.13 | |
| Inferior prefrontal cortex (L) | −45 | 14 | 16 | 3.91 | |
| Insula (L) | −33 | 8 | 1 | 3.61 | |
Stereotactic coordinates in MNI space.
T values reported for local maxima within clusters. All values in table significant at a voxel-wise threshold of p < 0.01 and a cluster-corrected FDR threshold of q < 0.05.
Responses in the insula, anterior and inferior prefrontal cortex were included in a larger cluster with a local maximum located in the medial prefrontal cortex.
3.5 Correlates of neuronal response
Across all subjects, a significant negative correlation was observed between hunger AUC and insula/inferior PFC (x = 39, y = 20, z = 13) response in the fasted as compared to the fed state (r = −0.42, t = 3.3, p < 0.001). In other words, the greater the attenuation of insula/inferior PFC in response to the meal, the greater the reduction in hunger was seen. Adjusting for fat mass did not significantly affect these results.
4. Discussion
The present study was performed to examine the neuronal response to food-related visual cues in response to an acute meal in individuals screened to be resistant to weight gain and obesity (OR) as compared to individuals screened to be prone to weight gain and obesity (OP). The primary results of this study demonstrate that the neuronal response to food cues seen in the fasted state is significantly attenuated in the acute fed state in OR but not OP individuals. OP individuals also show increased response in prefrontal cortical regions after the meal. These results suggest that the neuronal response to food cues is altered in individuals prone to weight gain and obesity as compared to those resistant to obesity. Furthermore, changes in hunger ratings appear to be associated with the neuronal response to a meal. These findings were not influenced by fat mass, suggesting that the differences may represent a core feature of the propensity to weight gain and obesity and are not simply a byproduct of increased body fat.
Supporting previous findings [25–28], viewing food cues when hungry in the current study led to neuronal response in a network of brain regions in OR individuals, including the insula, somatosensory cortex, and visual cortex. When participants viewed food cues following the administration of a liquid meal, this activity was significantly attenuated in OR individuals, as has been shown with acute feeding and short-term overfeeding [26–28]. The same down-regulation, however, was not observed in OP individuals, who not only failed to reduce activity in the insula/inferior prefrontal cortex (PFC) but actually showed increased response following the meal. Not only have similar results been reported in ‘already’ obese individuals (both in children and adults) who also show greater responses to visual food cues after eating as compared to normal weight individuals [7, 29, 30], but Stice et al also showed that normal weight adolescents who are “at risk” for obesity had greater striatal and somatosensory responses to milkshake receipt [31]. These, along with our findings, suggest that risk for weight gain and obesity is associated with increased or hyper-sensitivity to food related cues and may therefore be a potential cause as opposed to as a result of obesity.
The insula, specifically, is thought to be involved in the regulation of feeding behaviors [26, 32–34] and is involved in cognitive functions such as memories of past eating experiences and rewarding aspects of food, as well as containing primary taste cortex [26, 34–39]. Previous studies have shown abnormal insula reactivity to food cues in obese [10, 40–44] and reduced-obese [26, 42] individuals. The current study shows similar altered insula response to a meal in OP individuals, suggesting that this altered brain response precedes weight gain rather than being a result of increased weight. That the current findings are not correlated with measures of fat mass further supports this. Measures of hunger and prospective food consumption were negatively correlated with insula change in response to a meal, suggesting that less reduction in activation following a meal was related to feeling more hunger and desire to eat even when satiated. Furthermore, Mehta et al, found that insula response to visual food cues in the fed state predicted greater consumption of higher fat foods in a subsequent ad libitum buffet meal [45].
Inferior PFC is thought to be important for response inhibition [46–49]. The OP groups failure to down-regulate inferior PFC activation to food cues following a meal could indicate a need to suppress the prepotent response to food cues in a satiated state. Obese individuals are thought to have heightened responses to visual food cues compared to lean individuals [6, 11, 43, 50, 51] and it is likely that OP individuals show a similar sensitivity. Previous studies have shown increased activation in inferior PFC in response to high-calorie compared to low-calorie food cues in lean individuals [52], and it has been suggested that increased inferior PFC activation is related to placing higher value on food items [44, 53]. Increased inferior PFC activation has also been observed in response to taste stimulation in reduced-obese individuals, thought to reflect increased inhibitory restraint [54]. Furthermore, in lean individuals, inferior PFC was engaged during food-related tasks requiring successful self-control [55]. Thus, the current finding of abnormal inferior PFC responsivity after a meal in OP compared to OR individuals could reflect OP individuals placing higher value on food cues, necessitating the recruitment of additional inhibitory restraint when there is no homeostatic need to eat.
In addition to altered insula/inferior PFC activity, OP participants also demonstrated a post-meal increase in medial PFC activity not observed in OR participants. This finding is consistent with a previous fMRI study finding greater activation to visual food cues in medial PFC in obese compared to lean participants following a meal [7]. Increased post-meal medial PFC activation in obese compared to lean individuals has also been found using PET [40, 41]. That the current study found the same response in OP individuals suggests that increased medial PFC activity during satiation may precede weight gain. The medial PFC is thought to be involved during processing of internal conflict [56, 57] and self-referential processing [7, 56, 58–60]. Following feeding, individuals are aware that they have no homeostatic need to eat and as such, cravings induced by visual food cues may create a sense of conflict. In other words, the desire to eat when presented with hedonic visual food cues in a satiated state could produce internal conflict indexed by increased medial PFC activity. This corresponds with the abnormal inferior PFC regulation seen in the OP group following satiation, suggestive of increased response inhibition.
The PFC activity (medialand inferior PFC) seen in OP participants following feeding in the current study could also reflect increased inhibitory control. The PFC has projections to limbic areas involved in hunger and appetite [32, 61, 62] and response in the PFC is thought to inhibit limbic activity, thus reducing food intake and terminating the feeding period [36, 40, 41, 57, 62, 63]. It has been suggested that obese individuals have a decreased ability to inhibit food intake [64, 65] and have alterations in reward systems involved in food intake [43, 51, 64]. As such, OP individuals may need greater inhibitory control when faced with food cues in an attempt to avoid overeating [57]. Given this, the increased prefrontal activation seen in OP individuals could reflect an attempt at suppression of the desire to eat cued by visual food images during a state of satiation. That the decreased limbic response (i.e., insula) seen in OR participants was not seen in OP participants supports the idea that this additional inhibitory feedback may be necessary. Multiple areas of PFC are thought to be important in reward processing [11, 56, 66] and animal studies have suggested that the medial PFC is critical in controlling the impulse to eat in response to food cues [67]. Indeed, PET studies have found increases in medial PFC activity in both lean and obese participants immediately following feeding, although obese individuals show greater activation [40, 41]. This could reflect a reduced ability to adapt appropriately to a state of positive energy balance in OP individuals, as has been hypothesized in obese and reduced-obese individuals [26]. Future studies could further explore the timing of this activation/deactivation between OR and OP individuals using simultaneous EEG and fMRI recording.
A few limitations must also be discussed. While a strength of the study is that we chose to measure these outcomes in people who were not yet obese but were selected for a propensity to gain weight or remain thin, there are inherent problems with classifying individuals as being prone or resistant to obesity before its development. Nevertheless, we have previously shown that these groups as defined are associated with other physiologic differences [17–19]. Ultimately, though, it will be the longitudinal weight data which is currently being collected that will determine whether or not these categories are valid. Furthermore, because the OP individuals had higher BMI and fat mass than the OR individuals, it is possible that the group differences seen may be related to the greater fat mass and not the classification of obesity proneness. Because our secondary analysis, adjusting for fat mass, did not alter the findings and that previous studies have shown similar findings in obese and reduced-obese individuals, we would argue that these effects are likely not dependent on excess adiposity and therefore are potentially a marker of obesity risk.
In conclusion, the results of this study suggest that individuals who are at risk for weight gain (OP) have functional differences in brain regions known to be important in body weight regulation as compared to individuals who appear to be resistant to weight gain and obesity (OR). Specifically, the neuronal response to food cues seen in the fasted state was significantly attenuated in the acute fed state in OR as compared to OP individuals, and OP individuals showed increased activation in prefrontal cortical regions after the meal. These findings suggest that neuronal response to food cues in the acute fed state is altered in OP individuals in a manner that could potentially lead to excess energy intake and thus may be a core feature of weight gain and obesity risk.
Highlights.
Significant attenuation of neuronal response to food cues in fed state in OR.
Increased activation in prefrontal cortical regions after a meal in OP.
Changes in hunger ratings are associated with the neuronal response to a meal.
Acknowledgments
We acknowledge and thank Debra Singel and Yiping Du of the University of Colorado Brain Imaging Center for their assistance with the fMRI studies. We also thank the dietary services and metabolic kitchen of the University of Colorado Clinical Translational Research Center. This publication was supported by NIH/NCRR Colorado CTSI Grant Number UL1 TR000154, the Nutrition Obesity Research Center grant DK48520, and NIH/NIDDK Grant Numbers R01DK072174. Its contents are the authors’ sole responsibility and do not necessarily represent official NIH views.
Footnotes
Publisher's Disclaimer: This is a PDF file of an unedited manuscript that has been accepted for publication. As a service to our customers we are providing this early version of the manuscript. The manuscript will undergo copyediting, typesetting, and review of the resulting proof before it is published in its final citable form. Please note that during the production process errors may be discovered which could affect the content, and all legal disclaimers that apply to the journal pertain.
References
- 1.Flegal KM, Carroll MD, Kit BK, Ogden CL. Prevalence of Obesity and Trends in the Distribution of Body Mass Index Among US Adults, 1999–2010. JAMA: The Journal of the American Medical Association. 2012;307:491–7. doi: 10.1001/jama.2012.39. [DOI] [PubMed] [Google Scholar]
- 2.Hill JO, Wyatt HR, Melanson EL. Genetic and environmental contributions to obesity. Med Clin North Am. 2000;84:333–46. doi: 10.1016/s0025-7125(05)70224-8. [DOI] [PubMed] [Google Scholar]
- 3.Cornier MA, Grunwald GK, Johnson SL, Bessesen DH. Effects of short-term overfeeding on hunger, satiety, and energy intake in thin and reduced-obese individuals. Appetite. 2004;43:253–9. doi: 10.1016/j.appet.2004.06.003. [DOI] [PubMed] [Google Scholar]
- 4.Cornier MA, Salzberg AK, Endly DC, Bessesen DH, Rojas DC, Tregellas JR. The Effects of Overfeeding on the Neuronal Response to Visual Food Cues in Thin and Reduced-Obese Individuals. PLoS ONE. 2009;4:e6310. doi: 10.1371/journal.pone.0006310. [DOI] [PMC free article] [PubMed] [Google Scholar]
- 5.Zheng H, Lenard NR, Shin AC, Berthoud HR. Appetite control and energy balance regulation in the modern world: reward-driven brain overrides repletion signals. Int J Obes (Lond) 2009;33(Suppl 2):S8–13. doi: 10.1038/ijo.2009.65. [DOI] [PMC free article] [PubMed] [Google Scholar]
- 6.Carnell S, Gibson C, Benson L, Ochner CN, Geliebter A. Neuroimaging and obesity: current knowledge and future directions. Obes Rev. 2012;13:43–56. doi: 10.1111/j.1467-789X.2011.00927.x. [DOI] [PMC free article] [PubMed] [Google Scholar]
- 7.Martin LE, Holsen LM, Chambers RJ, Bruce AS, Brooks WM, Zarcone JR, et al. Neural mechanisms associated with food motivation in obese and healthy weight adults. Obesity (Silver Spring) 2010;18:254–60. doi: 10.1038/oby.2009.220. [DOI] [PubMed] [Google Scholar]
- 8.McCaffery JM, Haley AP, Sweet LH, Phelan S, Raynor HA, Del Parigi A, et al. Differential functional magnetic resonance imaging response to food pictures in successful weight-loss maintainers relative to normal-weight and obese controls. Am J Clin Nutr. 2009;90:928–34. doi: 10.3945/ajcn.2009.27924. [DOI] [PMC free article] [PubMed] [Google Scholar]
- 9.Rosenbaum M, Sy M, Pavlovich K, Leibel RL, Hirsch J. Leptin reverses weight loss-induced changes in regional neural activity responses to visual food stimuli. J Clin Invest. 2008;118:2583–91. doi: 10.1172/JCI35055. [DOI] [PMC free article] [PubMed] [Google Scholar]
- 10.Rothemund Y, Preuschhof C, Bohner G, Bauknecht HC, Klingebiel R, Flor H, et al. Differential activation of the dorsal striatum by high-calorie visual food stimuli in obese individuals. Neuroimage. 2007;37:410–21. doi: 10.1016/j.neuroimage.2007.05.008. [DOI] [PubMed] [Google Scholar]
- 11.Stoeckel LE, Weller RE, Cook EW, 3rd, Twieg DB, Knowlton RC, Cox JE. Widespread reward-system activation in obese women in response to pictures of high-calorie foods. Neuroimage. 2008;41:636–47. doi: 10.1016/j.neuroimage.2008.02.031. [DOI] [PubMed] [Google Scholar]
- 12.Pannacciulli N, Del Parigi A, Chen K, Le DS, Reiman EM, Tataranni PA. Brain abnormalities in human obesity: a voxel-based morphometric study. NeuroImage. 2006;31:1419–25. doi: 10.1016/j.neuroimage.2006.01.047. [DOI] [PubMed] [Google Scholar]
- 13.Pannacciulli N, Le DS, Chen K, Reiman EM, Krakoff J. Relationships between plasma leptin concentrations and human brain structure: a voxel-based morphometric study. Neuroscience letters. 2007;412:248–53. doi: 10.1016/j.neulet.2006.11.019. [DOI] [PMC free article] [PubMed] [Google Scholar]
- 14.Kurth F, Levitt JG, Phillips OR, Luders E, Woods RP, Mazziotta JC, et al. Relationships between gray matter, body mass index, and waist circumference in healthy adults. Hum Brain Mapp. 2012 doi: 10.1002/hbm.22021. [DOI] [PMC free article] [PubMed] [Google Scholar]
- 15.Yokum S, Ng J, Stice E. Relation of regional gray and white matter volumes to current BMI and future increases in BMI: a prospective MRI study. Int J Obes. 2012;36:656–64. doi: 10.1038/ijo.2011.175. [DOI] [PMC free article] [PubMed] [Google Scholar]
- 16.Maayan L, Hoogendoorn C, Sweat V, Convit A. Disinhibited Eating in Obese Adolescents Is Associated With Orbitofrontal Volume Reductions and Executive Dysfunction. Obesity. 2011;19:1382–7. doi: 10.1038/oby.2011.15. [DOI] [PMC free article] [PubMed] [Google Scholar]
- 17.Smucny J, Cornier MA, Eichman LC, Thomas EA, Bechtell JL, Tregellas JR. Brain structure predicts risk for obesity. Appetite. 2012;59:859–65. doi: 10.1016/j.appet.2012.08.027. [DOI] [PMC free article] [PubMed] [Google Scholar]
- 18.Schmidt SL, Harmon KA, Sharp TA, Kealey EH, Bessesen DH. The Effects of Overfeeding on Spontaneous Physical Activity in Obesity Prone and Obesity Resistant Humans. Obesity. 2012;20:2186–93. doi: 10.1038/oby.2012.103. [DOI] [PMC free article] [PubMed] [Google Scholar]
- 19.Schmidt SL, Kealey EH, Horton TJ, Vonkaenel S, Bessesen DH. The effects of short-term overfeeding on energy expenditure and nutrient oxidation in obesity-prone and obesity-resistant individuals. Int J Obes (Lond) 2012 doi: 10.1038/ijo.2012.202. [DOI] [PMC free article] [PubMed] [Google Scholar]
- 20.Garner DM, Olmsted MP, Bohr Y, Garfinkel PE. The eating attitudes test: psychometric features and clinical correlates. Psychological medicine. 1982;12:871–8. doi: 10.1017/s0033291700049163. [DOI] [PubMed] [Google Scholar]
- 21.Radloff LS. The CES-D scale: a self-report depression scale for research in the general population. Applied Psychological Measurement. 1977;1:385–401. [Google Scholar]
- 22.Grunwald GK, Melanson EL, Forster JE, Seagle HM, Sharp TA, Hill JO. Comparison of methods for achieving 24-hour energy balance in a whole-room indirect calorimeter. Obes Res. 2003;11:752–9. doi: 10.1038/oby.2003.105. [DOI] [PubMed] [Google Scholar]
- 23.Burger KS, Cornier MA, Ingebrigtsen J, Johnson SL. Assessing food appeal and desire to eat: the effects of portion size & energy density. Int J Behav Nutr Phys Act. 2011;8:101. doi: 10.1186/1479-5868-8-101. [DOI] [PMC free article] [PubMed] [Google Scholar]
- 24.Cornier MA, Von Kaenel SS, Bessesen DH, Tregellas JR. Effects of overfeeding on the neuronal response to visual food cues. Am J Clin Nutr. 2007;86:965–71. doi: 10.1093/ajcn/86.4.965. [DOI] [PubMed] [Google Scholar]
- 25.Fuhrer D, Zysset S, Stumvoll M. Brain activity in hunger and satiety: an exploratory visually stimulated FMRI study. Obesity (Silver Spring) 2008;16:945–50. doi: 10.1038/oby.2008.33. [DOI] [PubMed] [Google Scholar]
- 26.Cornier MA, Salzberg AK, Endly DC, Bessesen DH, Rojas DC, Tregellas JR. The effects of overfeeding on the neuronal response to visual food cues in thin and reduced-obese individuals. PLoS One. 2009;4:e6310. doi: 10.1371/journal.pone.0006310. [DOI] [PMC free article] [PubMed] [Google Scholar]
- 27.van der Laan LN, de Ridder DT, Viergever MA, Smeets PA. The first taste is always with the eyes: a meta-analysis on the neural correlates of processing visual food cues. Neuroimage. 2011;55:296–303. doi: 10.1016/j.neuroimage.2010.11.055. [DOI] [PubMed] [Google Scholar]
- 28.Goldstone AP, Prechtl de Hernandez CG, Beaver JD, Muhammed K, Croese C, Bell G, et al. Fasting biases brain reward systems towards high-calorie foods. European Journal of Neuroscience. 2009;30:1625–35. doi: 10.1111/j.1460-9568.2009.06949.x. [DOI] [PubMed] [Google Scholar]
- 29.Dimitropoulos A, Tkach J, Ho A, Kennedy J. Greater corticolimbic activation to high-calorie food cues after eating in obese vs. normal-weight adults. Appetite. 2012;58:303–12. doi: 10.1016/j.appet.2011.10.014. [DOI] [PMC free article] [PubMed] [Google Scholar]
- 30.Bruce AS, Holsen LM, Chambers RJ, Martin LE, Brooks WM, Zarcone JR, et al. Obese children show hyperactivation to food pictures in brain networks linked to motivation, reward and cognitive control. Int J Obes. 2010;34:1494–500. doi: 10.1038/ijo.2010.84. [DOI] [PMC free article] [PubMed] [Google Scholar]
- 31.Stice E, Yokum S, Burger KS, Epstein LH, Small DM. Youth at Risk for Obesity Show Greater Activation of Striatal and Somatosensory Regions to Food. The Journal of Neuroscience. 2011;31:4360–6. doi: 10.1523/JNEUROSCI.6604-10.2011. [DOI] [PMC free article] [PubMed] [Google Scholar]
- 32.Gordon CM, Dougherty DD, Rauch SL, Emans SJ, Grace E, Lamm R, et al. Neuroanatomy of human appetitive function: A positron emission tomography investigation. Int J Eat Disord. 2000;27:163–71. doi: 10.1002/(sici)1098-108x(200003)27:2<163::aid-eat4>3.0.co;2-y. [DOI] [PubMed] [Google Scholar]
- 33.Hinton EC, Parkinson JA, Holland AJ, Arana FS, Roberts AC, Owen AM. Neural contributions to the motivational control of appetite in humans. Eur J Neurosci. 2004;20:1411–8. doi: 10.1111/j.1460-9568.2004.03589.x. [DOI] [PubMed] [Google Scholar]
- 34.Pelchat ML, Johnson A, Chan R, Valdez J, Ragland JD. Images of desire: food-craving activation during fMRI. NeuroImage. 2004;23:1486–93. doi: 10.1016/j.neuroimage.2004.08.023. [DOI] [PubMed] [Google Scholar]
- 35.Levy LM, Henkin RI, Lin CS, Finley A, Schellinger D. Taste memory induces brain activation as revealed by functional MRI. J Comput Assist Tomogr. 1999;23:499–505. doi: 10.1097/00004728-199907000-00002. [DOI] [PubMed] [Google Scholar]
- 36.Tataranni PA, Gautier JF, Chen K, Uecker A, Bandy D, Salbe AD, et al. Neuroanatomical correlates of hunger and satiation in humans using positron emission tomography. Proc Natl Acad Sci U S A. 1999;96:4569–74. doi: 10.1073/pnas.96.8.4569. [DOI] [PMC free article] [PubMed] [Google Scholar]
- 37.DelParigi A, Chen K, Salbe AD, Reiman EM, Tataranni PA. Sensory experience of food and obesity: a positron emission tomography study of the brain regions affected by tasting a liquid meal after a prolonged fast. Neuroimage. 2005;24:436–43. doi: 10.1016/j.neuroimage.2004.08.035. [DOI] [PubMed] [Google Scholar]
- 38.Smeets PA, de Graaf C, Stafleu A, van Osch MJ, Nievelstein RA, van der Grond J. Effect of satiety on brain activation during chocolate tasting in men and women. Am J Clin Nutr. 2006;83:1297–305. doi: 10.1093/ajcn/83.6.1297. [DOI] [PubMed] [Google Scholar]
- 39.Cornier MA, Melanson EL, Salzberg AK, Bechtell JL, Tregellas JR. The effects of exercise on the neuronal response to food cues. Physiol Behav. 2012;105:1028–34. doi: 10.1016/j.physbeh.2011.11.023. [DOI] [PMC free article] [PubMed] [Google Scholar]
- 40.Gautier JF, Chen K, Salbe AD, Bandy D, Pratley RE, Heiman M, et al. Differential brain responses to satiation in obese and lean men. Diabetes. 2000;49:838–46. doi: 10.2337/diabetes.49.5.838. [DOI] [PubMed] [Google Scholar]
- 41.Gautier JF, Del Parigi A, Chen K, Salbe AD, Bandy D, Pratley RE, et al. Effect of satiation on brain activity in obese and lean women. Obes Res. 2001;9:676–84. doi: 10.1038/oby.2001.92. [DOI] [PubMed] [Google Scholar]
- 42.DelParigi A, Chen K, Salbe AD, Hill JO, Wing RR, Reiman EM, et al. Persistence of abnormal neural responses to a meal in postobese individuals. Int J Obes Relat Metab Disord. 2004;28:370–7. doi: 10.1038/sj.ijo.0802558. [DOI] [PubMed] [Google Scholar]
- 43.Stice E, Yokum S, Burger KS, Epstein LH, Small DM. Youth at risk for obesity show greater activation of striatal and somatosensory regions to food. J Neurosci. 2011;31:4360–6. doi: 10.1523/JNEUROSCI.6604-10.2011. [DOI] [PMC free article] [PubMed] [Google Scholar]
- 44.Murdaugh DL, Cox JE, Cook EW, 3rd, Weller RE. fMRI reactivity to high-calorie food pictures predicts short-long-term outcome in a weight-loss program. Neuroimage. 2012;59:2709–21. doi: 10.1016/j.neuroimage.2011.10.071. [DOI] [PMC free article] [PubMed] [Google Scholar]
- 45.Mehta S, Melhorn SJ, Smeraglio A, Tyagi V, Grabowski T, Schwartz MW, et al. Regional brain response to visual food cues is a marker of satiety that predicts food choice. The American Journal of Clinical Nutrition. 2012;96:989–99. doi: 10.3945/ajcn.112.042341. [DOI] [PMC free article] [PubMed] [Google Scholar]
- 46.Konishi S, Nakajima K, Uchida I, Sekihara K, Miyashita Y. No-go dominant brain activity in human inferior prefrontal cortex revealed by functional magnetic resonance imaging. Eur J Neurosci. 1998;10:1209–13. doi: 10.1046/j.1460-9568.1998.00167.x. [DOI] [PubMed] [Google Scholar]
- 47.Menon V, Adleman NE, White CD, Glover GH, Reiss AL. Error-related brain activation during a Go/NoGo response inhibition task. Hum Brain Mapp. 2001;12:131–43. doi: 10.1002/1097-0193(200103)12:3<131::AID-HBM1010>3.0.CO;2-C. [DOI] [PMC free article] [PubMed] [Google Scholar]
- 48.Swick D, Ashley V, Turken AU. Left inferior frontal gyrus is critical for response inhibition. BMC Neurosci. 2008;9:102. doi: 10.1186/1471-2202-9-102. [DOI] [PMC free article] [PubMed] [Google Scholar]
- 49.Hampshire A, Chamberlain SR, Monti MM, Duncan J, Owen AM. The role of the right inferior frontal gyrus: inhibition and attentional control. Neuroimage. 2010;50:1313–9. doi: 10.1016/j.neuroimage.2009.12.109. [DOI] [PMC free article] [PubMed] [Google Scholar]
- 50.McCaffery JM, Haley AP, Sweet LH, Phelan S, Raynor HA, Del Parigi A, et al. Differential functional magnetic resonance imaging response to food pictures in successful weight-loss maintainers relative to normal-weight and obese controls. Am J Clin Nutr. 2009;90:928–34. doi: 10.3945/ajcn.2009.27924. [DOI] [PMC free article] [PubMed] [Google Scholar]
- 51.Cornier MA. Is your brain to blame for weight regain? Physiol Behav. 2011;104:608–12. doi: 10.1016/j.physbeh.2011.04.003. [DOI] [PMC free article] [PubMed] [Google Scholar]
- 52.Schur EA, Kleinhans NM, Goldberg J, Buchwald D, Schwartz MW, Maravilla K. Activation in brain energy regulation and reward centers by food cues varies with choice of visual stimulus. Int J Obes (Lond) 2009;33:653–61. doi: 10.1038/ijo.2009.56. [DOI] [PMC free article] [PubMed] [Google Scholar]
- 53.Hare TA, O’Doherty J, Camerer CF, Schultz W, Rangel A. Dissociating the role of the orbitofrontal cortex and the striatum in the computation of goal values and prediction errors. J Neurosci. 2008;28:5623–30. doi: 10.1523/JNEUROSCI.1309-08.2008. [DOI] [PMC free article] [PubMed] [Google Scholar]
- 54.Sweet LH, Hassenstab JJ, McCaffery JM, Raynor HA, Bond DS, Demos KE, et al. Brain response to food stimulation in obese, normal weight, and successful weight loss maintainers. Obesity (Silver Spring) 2012 doi: 10.1038/oby.2012.125. [DOI] [PMC free article] [PubMed] [Google Scholar]
- 55.Hare TA, Camerer CF, Rangel A. Self-control in decision-making involves modulation of the vmPFC valuation system. Science. 2009;324:646–8. doi: 10.1126/science.1168450. [DOI] [PubMed] [Google Scholar]
- 56.Amodio DM, Frith CD. Meeting of minds: the medial frontal cortex and social cognition. Nat Rev Neurosci. 2006;7:268–77. doi: 10.1038/nrn1884. [DOI] [PubMed] [Google Scholar]
- 57.Davids S, Lauffer H, Thoms K, Jagdhuhn M, Hirschfeld H, Domin M, et al. Increased dorsolateral prefrontal cortex activation in obese children during observation of food stimuli. Int J Obes (Lond) 2010;34:94–104. doi: 10.1038/ijo.2009.193. [DOI] [PubMed] [Google Scholar]
- 58.Fossati P, Hevenor SJ, Graham SJ, Grady C, Keightley ML, Craik F, et al. In search of the emotional self: an fMRI study using positive and negative emotional words. Am J Psychiatry. 2003;160:1938–45. doi: 10.1176/appi.ajp.160.11.1938. [DOI] [PubMed] [Google Scholar]
- 59.Macrae CN, Moran JM, Heatherton TF, Banfield JF, Kelley WM. Medial prefrontal activity predicts memory for self. Cereb Cortex. 2004;14:647–54. doi: 10.1093/cercor/bhh025. [DOI] [PubMed] [Google Scholar]
- 60.Northoff G, Heinzel A, de Greck M, Bermpohl F, Dobrowolny H, Panksepp J. Self-referential processing in our brain--a meta-analysis of imaging studies on the self. Neuroimage. 2006;31:440–57. doi: 10.1016/j.neuroimage.2005.12.002. [DOI] [PubMed] [Google Scholar]
- 61.Miller EK, Cohen JD. An integrative theory of prefrontal cortex function. Annu Rev Neurosci. 2001;24:167–202. doi: 10.1146/annurev.neuro.24.1.167. [DOI] [PubMed] [Google Scholar]
- 62.Del Parigi A, Gautier JF, Chen K, Salbe AD, Ravussin E, Reiman E, et al. Neuroimaging and obesity: mapping the brain responses to hunger and satiation in humans using positron emission tomography. Ann N Y Acad Sci. 2002;967:389–97. [PubMed] [Google Scholar]
- 63.Holsen LM, Zarcone JR, Brooks WM, Butler MG, Thompson TI, Ahluwalia JS, et al. Neural mechanisms underlying hyperphagia in Prader-Willi syndrome. Obesity (Silver Spring) 2006;14:1028–37. doi: 10.1038/oby.2006.118. [DOI] [PMC free article] [PubMed] [Google Scholar]
- 64.Goldstone AP, Prechtl de Hernandez CG, Beaver JD, Muhammed K, Croese C, Bell G, et al. Fasting biases brain reward systems towards high-calorie foods. Eur J Neurosci. 2009;30:1625–35. doi: 10.1111/j.1460-9568.2009.06949.x. [DOI] [PubMed] [Google Scholar]
- 65.Myslobodsky M. Gourmand savants and environmental determinants of obesity. Obes Rev. 2003;4:121–8. doi: 10.1046/j.1467-789x.2003.00098.x. [DOI] [PubMed] [Google Scholar]
- 66.Rushworth MF, Noonan MP, Boorman ED, Walton ME, Behrens TE. Frontal cortex and reward-guided learning and decision-making. Neuron. 2011;70:1054–69. doi: 10.1016/j.neuron.2011.05.014. [DOI] [PubMed] [Google Scholar]
- 67.Petrovich GD, Ross CA, Holland PC, Gallagher M. Medial prefrontal cortex is necessary for an appetitive contextual conditioned stimulus to promote eating in sated rats. J Neurosci. 2007;27:6436–41. doi: 10.1523/JNEUROSCI.5001-06.2007. [DOI] [PMC free article] [PubMed] [Google Scholar]