

Abstract
This paper presents a computational modeling study of the effects of the collagen fiber structure on the mechanical response of the sclera and the adjacent optic nerve head (ONH). A specimen-specific inverse finite element method was developed to determine the material properties of two human sclera subjected to full-field inflation experiments. A distributed fiber model was applied to describe the anisotropic elastic behavior of the sclera. The model directly incorporated wide angle x-ray scattering measurements of the anisotropic collagen structure. The converged solution of the inverse method was used in micromechanical studies of the mechanical anisotropy of the sclera at different scales. The effects of the scleral collagen fiber structure on the ONH deformation were evaluated by progressively filtering out local anisotropic features. It was found that the majority of the midposterior sclera could be described as isotropic without significantly affecting the mechanical response of the tissues of the ONH. In contrast, removing local anisotropic features in the peripapillary sclera produced significant changes in scleral canal expansion, and lamina cribrosa deformation. Local variations in the collagen structure of the peripapillary sclera significantly influenced the mechanical response of the ONH.
Keywords: Sclera, Optic nerve head, Inverse finite element method, Wide angle x-ray scattering, Inflation experiment
1 Introduction
The sclera is the white, collagen-rich outer layer and principal load-bearing tissue of the eye. An important feature of the posterior sclera is the optic nerve head (ONH), where the axons of the retinal ganglion cells (RGC) exit the eye through a perforated connective tissue called the lamina cribrosa (LC). A comprehensive understanding of the mechanical environment of the LC and the surrounding peripapillary sclera is of special clinical interest. It is hypothesized that in glaucoma, excessive deformation of the LC induced by intraocular pressure (IOP) leads to irreversible loss of RGC and vision (Morrison et al., 2005; Ethier, 2006; Burgoyne et al., 2009). Direct measurements of the mechanical behavior of the LC is challenging because of its small size and complex anatomy. Alternatively, many experimental techniques are available to evaluate the mechanical response of the posterior sclera, and scleral stiffness has been showed to be an important factor in determining how the adjacent LC and tissues of the ONH respond to change in IOP (Sigal et al., 2005). The mechanical properties of the sclera stem from its fiber-reinforced microstructure, which consists of a stack of collagen lamellae, composed mainly of unidirectional type I collagen fibers embedded in a proteoglycan-rich matrix (Watson and Young, 2004). The collagen fiber structure of the posterior human sclera was recently investigated using wide-angle X-ray scattering (WAXS) (Pijanka et al., 2012). In WAXS, X-rays passing through the ordered fibrous collagen structure are scattered to produce a diffraction pattern. In this study, the diffraction patterns, which were collected at 0.5 mm (horizontal) × 0.5 mm (vertical) intervals, sampled the entire thickness of the tissue to provide a thickness-averaged measurement of the orientation distribution of the collagen lamellae. It was found that the collagen lamellae were strongly aligned circumferentially in the peripapillary sclera, which is the region closest to the ONH. In contrast, no clear long-range fiber orientations were measured in the midposterior region, outside the peripapillary sclera. The relative number of fibers preferentially aligned in the local fiber direction at a point in the tissue was also significantly lower in the midposterior sclera than in the peripapillary sclera. Modeling studies have shown that the circumferential fiber reinforcement limits the radial expansion of the LC and therefore the in-plane tensile strains (Grytz and Mesch, 2010), which may protect the tissues of the ONH. However, little is known about how the midposterior sclera fiber structure influences the mechanical response of the ONH.
We recently developed an inflation test which used stereoscopic digital image correlation (DIC) to provide full-field measurements of the scleral surface displacements (Myers et al., 2010; Coudrillier et al., 2012) and calculated the surface strains in the circumferential and meridional directions. The study included 33 sclera without previous history of glaucoma. In the peripapillary sclera, the average meridional strain was 73 % larger than the average circumferential strain. This provided experimental evidence that the circumferential alignment of collagen fibers reduced the radial expansion of the LC. In the midposterior sclera, the inflation response was significantly less anisotropic. There, the average meridional strain was only 37 % larger than the average circumferential strain. Eilaghi et al. (2010) reported negligible differences in the stress-strain response of the two in-plane directions measured by biaxial strip tests of specimens dissected from the midposterior sclera. This result suggested that the tissues of the midposterior sclera were isotropic.
This study aimed to investigate the effects of the collagen fiber structure on the mechanical response of the sclera and the ONH. Two specimen-specific finite element models of the posterior sclera were constructed from the DIC-measured geometry of the inflated specimen. A distributed fiber model was developed to describe the anisotropic elastic response of the sclera. Distributed fiber models have been applied previously to ocular tissues, such as the sclera (Girard et al., 2009b; Grytz and Mesch, 2010) and the cornea (Pinsky et al., 2005; Nguyen et al., 2008; Nguyen and Boyce, 2011). In this framework, the fiber structure is locally represented by a probability density function, which describes the distribution of fiber orientations about a preferred orientation. In the present study, the fiber structure was assigned at the element level directly from the specimen-specific WAXS measurements of the collagen orientation distribution. The remaining parameters of the models were determined using inverse finite element analysis (IFEA), which minimized the difference between the computed and DIC-measured displacement fields averaged over the specimen surface and loading history. IFEA has been applied previously to determine the material parameters of the bovine cornea (Nguyen and Boyce, 2011) and the monkey sclera (Girard et al., 2009b) from inflation tests. The proposed method improves on the most recent scleral biomechanical modeling efforts in that it includes the regional maps of the preferred fiber orientation and the degree of anisotropy determined by WAXS experiments performed on the prior-inflated sclera.
Using the material parameters calculated from the IFEA, we first evaluated the effects of the collagen fiber structure on the mechanical response of the sclera. We hypothesized that long range variations in the collagen structure produced a progressively more isotropic behavior at increasing length scales. The sclera is clearly anisotropic at the length scale of a single WAXS measurement, regardless of the location on the tissue. The experimentally observed low anisotropy in the midposterior sclera likely arises from the heterogeneity of the fiber structure. In the sclera, the heterogeneity results from large variations in the preferred fiber orientation and degree of fiber alignment. To evaluate the anisotropic response of the sclera at different length scales, we constructed micromechanical models of scleral strips of 0.5 mm, 2 mm and 4.5 mm in length. We simulated equibiaxial tests and calculated the level of mechanical anisotropy at each length scale.
We next evaluated the effects of the sclera collagen structure on the deformation response of the ONH to IOP elevation. The deformation in the ONH is determined by the mechanical properties of the ONH and scleral tissues. This study focused on the anisotropic scleral tissues and systematically asked how the anisotropy and heterogenity of the collagen structure in the peripapillary and midposterior sclera influence the inflation response of the ONH. Starting from the most detailed description of the collagen structure available from the WAXS experiments, we progressively filtered out the less anisotropic features of the sclera. The effects on the scleral canal expansion, LC posterior deformation, and LC principal strains were evaluated. It was shown that most of the midposterior sclera could be modeled as isotropic before producing noticeable changes in the deformation response of the ONH. However, the deformation response of the ONH was sensitive to local changes in the anisotropy of the peripapillary region.
2 Method
2.1 Experimental method
The experimental method was described in recent publications (Coudrillier et al., 2012; Myers et al., 2010). Briefly, human donor eyes were obtained from the National Disease Research Interchange within 24 hours post-mortem and tested within 72 hours post-mortem. Before testing, the sclera were stored in balanced saline solution at 4 °C. Previous studies on the bovine (Myers et al., 2010) and the rabbit (Girard et al., 2007) sclera showed negligible signs of tissue degradation in the mechanical behavior of the tissues over the 72 hour period. The scleral specimens were excised 3 mm posterior to the equator and mounted on a customized inflation chamber (Fig. 1a). The samples were subjected to a series of controlled pressurization load-unload tests. Two cameras imaged the speckled surface of the sclera during inflation. Surface displacements were calculated using 3D digital image correlation (DIC) at 130 μm spaced points on a cartesian grid (Vic3D, Correlated Solutions, Inc, Columbia, SC). A 0.5 mm2 region corresponding to a WAXS measurement contained between 12 and 16 displacement data points. Thickness of the mounted specimens was measured at 8 locations in the peripapillary sclera and 8 locations in the midposterior sclera using an ultrasonic pachymeter (Fig. 1b).
Fig. 1.
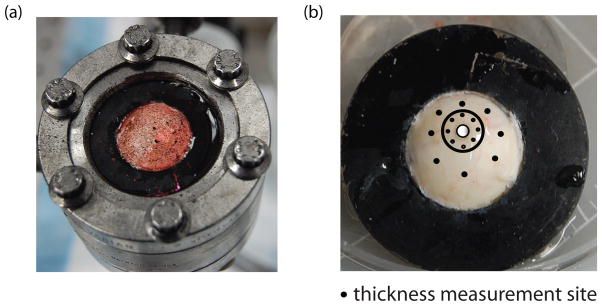
(a) The specimen mounted on the inflation chamber. It was speckled with graphite powder for digital imaging correlation. (b) Posterior sclera glued on the holder 3 mm posterior to the equator. Black dots located on a circle of radius 2 centered at the ONH and at mid-distance between the ONH and the holder represent the location of thickness measurements. The location of the ONH is highlighted in white. The black circle locates the boundary between the peripapillary and midposterior region.
The DIC algorithm reconstructed the vertical positions (Z) of the undeformed surface and the three displacement components (ux, uy, uz) for a 2D cartesian grid parametrized by in plane positions (X,Y) (Fig. 2a). 3To define the circumferential and meridional directions, we created a 2D polar grid centered on the ONH with equally 0.1 mm spaced points in the radial direction and 0.5 ° spaced points in the circumferential direction (Fig. 2b). The vertical Z-position and displacement components were interpolated from the native cartesian grid to the polar grid using the MatLab function TriScatterInterp (Matlab R2010b, Mathwork, Natick, MA). The vertical position was used to transform the 2D polar grid into a 3D grid. The deformed position of the 3D grid was calculated from the interpolated values as (X + ux,Y + uy, Z + uz). The vector connecting two points of the 3D grid corresponding to two radially adjacent points on the polar grid was defined as Lϕ eϕ, where eϕ is the unit vector in the meridional direction. In the deformed configuration, the magnitude of this vector was lϕ. Similarly, the vector connecting two points of the 3D grid corresponding to two adjacent points in the circumferential direction was defined as Lθ eθ, where eθ is the unit vector in the circumferential direction. In the deformed configuration, the magnitude of this vector was lθ. Figure 2c illustrates the projections of Lθ, Lϕ, lθ, and lϕ on the 2D polar grid. The stretches in the circumferential and meridional directions were defined as the ratio of the deformed length over the undeformed length, λθ = lθ/Lθ and λϕ = lϕ/Lϕ. The Lagrangian strains were calculated from the stretches as:
| (1) |
Fig. 2.
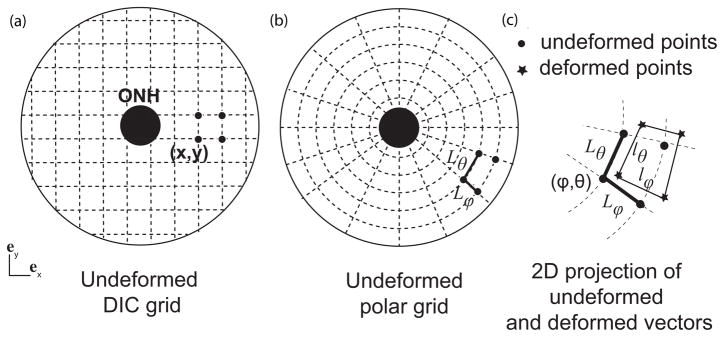
(a) 2D projection of the cartesian grid of points of the undeformed surface, which was transformed into a 2D polar grid with points aligned in the meridional and circumferential directions (b). The distance between two adjacent points of the undeformed scleral surface in eϕ is Lϕ. (c) Zoom-in on the deformed grid. The deformed distance between the same points in the deformed configuration is lϕ. The meridional stretch is calculated as λϕ = lϕ/Lϕ. For clarity, the grid is represented with a lower density of points.
2.2 Anisotropic hyperelastic constitutive model
Within the distributed fiber model framework, the sclera is described as a continuum mixture of fiber families representing the collagen lamellae in an incompressible isotropic matrix. We assumed the matrix contained all the non-fibrillar collagen components, including proteoglycans, elastin fibers, water, and non fiber-forming collagen. Furthermore, the matrix and collagen fibers deform with the tissue according to the macroscopic deformation gradient F, which maps a vector from the undeformed configuration to the deformed configuration. The collagen fibers oriented in the Φ-direction measured from the nasal-temporal meridian of the scleral plane were described with the unit vector N = [cos(Φ),sin(Φ)]. The fiber stretch was calculated as , where C = FTF is the right Cauchy Green tensor.
These assumptions allowed the strain energy of the sclera to be decomposed into a matrix term dependent on the first three invariants of C and an anisotropic term dependent on the fiber stretch:
| (2) |
where I1 = tr(C), , and I3 = (det(C) are the invariants of C. This decomposition of the strain energy density has been commonly used to describe the cornea (Nguyen and Boyce, 2011; Pinsky et al., 2005) and the sclera (Girard et al., 2009a; Grytz and Mesch, 2010). We assumed that the collagen fibers were identical and could be described using the same strain energy density (Pinsky et al., 2005):
| (3) |
where 4αβ denotes the stiffness of the fiber family and β is a strain stiffening parameter. The anisotropic component of the strain energy density was formulated as the orientation average of the fiber strain energy density weighted by the probability density function D(Φ) for the fiber orientation:
| (4) |
The normalized X-ray scatter intensity from the WAXS measurements was used to locally define the probability density function D(Φ), without additional smoothing. This contrasts with recent studies (Pinsky et al., 2005; Girard et al., 2009a), where the probably density function was fit to an analytical function, e.g., a von Mises distribution function. Our approach was motivated by the poor quality of the fit to a von Mises distribution in the mid-posterior sclera. This model was implemented in a finite element code (Tahoe©1), where the integral formulation for the stress response was numerically evaluated using a 128-point trapezoidal rule.
The matrix phase was modeled as an isotropic, quasi-incompressible Neo-Hookean material:
| (5) |
where μ is the shear modulus, κ = 10 MPa is the bulk modulus, and is the distortional part of I1. The value of κ was sufficiently large to enforce incompressibility.
The advantage of this model is that it uses only 3 parameters (μ,α,β), that represent the matrix and fiber response over the entire sclera, and the experimentally determined collagen fiber structure to describe the mechanical response of the sclera. It also attributes the spatial variations in material properties of the sclera to the spatial variations in the fiber structure.
2.3 Finite element model
Two sets of finite element (FE) models were created using the DIC-measured positions of the outer surface and experimentally measured thickness. The first was a specimen-specific model of the midposterior region of the sclera, and did not include the ONH and peri-papillary regions. This model was used for parameter determination by IFEA. The second combined a generic description for the peripapillary and ONH regions with the specimen-specific model of the midposterior region, and was used to study the effects of the heterogeneous anisotropic collagen fiber structure on the inflation response of the ONH. To create the thickness profile of the scleral cup, we assumed that the thickness of the LC was 400 μm, based on the thickness measurements of Jonas and Holbach (2005) averaged over 111 Caucasian subjects. The eight thickness measurements of the peripapillary sclera were approximately located at r = 2rLC, where rLC = 0.85 mm is the radius of the LC and r the radial distance to the ONH center. The eight thickness measurements in the midposterior sclera were approximately located at the mid-distance between the ONH center and the holder. The thickness was linearly interpolated to 30 equally spaced points in the circumferential direction on the periphery of the LC and the two locations of thickness measurements. The results were used to linearly interpolate the thickness to points spaced every 0.1 mm in the radial direction.
2.3.1 The midposterior sclera
To create a specimen-specific model of the midposterior sclera, the DIC-measured positions (X,Y,Z) of the undeformed specimen surface were smoothed using the Matlab function Gridfit2. The surface nodes of the FE mesh were generated from the smoothed surface. The point-wise error between the location of the nodes and the smoothed DIC surface did not exceed 3%. The nodes of the inner surface were created from the specimen-specific thickness profile values by extending an inward normal vector from nodal points on the outer surface. The geometry was discretized using mixed Q1P0 trilinear hexahedral elements, with three elements spanning the thickness. The total number of nodes was controlled by changing the circumferential and meridional node density. The mesh used for IFEA was coarsely discretized by 35 nodes in the meridional direction and 28 nodes in the circumferential direction (Fig. 3). The probability density function for the fiber orientation was assigned at the element level. The elements of the outer region were usually larger than the 0.5 mm WAXS measurement interval and could contain up to four WAXS measurements. The scatter intensities of all WAXS measurements within an element were summed and normalized over 2π to define the probability density function. The result approximated the distribution that would have been measured by a larger X-ray beam. The preferred fiber orientation vector was defined for a 2D projection of the scleral surface from the angle corresponding to the maximum WAXS intensity. This was rotated to define a 3D fiber vector in the element plane perpendicular to the element normal.
Fig. 3.

Top view of the finite element mesh of the midposterior sclera, showing the surface nodes at which DIC-measured displacements are applied as kinematic boundary conditions. The same displacement boundary conditions were applied to the all four nodes spanning the thickness. The ONH is represented in the center. The circle (dashed line) represents the position of the most peripheral pixels detected by the DIC software. N stands for nasal, S for superior, T for temporal and I for inferior.
Different imaging techniques have provided some details about the geometry of the sclera in the region closest to the ONH canal (Norman et al., 2010; Jonas et al., 2003; Jonas and Holbach, 2005; Ren et al., 2009; Vurgese et al., 2012). These studies showed that the peripapillary sclera thins significantly towards the ONH. The ultrasonic pachymeter probe had a 1.0 mm radius, which was comparable to the radius of the LC. Consequently, we were unable to use the pachymeter to map the thickness of the peripapillary region. Uncertainties in the geometrical model of the peripapillary sclera and ONH would propagate to the parameters determination; thus these regions were not included in model used for IFEA. The inner boundary of the model for the midposterior sclera was defined by r = 3rLC, while the outer boundary was defined by the outermost positions of the WAXS measurements (Fig. 3). The DIC-measured displacements at the inner and outer boundaries were applied as kinematic boundary conditions. The DIC-measured displacements of the surface nodes were applied to all nodes spanning the thickness. Traction corresponding to the experimental pressure was applied to the internal surface.
2.3.2 The posterior scleral cup
The model for the posterior scleral cup attached a generic model for the peripapillary sclera and ONH with the specimen-specific model of the midposterior sclera described in the previous section (Fig. 4). We developed the finite element geometry of the ONH and peripapillary sclera based on the thickness measurements of Vurgese et al. (2012) and Ren et al. (2009). Both studies reported that the thinning of the peripapillary sclera occurs over a distance approximately equal to the LC radius. The thinning of the peripapillary sclera was included in the model (Fig. 4). Quigley et al. (1990) showed that the shape of the LC varied significantly between individuals. On average, the LC periphery was close to circular with a mean vertical diameter of 1.88 mm and a mean horizontal diameter of 1.77 mm.
Fig. 4.
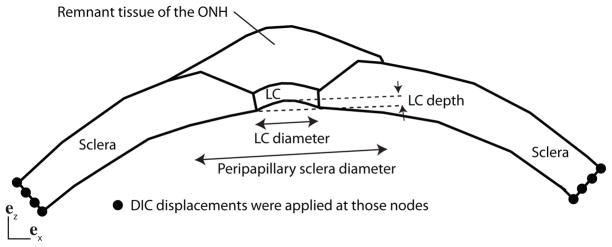
Schematic of the finite element model for the posterior scleral cup with the peripapillary sclera and the optic nerve head. The peripapillary sclera thins over a distance equal to the LC diameter. The LC is circular of uniform thickness 400 μm and depth 0.20 mm. The DIC-measured displacements of the surface nodes were applied to all nodes spanning the thickness.
In our FE model, the periphery of the LC was described by a circle of radius rLC = 0.85 mm. The thickness of the LC was 400 μm and the central LC was elevated to 0.20 mm (Fig. 4), which corresponded to the baseline value for the LC depth used by Sigal et al. (2005). The inner surface of the specimen-specific model of the midposterior sclera described in the previous section was fit to a sphere. We used this spherical approximation to define the inner surface of the peripapillary sclera up to the LC. The outer surface of the peripapillary sclera and ONH were generated from the interpolated thickness profile by extending an outward normal vector from nodal points on the inner surface. The DIC-measured positions of the specimen surface were used to define the region of compliant tissues that lies atop the LC and peripapillary sclera. The compliant tissues consisted of fatty tissue, part of the episclera, dura, and ONH tissue, and were not dissected prior to inflation testing to prevent leakage through the ONH. The sclera, LC, and compliant remnant tissues were discretized using 3 elements through the thickness. The density of the mesh was chosen to ensure that the largest element contained at most one WAXS measurement (16995 nodes). The mesh was denser towards the LC to capture the stress concentration caused by the presence of the more compliant ONH (Fig. 5). The mechanical behavior of the peripapillary sclera was described by the distributed fiber model presented in Sec. 2.2. The probability density function for the fiber distribution was assigned from the colocalized WAXS measurements. The LC and the compliant remnant tissues were described by a quasi-incompressible Neo-Hookean model (Eq. 5) with a shear modulus μLC. The DIC-measured displacements were applied at the outer edge as kinematic boundary conditions.
Fig. 5.
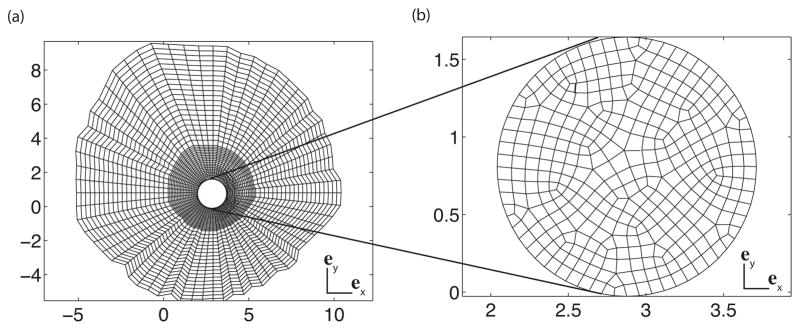
(a) 2D projection of the mesh of the sclera. (b) 2D projection of the mesh of the LC.
2.4 Inverse finite element analysis for parameter optimization
The mechanical response of the sclera was described by a set of three parameters: the two fiber parameters, α and β, and the shear modulus of the matrix, μ. The parameters were determined from the DIC-measured surface displacement fields of the inflation tested specimen using IFEA. The problem was formulated as the minimization of a cost function
 :
:
| (6) |
where nsteps = 15 is the number of IOP levels during the loading phase, nnodes is the number of nodes of the outer surface, is the experimental displacement vector at the IOP level p interpolated to node n of the surface, and is the corresponding FE displacement vector. The minimization problem was solved using a quasi-Newton algorithm. For a given set of parameters (α,β, μ), the forward problem was solved using the finite element method to determine the displacement field and calculate the cost function. The gradient of the cost function with respect to the parameter vector was calculated using the adjoint method (Gokhale et al., 2008). An improved set of parameters was generated using a quasi-Newton algorithm implemented in DAKOTA© (Sandia National Laboratories3). This process was repeated until the computed step size was below 10−15, or until the norm of the gradient was driven below 10−15.
A gradient based optimization scheme usually does not yield a global solution if the problem is not convex. To determine whether the converged parameters represented a local minimum, the IFEA was performed in two steps. In the first step, the range of initial parameters was varied over two orders of magnitude. The initial values of μ and α were 1, 10 or 100 and the initial values of β were 5, 50 or 150. The combinations of these parameters produced 27 sets of initial parameters. For each of these sets, the optimization was run on a coarse mesh (1440 nodes) to speed up convergence. This first step was used to reduce the search intervals for the 3 parameters. In the second step, the IFEA was applied to the mesh described in section 2.3.1. It was started from 8 sets of initial parameters, where μ, α, and β were the endpoints of the converged intervals from the first step.
2.5 Effects of the fiber structure on the mechanical response of the sclera
The obtained material parameters were applied to a micromechanical study of the effects of the fiber structure on the anisotropic stress response of the sclera at different length scales. Finite element models of square sections measuring 0.5 mm, 2 mm or 4.5 mm in length and 1.2 mm in thickness were constructed. The models were discretized with 8-node Q1P0 hexahedral elements. An equibiaxial macroscopic stress state was simulated by prescribing a normal traction, σ = 21.2 kPa, to the left and right e1-boundaries and top and bottom e2-boundaries. The e3-boundaries were left traction free (Fig. 6c). The applied traction corresponded to the principal stresses in a thin-walled spherical membrane model of the eye.
Fig. 6.
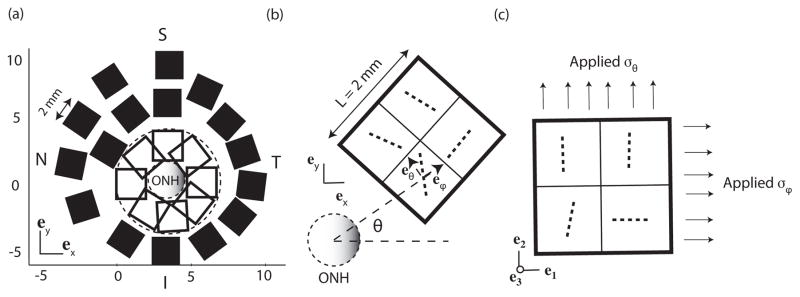
(a) Location of the select square regions 2 mm in length and 1.2 mm in thickness. (b) Schematic representation of the fibers in the cartesian coordinate system before coordinate transformation for a model in the temporal/superior sclera. The circumferential eθ and meridional eϕ unit vectors were determined for each element centroid. (c) Same fibers after coordinate mapping. These orientations were used for the biaxial simulations. The same probability density function is used through the thickness. For clarity, only 4 elements are represented. For the simulations, the area was discretized into 256 elements.
| (7) |
where r = 12.7 mm, and t = 1.2 mm are the average radius and thickness of the inflated specimen, and p = 30 mmHg is the maximum pressure applied in the inflation test. The applied 21.2 kPa traction was comparable to the average maximum principal stress calculated by FEA for the midposterior region, which was 18.7 kPa. To calculate the macroscopic strain, displacements were extracted at the nodes of the traction boundary conditions and averaged. The average normal strains in the e1- and e2-directions were calculated as: , where d̄i is the average displacement in the ei-direction and L is the initial length of the square geometry. The mechanical anisotropy was evaluated by the anisotropic ratio:
| (8) |
As defined, the anisotropic ratio is always greater than 1 and is equal to 1 for an isotropic material.
2.5.1 Micromechanics at the WAXS level
To evaluate the anisotropic behavior at the length scale of the WAXS measurement, finite element models were developed for each 0.5 mm × 0.5 mm × 1.2 mm region. A single 8-node hexahedral element was used to discretize the region. The WAXS data was rotated to align the preferred orientation with the horizontal e1-direction of the element. For these simulations, the anisotropic ratio in Eq. 8 compared the strain response in the preferred fiber and perpendicular directions.
2.5.2 Micromechanics at the level of peripapillary sclera
To evaluate the mechanical anisotropy at the length scale of the peripapillary region, finite element models measuring 2.0 mm × 2.0 mm × 1.2 mm were created for select areas of the posterior sclera. Each contained 16 different WAXS measurements and was discretized using 256 hexahedral elements, with 3 elements through the thickness. The simulations compared the strain response in the circumferential and meridional directions of 8 overlapping areas in the peripapillary sclera and 16 areas in the midposterior sclera (Fig. 6a). To evaluate the strain response in these directions, the WAXS data was rotated so that the meridional and circumferential directions of each measurement site aligned with the horizontal e1- and vertical e2-directions as shown in Fig. 6b and c.
2.5.3 Comparison to the biaxial experiments from Eilaghi et al. (2010)
The third set of simulations examined seven 4.5 mm square sections in the midposterior region. This length scale corresponded to the size of the scleral specimens used by Eilaghi et al. (2010), which were subjected to strain-controlled biaxial testing in the circumferential and meridional directions. To approximate this loading condition, the orientation of the sector was rotated such that the meridional eϕ and circumferential directions eθ coincided with the horizontal e1- and vertical e2-directions of the model as shown in Fig. 7b and c. A 2% equibiaxial macroscopic strain was applied in the e1- and e2-directions. The normal stresses on the boundaries were extracted and averaged to calculate the macroscopic stress response to the applied displacements. The anisotropic ratio was defined for these simulations as the ratio of the maximum to minimum normal stresses in the e1- and e2-directions.
Fig. 7.
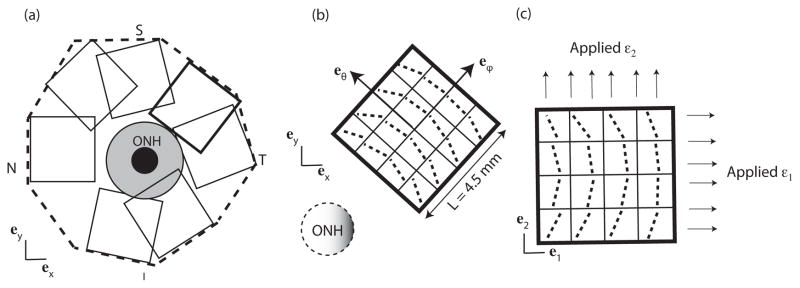
(a) Location of the overlapping square regions 4.5 mm in length and 1.2 mm in thickness. The peri-papillary region is highlighed in grey. (b) Schematic representation of the fibers in the cartesian coordinate system for a model in the temporal/superior sclera before coordinate transformation, and (c) after coordinate transformation. For the simulations, the area was discretized into 1024 elements.
2.6 Effects of the fiber structure on the mechanical response of the ONH
The effects of the scleral anisotropy on the inflation response of the ONH were evaluated using the FE model of the posterior sclera presented in Sec. 2.3.2 and different model representations of the collagen structure. Four measures were defined for the deformation response of the ONH to pressurization: the lamina cribrosa posterior deformation (LCP), the scleral canal expansion (SCE), the maximum principal tensile strain in the LC, and the maximum principal shear strain in the LC. These measures have been used previously by Girard et al. (2009b), Sigal et al. (2011), and Grytz and Mesch (2010) to describe the inflation response of the LC. The LCP was defined as the difference between the deformed and undeformed LC depth (Fig. 8a):
| (9) |
Fig. 8.
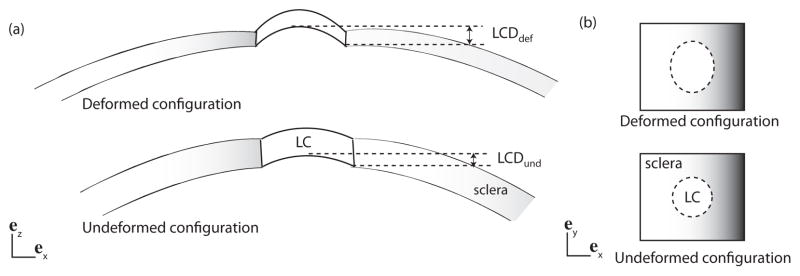
(a) Schematic representation of the LC and the sclera in the (ex, ez) plane, showing the LCP (Eq. 9). (b) Schematic representation of the LC and sclera in the (ex, ey) plane. P and p from Eq. 10 are the undeformed and deformed circumferences of the LC.
The SCE was defined from the ratio of the deformed (p) to the undeformed (P) circumferences of the scleral canal (Fig. 8b):
| (10) |
Two factors contribute to the heterogeneity in the collagen structure of the midposterior sclera. First, the preferred fiber orientation exhibit large local variations. Second, the degree of fiber alignment in the midposterior sclera was significantly smaller than in the peri-papillary sclera. The effects of both factors on the mechanical response of the ONH were evaluated separately by comparing the ONH deformation calculated for different model representations of the collagen fiber structure to those calculated for the physiological collagen structure measured by WAXS.
2.6.1 Variations in local anisotropy in the posterior sclera
To study the effects of variations in the fiber alignment, we progressively filtered out the less anisotropic features of the sclera, based on a threshold criterion for the anisotropic ratio, AR (Eq. 8). An initial threshold was set to AR = 1.1 at the beginning of the study. All the elements for which the corresponding WAXS measurement generated an anisotropic ratio below this threshold were made isotropic by changing the probability density distribution of 1 the element to a constant, . The threshold was incremented by Δ(AR) = 0.1 for each subsequent simulation, which increased the size of the isotropic regions of the model. The corresponding isotropic area and the ONH deformation were tracked as this process progressed.
2.6.2 Variations in preferred fiber orientation in the midposterior sclera
To study the effects of variations in fiber orientation, we divided the midposterior sclera fiber structure into contiguous sectors containing approximately the same number of WAXS measurements, as shown in Fig. 9. An average preferred fiber orientation was calculated for each sector by summing all the WAXS measurements contained in the sector. As shown in Fig. 9, the average preferred fiber vector had a larger circumferential component. A model collagen structure was developed for the midposterior sclera by replacing the preferred fiber orientation of the WAXS measurements with the averaged preferred orientation of the sector. In the peripapillary sclera, the collagen fiber structure was unaltered and assigned from the colocalized WAXS measurements.
Fig. 9.

Division of the midposterior sclera fiber structure. Each region was described by a single preferred collagen orientation (black arrow) determined by averaging the preferred orientation of all WAXS measurements located within the region. On average, the fibers were preferentially aligned in the circumferential direction. The fiber structure of the peripapillary sclera was not modified.
2.6.3 Variations in degree of fiber alignment in peripapillary sclera
The WAXS measurements showed the existence of a ring of highly aligned collagen in the region closest to the ONH. To evaluate the effects of the variations in fiber alignment in the peripapillary sclera, we constructed a model representation of the collagen fiber structure, which was based on two assumptions. First, the contribution of the midposterior sclera anisotropy to the mechanical response of the ONH is negligible compared to that of the peripapillary sclera; thus the midposterior sclera can be modeled as isotropic. Second, the variations in the fiber structure of the peripapillary sclera can be neglected such that the entire region can be described by a uniform von Mises probability density function with a preferred orientation along the circumferential direction:
| (11) |
where θ is measured from the circumferential direction, I0 is the modified Bessel function of the first kind, and k is the dispersion parameter. The dispersion parameter k ranges from 0 for a randomly oriented fiber structure to k → ∞ for a unidirectional collagen structure aligned in the circumferential direction. Figure 10a illustrates the quality of the fit of a normalized scatter intensity from a WAXS measurement in the peripapillary sclera to a Von Mises distribution function. The deformation response of the ONH was evaluated for different dispersion parameters k ranging from 0 to 2. Figure 10b shows the one-to-one mapping between the value of k and the anisotropic ratio defined in Eq. 8. The average dispersion parameter in the peripapillary sclera was k = 0.6.
Fig. 10.

(a) A representative normalized scatter intensity in the peripapillary and a fit by a semicircular von Mises probability density distribution. (b) One-to-one mapping between the dispersion parameter k of the von Mises distribution function and the anisotropic ratio defined in Eq. 8.
3 Results
3.1 Experimental results
Figure 11 presents the results of the WAXS measurements for the fiber structure as well as the circumferential and meridional strain contours at 30 mmHg obtained from the inflation tests for two right sclera from two female Caucasian donors aged 71 (FC71r) and 67 (FC67r). The color coding of each individual polar plot indicates the degree of anisotropy. For both specimens, the peripapillary sclera was characterized by a ring of circumferentially aligned collagen fibers surrounding the scleral canal. This feature also corresponded to a region of large meridional strains observed in the inflation experiments. In general, the fiber structure in the peripapillary sclera was significantly more aligned than in the midposterior collagen.
Fig. 11.

A composite polar plot showing the preferred orientations of aligned collagen fibers and degree of alignment of two human scleral specimens, FC71r (first row) and FC67r (second row). The color scale conveys the degree of fiber alignment. Contour plots of circumferential and meridional strains at 30 mmHg are shown on the right. The circumferential fiber alignment in the peripapillary sclera generates large meridional strains. S indicated the location of the superior pole, T the temporal, I the inferior and N the nasal.
3.2 Parameter determination
The IFEA for parameter determination was performed in two steps for 27 sets of initial estimates. The first step of the IFEA reduced the parameter space for the optimization problem. Eight sets of parameter estimates were created using the converged endpoints of the first step (Table 1). The converged parameter sets after the second IFEA step are given in Table 2. The algorithm was not able to find a unique solution; however, the range of the converged parameters was small compared to the range of the initial parameters for both specimens. Figure 12 compares the stress-strain response in the preferred fiber and perpendicular directions for the 8 converged sets of parameters. These were almost identical. The stress-strain response of the two specimens of human sclera was nearly linear; thus it was not well described by the exponential function for the fiber stress response in Eq. 3. This may explain why multiple sets of parameters had similar values of the cost function. This form of strain energy density function was adopted to model the inflation response of younger specimens, which exhibited larger strains and a more nonlinear stress response (Coudrillier et al., 2012). The sets of parameters associated with the smallest value of the cost function were used for the parametric studies. These were (μ,α,β) = (308, 122.2, 11.4) for FC71r and (μ,α,β) = (282, 106, 12.1) for FC67r.
Table 1.
Initial sets of parameters for the second step of the IFEA.
| FC71r | FC67r | |||||||
|---|---|---|---|---|---|---|---|---|
| μ kPa | α kPa | β no unit |
10−4mm |
μ kPa | α kPa | β no unit |
10−4mm |
|
| run1 | 150 | 15 | 10 | 77 | 50 | 20 | 10 | 178 |
| run2 | 150 | 120 | 10 | 6.86 | 50 | 130 | 10 | 8.9 |
| run3 | 150 | 15 | 70 | 4.32 | 50 | 20 | 80 | 10.4 |
| run4 | 150 | 120 | 70 | 6.23 | 50 | 130 | 80 | 43 |
| run5 | 300 | 15 | 10 | 18.3 | 150 | 20 | 10 | 35 |
| run6 | 300 | 120 | 10 | 3.5 | 150 | 130 | 10 | 6.5 |
| run7 | 300 | 15 | 70 | 3.9 | 150 | 20 | 80 | 7.5 |
| run8 | 300 | 120 | 70 | 4.67 | 150 | 130 | 80 | 37.8 |
Table 2.
Converged sets of parameters for each initial set of table 1.
| FC71r | FC67r | |||||||
|---|---|---|---|---|---|---|---|---|
| μ kPa | α kPa | β no unit |
10−4mm |
μ kPa | α kPa | β no unit |
10−4mm |
|
| run1 | 248 | 141.7 | 10.7 | 2.89 | 282 | 106 | 12.1 | 5.05 |
| run2 | 268 | 128.7 | 11.3 | 2.84 | 263 | 126.8 | 10.2 | 5.11 |
| run3 | 255 | 96.8 | 14.7 | 2.88 | 234 | 121 | 11.4 | 5.24 |
| run4 | 253 | 110.5 | 13.3 | 2.88 | 260 | 100.4 | 13.1 | 5.14 |
| run5 | 267 | 79.7 | 17.7 | 2.86 | 239 | 117.4 | 11.7 | 5.21 |
| run6 | 308 | 122.2 | 11.4 | 2.78 | 313 | 131 | 9.3 | 4.97 |
| run7 | 240 | 84.7 | 17.2 | 2.92 | 241 | 119 | 11.3 | 5.21 |
| run8 | 250 | 110.6 | 13.3 | 2.88 | 229 | 158 | 9.1 | 5.23 |
Fig. 12.

True stress versus stretch in the preferred fiber direction and perpendicular direction for an equibiaxial tension of 2% generated using the 8 sets of converged parameters for FC67r and FC71r (Table 2). The fiber dispersion is described by a von Mises distribution function (k = 0.6), representing the average alignment in the peripapillary sclera.
Figure 13 shows the contour plots of the three components of the DIC-measured displacement field and the FE displacement field for both specimens. To evaluate the quality of the parameter determination, we defined a local L2 error norm of the difference between experimental and model displacement fields as:
| (12) |
where uE and uMOD are the experimental and FE displacement vectors. The error was calculated for each surface node at a pressure of 30 mmHg (Fig. 14). The average error over the entire region was 5.4% for FC71r and 6.5% for FC67r. The locations where the error was greater than 12% are circled. Poor thickness approximation may contribute to the discrepancies observed between DIC and FE contours. Scleral thickness may substantially vary over a small area, and it is possible that more than 16 thickness measurements are needed to replicate the thickness profile. In addition, the DIC displacement contours exhibited regions of nonuniform displacements, with locally high values in an otherwise low displacement region. These may be cause by local anatomic irregularities such as blood vessels. These irregularities could not be captured by the global optimizer, which minimized the nodally averaged error between DIC-measured and FE displacements over the entire surface. For example, the displacement contours of the FC67r specimen exhibited two small regions of large displacements in the superior quadrant, which were smoothed out in the IFEA results (Fig. 13).
Fig. 13.

Contours of the experimentally measured and computed displacement fields for the FC71r (left) and FC67r (right) at 30 mmHg: (a) uexp, (b) uFE, (c) vexp, (d) vFE, (e) wexp, and (f) wFE, where u is the displacement in the x-direction, v is the displacement in the y-direction and w is the displacement in the z-direction.
Fig. 14.
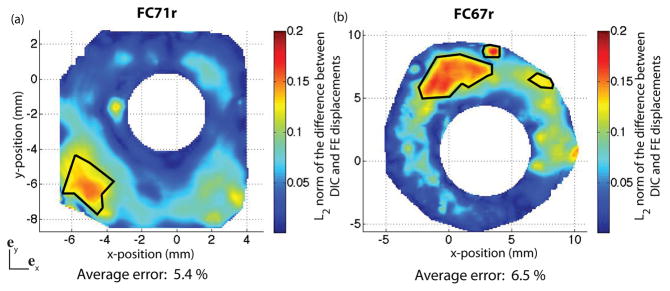
Map of the L2 error norm between DIC-measured and finite element displacement field at 30 mmHg. The error is defined in Eq. 12. Locations where the error is larger than 12% are circled. (a) FC71r, and (b) FC67r.
Figure 15 shows the circumferential and meridional strain contours at 30 mmHg obtained from the DIC-measured displacement field and the FE displacement field following the method presented in Sec. 2.1. There was good agreement between the measured and computed strains averaged over the entire external surface. However, the error in the local strains exceeded 100% in certain areas. The DIC displacements were computed with an inherent uncertainty that was experimentally measured to be 8 μm (Coudrillier et al., 2012). The experimental strain calculation likely amplified the initial uncertainty of the displacement measurements. The average strains were consistent with recent experimental work on the monkey eye (Girard et al., 2009b), porcine eye (Lari et al., 2012) and human eye (Eilaghi et al., 2010). For both specimens, the average meridional strain Eϕϕ was larger than the circumferential strain Eθθ, which suggested that on average, collagen fibers were preferentially aligned in the circumferential direction.
Fig. 15.
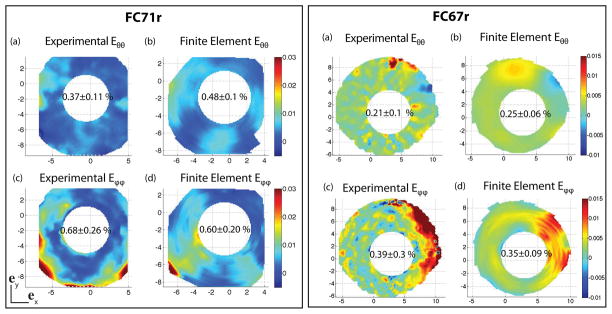
(a) Experimental circumferential strain Eθ θ, (b) finite element circumferential strain Eθ θ, (c) experimental meridional strain Eϕ ϕ, and (d) finite element meridional strain E ϕ ϕ at 30 mmHg. The same color scale is used for DIC and FE strains. The strains are calculated following the method in Sec. 2.1.
3.3 Effects of the collagen fiber structure on the mechanical anisotropy of the sclera
3.3.1 Micromechanics at the WAXS level
Figure 16 plots the anisotropic ratio for each WAXS measurement. The results for the two specimens exhibited similar features, including a strong mechanical anisotropy in the peri-papillary sclera. For FC67r, the direction of preferred fiber alignment in the region closest to the ONH was on average 2.0 times stiffer than the perpendicular direction. The heterogeneity in the aligned scatter observed in the polar plot contributed to large variations of the mechanical anisotropic ratio within the peripapillary sclera. For both specimens, the anisotropic ratio was largest in the superior/temporal quadrant and lowest in the nasal/superior quadrant. The average anisotropic ratio was lower in the midposterior sclera with an average value of 1.4. At the length scale of the WAXS measurements, the midposterior sclera was significantly anisotropic.
Fig. 16.
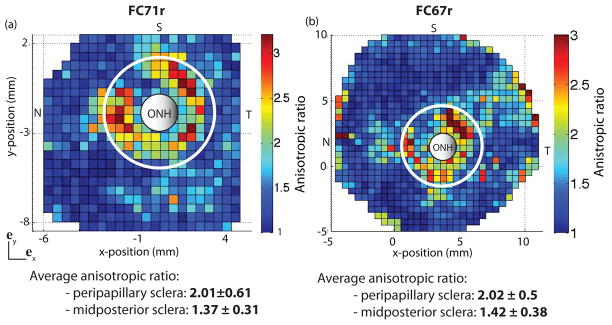
Map of the anisotropic ratio for (a) FC71r (left) and (b) FC67r (right). Both maps are generated by simulating an equibiaxial stress to 21 kPa on an element for which the probability density function is the normalized scatter of a single WAXS measurement, using the converged parameters of the IFEA. The midposterior region was defined as the region outside the circle of radius r = 3rONH centered on the ONH. Note that these maps do not carry information about the local direction of the fibers.
3.3.2 Micromechanics at the level of peripapillary sclera
Figure 17 shows the anisotropic ratio for the different regions located in the peripapillary and midposterior sclera. At this length scale, the peripapillary sclera remained significantly more anisotropic than the midposterior sclera. However, the value of the anisotropic ratio was reduced. In the peripapillary sclera, the circumferential direction was consistently the stiffer direction compared to the meridional direction. This suggests that the main cause of heterogeneity in this region was the local variations in fiber alignment. In contrast, over half of the regions in the midposterior sclera were stiffer in the meridional direction (7/16 for FC67r and 10/13 for FC71r).
Fig. 17.
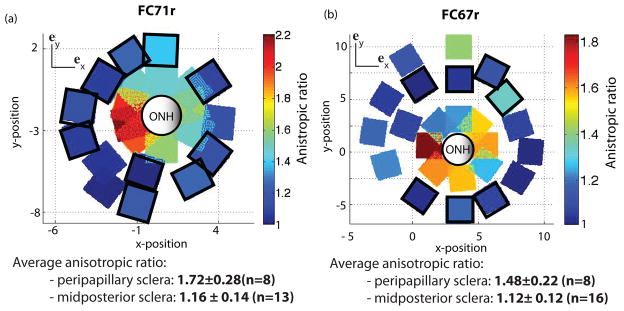
Anisotropic ratio calculated from the micromechanical models 2.0 mm in length for (a) FC71r (left) and (b) FC67r (right). Squares with black borders were stiffer in the meridional direction. The others were stiffer in the circumferential direction.
3.3.3 Comparison to the biaxial experiments from Eilaghi et al. (2010)
Figure 18 plots the average stress-strain response computed for the seven 4.5 mm square regions of the midposterior sclera. The plot includes the data for the stiffest and most compliant specimen measured by Eilaghi et al. (2010). The authors measured the level of anisotropy as the ratio of the stiffness in orthogonal directions and reported a value of 1.065 ± 0.33. In our simulations, the level of anisotropy was defined as the ratio of the maximum stress in the two orthogonal directions. The average value for the 7 models was 1.096 ± 0.075. The results agreed well with the experimental data of Eilaghi et al. (2010) both in the level of anisotropy and in the stress-strain response. It should be noted that we used the model parameters determined from an inflation test to 30 mmHg to predict the biaxial response at a level of stress that corresponded to a significantly higher pressure of 150 mmHg. This set of simulations was only performed for FC67r. The area characterized by WAXS for the FC71r specimen was too small to generate 4.5 mm square regions.
Fig. 18.
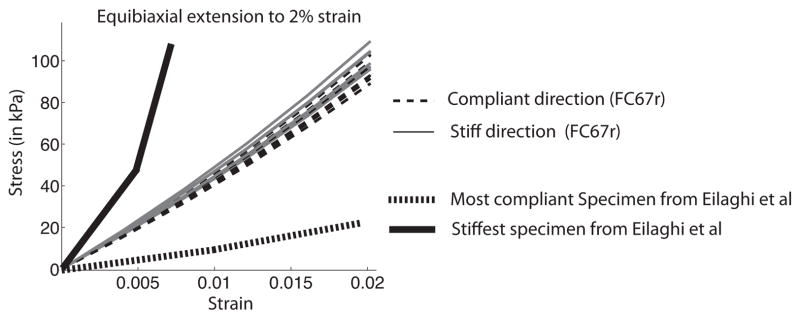
Stress-strain curves for the 7 micromechanical models of the posterior sclera generated from an equibiaxial strain tension to 2%. The stiffest and most compliant specimens from Eilaghi et al. (2010) are shown for comparison.
3.4 Effect of the fiber structure on the mechanical response of the ONH
The converged parameters determined by IFEA were used to describe material properties of the midposterior and peripapillary regions of the FE model for the posterior scleral cup presented in Sec. 2.3.2. The value of the shear modulus of the LC, μLC = 10 kPa, was determined by minimizing the L2 error norm between DIC-measured and FE displacements in the ONH region (Fig. 19). The average error in the displacements over the entire posterior sclera was 8.3%, while the average error in the peripapillary region was 8.6%. The error was larger in the superior region, probably due to a poor thickness approximation in this region. The small area in the outer nasal peripapillary, where the error approached 30%, exhibited an abnormally low displacement compared to the surrounding region (Fig. 19a). This area most likely corresponded to the presence of a local anatomic structure (e.g., the entrance of a vortex vein).
Fig. 19.
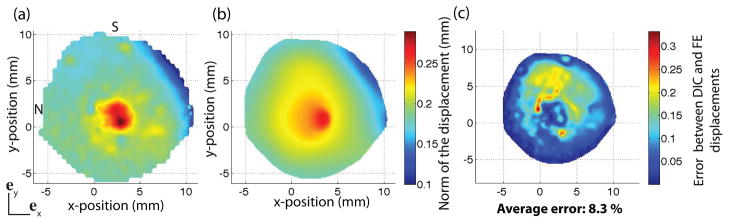
(a) Magnitude of the DIC-measured displacement vector at 30 mmHg. (b) Magnitude of the FE displacement vector at 30 mmHg. The magnitude of the displacement vector is defined as . (c) L2 error norm between DIC-measured and FE displacement fields calculated from Eq. 12.
3.4.1 Variations in local anisotropy in the posterior sclera
In this study, the sclera was made progressively more isotropic by filtering out the regions where the local anisotropic ratio was below a given threshold. Figure 20 shows the evolution of the surface area described as isotropic. An anisotropic ratio threshold of AR = 1 corresponded to the physiological fiber structure, while an AR = 3.2 threshold corresponded to an entirely isotropic sclera. The midposterior sclera was nearly entirely isotropic for a threshold value of AR = 1.8.
Fig. 20.

A white square represents a WAXS measurement for which the anisotropic ratio is below the anisotropic ratio (AR) threshold indicated on top of the figure. This surface area was described as isotropic in the simulation. The portion of the sclera modeled as isotropic increased with increasing anisotropic ratio threshold. The boundary between the peripapillary sclera and midposterior sclera is represented on the top left and bottom right figures.
In the remainder of the paper, the ONH deformation measures were calculated at 30 mmHg. Figure 21 plots the percentage differences relative to the physiological fiber structure in scleral canal expansion, LC posterior deformation, maximum principal strain, and maximum shear strain for increasing AR threshold values. The measures of the ONH deformation of the physiological fiber structure are reported in Table 3. Increasing the anisotropic threshold from AR = 1.0 to AR = 1.6 converted 71% of the scleral specimen to an isotropic material (Fig. 20); however, this produced minimal changes to the deformation response of the LC (Fig. 21). Significant increases in scleral canal expansion and LC strains, and significant decreases in LC posterior deformation were observed for threshold values larger than AR = 1.6, when the study began to alter the anisotropic collagen structure of the peripapillary region. This suggests that the anisotropy of the peripapillary region plays a major role in the biomechanics of the ONH. For a threshold value of AR = 2, only the most anisotropic regions of the peripapillary sclera remained. Yet, the deformation response of the LC differed substantially from those obtained for a fully isotropic model of the sclera. A more isotropic sclera produced greater expansion of the scleral canal, greater tensile and shear strains in the LC, and smaller posterior deformation of the LC. The effect was largest for the scleral canal expansion and smallest for the LC posterior deformation.
Fig. 21.

Evolution of the ONH deformation as the sclera becomes progressively more isotropic. The posterior deformation of the LC decreased with increasing isotropic area. The scleral canal expansion and maximum principal tensile and shear LC strains increased with increasing isotropic area. Increasing the threshold to AR = 1.6 converted 71% of the sclera specimen to an isotropic material. Yet, this caused minimal changes to the deformation response of the ONH. The star corresponds to the fully isotropic model.
Table 3.
For FC67r, ONH deformation for the physiological fiber structure. The preferred fiber direction and dispersion were assigned from the colocalized WAXS measurements.
| LC posterior deformation | 78.8 μm |
| Sclera canal expansion | 0.7% |
| LC max ppl. tensile strain | 12.4% |
| LC max ppl. shear strain | 11.5% |
3.4.2 Variations in preferred fiber orientation in the midposterior sclera
In this study, the heterogeneity in the fiber orientation was reduced by dividing the midposterior sclera into sectors described by a sector-averaged preferred fiber orientation (Fig. 9). In general, the average preferred fiber orientations were aligned in the circumferential direction. A model collagen structure was developed for the midposterior sclera by replacing the preferred fiber orientation of the WAXS measurements with the sector-averaged orientation. Table 4 reports the differences in the ONH deformation computed for the model fiber structure relative to the physiological fiber structure. Also listed for comparison are the results for the isotropic sclera. Reducing the variations in the fiber orientation produced a more anisotropic midposterior sclera, which greatly overestimated the LC posterior deformation and underestimated the scleral canal expansion and LC principal strains. These effects were slightly larger and in the opposite direction compared to those obtained for an isotropic sclera.
Table 4.
For FC67r, percentage differences with the physiological fiber structure for the case where a sector-averaged preferred fiber orientation was assigned for each sector and for the isotropic case. Reducing the variation in fiber orientation in the midposterior sclera generated larger errors than assuming a fully isotropic posterior sclera.
| Reduced heterogeneity in fiber orientation | isotropic sclera | |
|---|---|---|
| LC posterior deformation | 1% | −0.55% |
| Scleral canal expansion | −63% | 47% |
| LC max ppl. tensile strain | −3.1% | 3% |
| LC max ppl. shear strain | −4.7% | 4.3% |
3.4.3 Variations in degree of fiber alignment in peripapillary sclera
For this study, we assumed that the midposterior sclera was entirely isotropic. A von Mises distribution function with dispersion parameter k (Eq. 11) was used to describe the probability density function of the fiber orientation in the peripapillary region, defined as r < 3rONH. Figure 22 plots the percentage differences with the physiological fiber structure in LC posterior deformation, scleral canal expansion, LC maximum tensile, and LC maximum shear strains as a function of the dispersion parameter k. Small values of k underestimated the anisotropy in the peripapillary region. This generated a smaller LC posterior deformation and a larger scleral canal expansion than those obtained from the physiological fiber structure. Above a certain degree of fiber alignment, the model fiber structure overestimated the anisotropy in the peripapillary region, and this generated a larger LC posterior deformation and a smaller scleral canal expansion than those obtained for the physiological fiber structure. The transition did not happen at the same value of k for the 4 measures of the ONH deformation. From these results, we concluded that a homogenous anisotropy model was unable to reproduce the deformation response of the ONH.
Fig. 22.

Effects of the degree of fiber alignment in the peripapillary sclera (r < 3rONH) on the mechanical response of the LC. For small degree of fiber alignment (or small k values), the fiber alignment underestimates the anisotropy of the peripapillary sclera. For larger degree of fiber alignment, the anisotropy of the peripapillary sclera is overstimated. A more anisotropic peripapillary sclera produces larger LC posterior deformation and lower scleral canal expansion and LC strains. The transition value for k is different for each measure suggesting that a homogenous anisotropy model is unable to reproduce the ONH deformation.
4 Discussion
An inverse finite element analysis was developed to determine the material properties of two human scleral specimens from the DIC-measured displacement field of an inflation test. We used a distributed fiber model for the sclera that incorporated the WAXS measurements of the anisotropic collagen structure. The model was able to accurately reproduce the experimental displacement field with only three parameters (two for the collagen fiber response and one for the isotropic matrix response). Regional variations in material behavior were solely attributed to variations in the collagen structure, either in the preferred fiber orientation or in the dispersion. We used the WAXS measurements of the fiber structure and the material parameters calculated from the inverse finite element analysis to evaluate the effects of the collagen fiber structure on the mechanical anisotropic response of the sclera and the ONH. The main findings of the study were:
In the peripapillary sclera, the collagen fibers were circumferentially aligned. At the length scale of the WAXS measurements, the circumferential direction was on average twice as stiff as the meridional direction. There were large differences in the degree of fiber alignment between different regions of the peripapillary sclera. The heterogeneity was primarily caused by local variations in the degree of fiber alignment.
A more isotropic sclera produced larger scleral canal expansions, larger tensile and shear strains in the LC, and lower LC posterior deformation than those obtained from the physiological fiber structure. Local variations in the degree of fiber alignment within the peripapillary sclera significantly influenced the mechanical response of the ONH. We were unable to reproduce the physiological deformation response of the ONH by modeling the peripapillary sclera as a uniformly anisotropic region characterized by an effective fiber orientation distribution.
The collagen structure in the midposterior sclera exhibited large variations in the preferred fiber orientations as well as a low degree of fiber alignment. This region was significantly anisotropic at the 0.5 mm length scale of the WAXS measurements; however, the mechanical anisotropy decreased with increasing length scales. Over a 4.5 mm square region, which contained 81 WAXS measurements, the behavior was close to isotropic. The heterogeneous fiber structure resulted in an effective isotropic behavior at the tissue level. Modeling the midposterior sclera as isotropic did not significantly alter the deformation response of the ONH. In contrast, modeling the region as more anisotropic by reducing the variation in the preferred fiber orientation greatly decreased the scleral canal expansion and the LC principal strains, and increased the LC posterior deformation.
It has been hypothesized that the deformation of the ONH tissue is dictated by the material properties and geometry of the tissues of the ONH and the sclera (Burgoyne et al., 2009). Bellezza et al. (2000) showed that the geometry of the scleral canal and the scleral thickness strongly influenced the IOP-related stress in the ONH. Sigal et al. (2005, 2011) extended these findings by numerically evaluating the influence of geometry and mechanical properties of the sclera on the ONH. Recently, Norman et al. (2010) showed that the peri-papillary scleral thickness played a significant role in the mechanical response of the ONH. All these conclusions were drawn assuming an isotropic linear elastic sclera. We present a new approach that considers the sclera as an anisotropic material and that furthermore uses direct measurements of the collagen orientation provided by WAXS to describe the material anisotropy. Specifically, we applied the WAXS measurements to study the effect of local variations in the collagen structure on the estimated deformation response of the LC to elevated pressure. A previous study authored by Grytz and Mesch (2010) showed that a uniform circumferential alignment of collagen in the peripapillary sclera reduced the scleral canal expansion and may protect the tissues of the ONH. Our results suggested that, in addition, the heterogeneity in the peripapillary scleral fiber alignment played an important role in the deformation of the ONH. Recently, Pijanka et al. (2012) showed that the sclera of glaucoma eyes had a significantly lower degree of fiber alignment in the superior/temporal and in the inferior/nasal quadrants of the peripapillary sclera compared to normal eyes. Whether these differences in glaucoma existed prior to disease onset or resulted from exposure to IOP and other factors cannot be determined in a cross-sectional study. Nonetheless, the current results suggest that such regional variations in the fiber alignment of the peripapillary sclera observed in glaucoma eyes may significantly impact the biomechanical environment of the ONH. Detailed evaluation of these effects will be the focus of future studies.
We developed a representative model geometry for the ONH region based on the averaged measurements of Norman et al. (2010), Jonas et al. (2003), and Ren et al. (2009) to estimate effects of collagen anisotropy on the ONH deformation. We acknowledge that the tissue structure of the ONH determines in important ways the magnitude of scleral canal expansion, LC posterior deformation, and LC strains. Our assumed ONH features produced values for ONH deformation that were consistent with previous experimental measurements of the LC posterior deformation and scleral canal expansion. Yan et al. (1994) reported a LC posterior deformation of the central LC of 138 ± 38 μm at 50 mmHg and a non-significant increase in the scleral canal expansion with IOP elevation from 5 mmHg to 50 mmHg. We calculated a LC posterior deformation of 79 μm for an increase in IOP from 1.5 mmHg to 30 mmHg. The scleral canal expansion corresponded to an increase in the LC radius of 5.7 μm, which was small compared to the initial radius of 850 μm. The maximum principal tensile and shear LC strains were 12.4% and 11.5% and the average values were 4.8% and 5.5%. Both the peak and average values of the principal strains were similar to those calculated by Sigal et al. (2008) using individual-specific ONH geometries.
This study had a number of limitations. We attributed the tissue anisotropy to fibrillar collagens. Scleral collagen consists primarily of collagen type I (90%) and type III (≤ 5%) (Watson and Young, 2004). Both types exist as heterotypic fibrils in the sclera and contribute to molecular WAXS scatter. In our model, the contribution of the elastin fibers was lumped into the isotropic matrix. There is almost no elastin in the midposterior sclera (Quigley et al., 1991), and this assumption likely had little effect on the converged parameters of the IFEA. However, Hernandez et al. (1987) showed that the LC insertion zone of the peripapillary sclera contains circumferential elastin fibers that provide further mechanical reinforcement to the peripapillary sclera. It is possible that our model underestimated the anisotropy in this region.
The model solely attributed the variations in the material properties of the sclera to spatial variations in the collagen structure. The properties of the matrix μ and fibers (α,β) were homogenous over the entire sclera. Quigley et al. (1991) showed that the distribution in fiber diameters in the peripapillary sclera differed from that in the midposterior sclera. Moreover, the peripapillary sclera contains additional circumferential reinforcements from elastin fibers, the presence of which decays rapidly away from the ONH (Hernandez et al., 1987). Regional variations in fiber and matrix properties can be included in the model by segmenting the sclera into multiple regions and assigning different parameter sets (μ,α,β) for each region (Girard et al., 2009b). This approach would significantly increase the dimension of the parameter space, and correspondingly the computational time, which would lead to poorer convergence of the nonlinear optimization problem. We plan to address these issues in future work.
The WAXS measurements provided a thickness-averaged measurement of the orientation distribution of the collagen lamellae. The scatter intensity represents a projection of a 3D fiber structure onto the plane of the sclera. Most of the lamellae are oriented in the scleral plane; however increased lamellar interweaving has been found in the inner layers of the sclera (Watson and Young, 2004); thus assuming a 2D distributed fiber structure may underestimate the out-of-plane stiffness of the tissue. Pijanka et al. (2012) has recently carried out depth-dependent measurements of the collagen orientation in the peripapillary human sclera using multimodal nonlinear microscopy. While this did reveal a gradient in the degree of fiber alignment across the scleral thickness, it did not indicate significant variations in the preferred fiber orientations through the tissue thickness. X-ray diffraction data and second harmonic generation data collected from the same specimens showed consistent results for the preferred fiber orientation, indicating that the WAXS measurements are appropriate for describing the thickness-averaged fiber orientation. The WAXS measurements may also underestimate the degree of fiber alignment because the microfibrillar subunits are tilted from the fiber axis. We expect this error to be minor because the tilt angle in the sclera is small (~ 5°). Finally, the diffraction experiments were performed on prior-inflated specimens and the mechanical loading may induce structural reorientation and damage. To evaluate this effect, we repeated the initial load-unload test at the end of the inflation test and compared the pressure/displacement and pressure/strain responses of this final test to those from the first test (Myers et al., 2010). The strain response of these two tests was nearly identical, which suggested that inflation testing did not alter the fiber structure. Several researchers have successfully applied the WAXS measurements to model the fiber structure of the cornea (Nguyen and Boyce, 2011; Nguyen et al., 2008; Pinsky et al., 2005; Pandolfi and Holzapfel, 2008; Studer et al., 2010).
The main objective of this paper was to evaluate the effects of the scleral fiber structure on the ONH deformation. However, it is not possible to isolate the effects of the scleral fiber structure from those determined by the ONH geometry and material properties. An analysis of the effects of ONH geometry and mechanical properties was not within the scope of this paper and was addressed in great detail by Sigal et al. (2005, 2011). Instead, we used an idealized geometry of the ONH to study the effects of scleral anisotropy on the deformation response of the ONH to IOP elevation. We verified that our conclusions were not dominated by the representation of the ONH geometry and material behavior. The study presented in Sec. 3.4 was repeated for different values of LC moduli (2 - 50 kPa). This affected the absolute value of the ONH deformation response, but did not change the main conclusions of the study. We also created a simpler model for the ONH region, one that used a uniform thickness to describe the peripapillary sclera and LC (Girard et al., 2009b). This affected the magnitude of the LC deformation, but did not alter the conclusions of the study.
5 Conclusions
Two human sclera of donors close in age and of the same sex and race were used in this study to evaluate the effects of the collagen structure of the posterior sclera on the mechanical response of the sclera and the ONH. The two specimens showed a similar inflation response and collagen fiber structure. The circumferential fibers in the peripapillary sclera provided mechanical reinforcement in the circumferential direction that limited the scleral canal expansion and reduced the tensile and shear strains within the LC. Local variations in the fiber alignment in the peripapillary region were critical to describe the ONH deformation. The collagen anisotropy was lowest in the nasal/superior quadrant and highest in the superior/temporal quadrant. Regional differences in fiber alignment may represent adaptive changes in response to intraocular pressure. Individual variations in the fiber alignment in the peripapillary sclera may also be associated with susceptibility to glaucomatous damage. In future work, the methods presented in this study will be applied to evaluate how age and glaucoma-induced variations in the anisotropic collagen structure may affect the mechanical response of the ONH.
A Effects of the midposterior sclera fiber structure on the mechanical response of the ONH for FC71r
The study of paragraph 3.4.1 was repeated for FC71r. Figure 23 shows the evolution of the area of the sclera described as isotropic with increasing values of anisotropic ratio threshold. Figure 24 plots the evolutions of the deformation of the ONH with increasing isotropic area.
Fig. 23.

A white square represents a WAXS measurement for which the anisotropic ratio is below the anisotropic ratio (AR) threshold indicated on top of the figure. This surface area was described as isotropic in the simulation. The portion of the sclera modeled as isotropic increased with increasing anisotropic ratio threshold.
Fig. 24.

Evolution of the ONH deformation as the area of the posterior sclera described as isotropic increases. The posterior deformation of the LC decreases with increasing isotropic area. The scleral canal expansion and maximum principal tensile and shear LC strains increase with increasing isotropic area. The star corresponds to the fully isotropic model.
Acknowledgments
Baptiste Coudrillier and Thao D. Nguyen would like to thank Dr. Victor Barocas and Dr. Peter Pinsky for helpful discussions regarding this work. This work was supported in part by the Public Health Service Research Grants EY021500 (Thao D. Nguyen), EY02120 and EY01765 (Harry A. Quigley and Wilmer Institute), the Fight For Sight grant 1360 (Craig Boote), the Leonard Wagner Charitable Trust, William T. Forrester, and Saranne and Livingston Kosberg (Harry A. Quigley).
Footnotes
Contributor Information
Baptiste Coudrillier, Department of Mechanical Engineering, Johns Hopkins University, Baltimore, MD 21218, USA.
Craig Boote, Structural Biophysics Group, School of Optometry and Vision Sciences, Cardiff University, Cardiff, CF24 4LU, Wales, UK.
Harry A. Quigley, Glaucoma Center of Excellence, Wilmer Ophthalmological Institute, Johns Hopkins University School of Medicine, Baltimore, MD, 21218, USA
Thao D. Nguyen, Email: vicky.nguyen@jhu.edu, Department of Mechanical Engineering, Johns Hopkins University, Baltimore, MD 21218, USA
References
- Bellezza A, Hart R, Burgoyne C. The optic nerve head as a biomechanical structure: initial finite element modeling. Invest Ophthalmol Vis Sci. 2000;41:2991–3000. [PubMed] [Google Scholar]
- Burgoyne C, Downs J, Bellezza A, Suh J, Hart R. The optic nerve head as a biomechanical structure: a new paradigm for understanding the role of iop-related stress and strain in the pathophysiology of glaucomatous optic nerve head damage. Prog Retin Eye Res. 2009;88 (4):39–73. doi: 10.1016/j.preteyeres.2004.06.001. [DOI] [PubMed] [Google Scholar]
- Coudrillier B, Tian J, Alexander S, Myers K, Quigley H, Nguyen T. Biomechanics of the human posterior sclera: age- and glaucoma-related changes measured using inflation testing. Invest Ophthalmol Vis Sci. 2012;53:1714–1728. doi: 10.1167/iovs.11-8009. [DOI] [PMC free article] [PubMed] [Google Scholar]
- Eilaghi A, Flanagan J, Tertinegg I, Simmons C, Brodland G, Ethier C. Biaxial mechanical testing of human sclera. J Biomech. 2010;43 (9):1696–1701. doi: 10.1016/j.jbiomech.2010.02.031. [DOI] [PubMed] [Google Scholar]
- Ethier C. Scleral biomechanics and glaucoma, a connection? Can J Ophthalmol. 2006;41(1):9–12. 14. doi: 10.1016/S0008-4182(06)80060-8. [DOI] [PubMed] [Google Scholar]
- Girard M, Downs J, Burgoyne C, Suh J. Peripapillary and posterior scleral mechanics - part i: development of an anisotropic hyperelastic constitutive model. Journal of Biomechanics. 2009a:131. doi: 10.1115/1.3113682. [DOI] [PMC free article] [PubMed] [Google Scholar]
- Girard M, Suh J, Bottlang M, Burgoyne C, Downs J. Scleral biomechanics in the aging monkey eye. Invest Ophthalmol Vis Sci. 2009b;50 (11):5226–5237. doi: 10.1167/iovs.08-3363. [DOI] [PMC free article] [PubMed] [Google Scholar]
- Girard M, Suh J, Hart R, Burgoyne C, Downs J. Effects of storage time on the mechanical properties of rabbit peripapillary sclera after enucleation. Curr Eye Res. 2007;32 (5):465–470. doi: 10.1080/02713680701273792. [DOI] [PubMed] [Google Scholar]
- Gokhale N, Barbone P, Oberai A. Solution of the nonlinear elasticity imaging inverse problem: the compressible case. Inverse Probl. 2008:24. doi: 10.1016/j.cma.2010.12.018. [DOI] [PMC free article] [PubMed] [Google Scholar]
- Grytz R, Mesch G. The collagen fibril architecture in the lamina cribrosa and peripapillary sclera predicted by a computational remodeling approach. Biomech Model Mechanobiols. 2010;10 (3):371–382. doi: 10.1007/s10237-010-0240-8. [DOI] [PubMed] [Google Scholar]
- Hernandez M, Luo X, Igoe F, Neufeld A. Extracellular matrix of the human lamina cribrosa. Am J Ophthalmol. 1987;104:567–76. doi: 10.1016/0002-9394(87)90165-6. [DOI] [PubMed] [Google Scholar]
- Jonas J, Berenshtein E, Holbach L. Anatomic relationship between lamina cribrosa, intraocular space, and cerebrospinal fluid space. Invest Ophthalmol Vis Sci. 2003;44:5189–5195. doi: 10.1167/iovs.03-0174. [DOI] [PubMed] [Google Scholar]
- Jonas J, Holbach L. Central corneal thickness and thickness of the lamina cribrosa in human eyes. Invest Ophthalmol Vis Sci. 2005;46(4):1275–1279. doi: 10.1167/iovs.04-0851. [DOI] [PubMed] [Google Scholar]
- Lari D, Schultz D, Wang A, Lee O, Stewart J. Scleral mechanics: Comparing whole globe inflation and uniaxial testing. Experimental Eye Research. 2012;94:128–135. doi: 10.1016/j.exer.2011.11.017. [DOI] [PMC free article] [PubMed] [Google Scholar]
- Morrison J, Johnson E, Cepurna W, Jia L. Understanding mechanisms of pressure-induced optic nerve damage. Prog Retin Eye Res. 2005;24 (2):217–240. doi: 10.1016/j.preteyeres.2004.08.003. [DOI] [PubMed] [Google Scholar]
- Myers K, Coudrillier B, Boyce B, Nguyen T. The inflation response of bovine sclera. Acta Biomater. 2010;6 (11):4327–4335. doi: 10.1016/j.actbio.2010.06.007. [DOI] [PubMed] [Google Scholar]
- Nguyen T, Boyce B. An inverse finite element method for determining the anisotropic properties of the cornea. Biomech Model Mechanobiols. 2011;10(3) doi: 10.1007/s10237-010-0237-3. [DOI] [PubMed] [Google Scholar]
- Nguyen T, Jones R, Boyce B. A nonlinear anisotropic viscoelastic model for the tensile behavior of the corneal stroma. J Biomech Eng. 2008;30(4) doi: 10.1115/1.2947399. [DOI] [PubMed] [Google Scholar]
- Norman R, Flanagan J, Rausch S, Sigal I, Tertinegg I, Eilaghi A, Portnoy S, Sled J, Ethier C. Dimensions of the human sclera: thickness measurement and regional changes with axial length. Exp Eye Res. 2010;90 (2):277–284. doi: 10.1016/j.exer.2009.11.001. [DOI] [PubMed] [Google Scholar]
- Pandolfi A, Holzapfel G. Three-dimensional modeling and computational analysis of the human cornea considering distributed collagen fibril orientations. Journal of Biomechanical Engineering. 2008:130. doi: 10.1115/1.2982251. [DOI] [PubMed] [Google Scholar]
- Pijanka J, Coudrillier B, Ziegler K, Sorensen T, Meek K, Nguyen T, Quigley H, Boote C. Quantitative mapping of collagen fiber orientation in non-glaucoma and glaucoma posterior human scleras. Invest Ophthalmol Vis Sci. 2012 doi: 10.1167/iovs.12-9705. [DOI] [PMC free article] [PubMed] [Google Scholar]
- Pinsky P, Van Der Heide D, Chernyak D. Computational modeling of mechanical anisotropy in the cornea and sclera. J Cataract Refract Surg. 2005;31:136–145. doi: 10.1016/j.jcrs.2004.10.048. [DOI] [PubMed] [Google Scholar]
- Quigley H, Brown A, Dorman-Pease M. Alterations in elastin of the optic nerve head in human and experimental glaucoma. Br J Ophthalmol. 1991;75:552–557. doi: 10.1136/bjo.75.9.552. [DOI] [PMC free article] [PubMed] [Google Scholar]
- Quigley H, Brown A, Morrison J, Drance S. The size and shape of the optic disc in normal human eyes. Arch Ophthalmol. 1990;108:51–57. doi: 10.1001/archopht.1990.01070030057028. [DOI] [PubMed] [Google Scholar]
- Ren R, Wang N, Li B, Li L, Gao F, Xu X, Jonas J. Lamina cribrosa and peripapillary sclera histomorphometry in normal and advanced glaucomatous chinese eyes with various axial length. Invest Ophthalmol Vis Sci. 2009;50:2175–2184. doi: 10.1167/iovs.07-1429. [DOI] [PubMed] [Google Scholar]
- Sigal I, Flanagan J, Ethier C. Factors influencing optic nerve head biomechanics. Invest Ophthalmol Vis Sci. 2005;11 (46):4189–4199. doi: 10.1167/iovs.05-0541. [DOI] [PubMed] [Google Scholar]
- Sigal I, Flanagan J, Tertinegg I, Ethier C. Modeling individual-specic human optic nerve head biomechanics. part i: Iop-induced deformations and inuence of geometry. Biomech Model Mechanobiol. 2008;8:85–98. doi: 10.1007/s10237-008-0120-7. [DOI] [PubMed] [Google Scholar]
- Sigal I, Yang H, Roberts M, Burgoyne C, Downs J. Iop-induced lamina cribrosa displacement and scleral canal expansion: An analysis of factor interactions using parameterized eye-specific models. Invest Ophthalmol Vis Sci. 2011;52:1896–1907. doi: 10.1167/iovs.10-5500. [DOI] [PMC free article] [PubMed] [Google Scholar]
- Studer H, Larrea X, Riedwyl H, Büchler P. Biomechanical model of human cornea based on stromal microstructure. J Biomech. 2010;43(5) doi: 10.1016/j.jbiomech.2009.11.021. [DOI] [PubMed] [Google Scholar]
- Vurgese A, Panda-Jonas A, Jonas J. Scleral thickness in human eyes. PLoS One. 2012;7(1):e29692. doi: 10.1371/journal.pone.0029692. [DOI] [PMC free article] [PubMed] [Google Scholar]
- Watson P, Young R. Scleral structure, organization and disease. a review. Exp Eye Res. 2004;78 (3):609–623. doi: 10.1016/s0014-4835(03)00212-4. [DOI] [PubMed] [Google Scholar]
- Yan D, Metheetrairut A, Trope G, Ethier C. Deformation of the lamina cribrosa by elevated intraocular pressure. Brit J Ophthalmol. 1994;78:643–648. doi: 10.1136/bjo.78.8.643. [DOI] [PMC free article] [PubMed] [Google Scholar]