

Abstract
Context:
Predicting the final menstrual period (FMP) would help women know when their menopause transition will be completed. Additionally, biological changes, such as accelerated bone loss, precede the FMP by at least 1 year.
Objective:
Our objective was to assess whether FSH, estradiol, or urinary N-telopeptide predict where an individual is on her timeline to FMP.
Methods:
The sample was 554 women from the Study of Women's Health Across the Nation. We modeled the probability of having crossed specified landmarks: 2 years before, 1 year before, and the FMP. We also modeled the probability of being in narrower intervals: 2 to1 year before FMP, 2 years before FMP and FMP, or 1 year before FMP and FMP. We determined the candidate markers that best predicted having crossed each landmark, with the optimum defined as the greatest area under the receiver-operator curve; created formulas for the probability of having crossed each landmark; and calculated sensitivity and specificity.
Results:
Final models included current estradiol and FSH (each as a fraction of 1 previous reference measure), age, menopause transition stage, race/ethnicity, and whether serum was collected during the early follicular phase. Areas under the receiver-operator curves of final models that predicted the probability of a woman having crossed 2 years before, 1 year before, and the FMP itself were 0.902, 0.926, and 0.945, respectively. If we classified women as having crossed the 2 years before the FMP landmark when predicted probability exceeded 0.3, sensitivity was 85% and specificity 77%.
Conclusion:
This model could help patients and researchers estimate the time to FMP.
One longstanding goal of scientists who study menopause has been to predict when the final menstrual period (FMP) will occur (1–4). One motivation is a desire to respond to women's questions about when they will be “done”, at least with irregular menses (2, 3). A novel impetus is the realization that potentially deleterious changes, such as accelerated bone loss and unfavorable changes in cardiovascular risk indicators, precede the FMP by at least a year (5, 6).
Rapid bone loss begins well before the FMP (6–8). During the transmenopause (1 year before through 2 years after FMP), spine bone mineral density (BMD) loss averages 2.46% yearly; it diminishes to 1.06% annually between 2 and 5 years after the FMP (6). Correspondingly, histomorphometry and 3-dimensional microcomputed tomography demonstrate that the transmenopause is accompanied by a reduction in trabecular number, enlargement of trabecular spacing, and conversion of trabecular plates to rods, conceivably signaling irreparable microarchitectural damage and increased fracture risk, independent of areal BMD (7, 9). Some investigators posit that transmenopause represents a time-limited opportunity to prevent rapid bone loss and permanent structural damage, giving rise to the proposal that short-term antiresorptive therapy could be a highly efficient and beneficial intervention (10). However, this thesis remains untested, and to test it, we must first be able to predict, with reasonable confidence, that a woman's FMP is about 1 year distant, the time when bone loss accelerates.
Serum FSH and urinary N-telopeptide (NTx) increase sharply whereas serum estradiol (E2) moves in the opposite direction 2 years before the FMP, about a year before rapid bone loss starts (11–14). Because changes in FSH, NTx, or E2 precede onset of bone loss, it may be possible to use them to establish that a woman has reached the landmark of 1 year before FMP.
Using longitudinal data from the Study of Women's Health Across the Nation (SWAN), we designed an analysis to determine whether measurements of FSH, E2, or NTx, or combinations thereof, could predict where an individual was on her timeline to the FMP. The models use 1 current measurement and 1 past (reference) measurement obtained at a younger age to estimate probabilities of having crossed landmarks on the timeline to the FMP. This information could be used to respond to the following 2 questions: “How much longer will my menopause transition last?” and “Am I starting to lose bone?” An answer to the latter may also pave the way toward testing interventions designed to prevent rapid bone loss and architectural deterioration.
Materials and Methods
Sample derivation
Participants are from SWAN, a multisite, multiethnic longitudinal study designed to characterize the menopause transition (MT) in a community-based cohort (15). Briefly, eligibility criteria were age 42–52 years, intact uterus and at least 1 ovary, not using medications that affect ovarian function, not pregnant or lactating, had at least 1 menstrual period in the 3 months before screening, and being a member of 1 of 5 ethnic groups: Caucasian, African-American, Hispanic, Chinese, or Japanese. We used data from annual visits occurring between SWAN baseline (1996–1997) and follow-up visit 10 (2006–2007). Analysis inclusion criteria were documented natural FMP, at least 1 reference measurement (≥2 years before FMP) of the candidate markers (FSH, E2, or NTx) used to predict the outcome, at least 1 postreference measurement made at least 2 years before the FMP, and at least 1 measurement of the marker between 2 years before and 1 year after the FMP. Exclusions were use of medications that affect menstruation or endogenous hormones. Only observations up to 1 year after the FMP (clinical postmenopause) were analyzed. Institutional Review Board approvals were obtained, and participants gave written informed consent.
Primary exposures
Serum was obtained annually. Venipuncture was scheduled between 8:00 and 10:00 am after a 12-hour fast and, in women who were not postmenopausal, during the early follicular phase (cycle days 2–5, termed “in window”). Duplicate E2 and single FSH assays were conducted as reported (16). E2 inter- and intra-assay coefficients of variation averaged 10.6% and 6.4%, respectively. FSH inter- and intra-assay coefficients of variation were 12.0% and 6.0%, respectively (16). Lower limits of detection were from <1.0 to <7.0 pg/mL for E2 and <0.4 to <1.05 mIU/mL for FSH. Because FSH and E2 increase with advancing menstrual cycle day, levels that were not obtained in window when women were premenopausal or early perimenopausal were set to missing (17). During late perimenopause, most samples (93.8%) were not obtainable in window; therefore, an indicator for in window was modeled. At 5 sites, a second-voided morning urine was obtained for NTx assay (18). NTx is expressed as nanomolar bone collagen equivalents (BCE) per millimolar of urine creatinine (nM BCE/mM creatinine); lower limit of detection was 10 nM, and inter- and intra-assay coefficients of variation were 4.8% and 2.75%, respectively. To minimize diurnal variation, collection time was included as a covariate (19). For each of the 3 candidate predictors, the first measurement was the person-specific reference.
Covariates
Age (years), current smoking (yes vs no), and menstrual bleeding patterns were assessed annually. MT categories, based on each previous year, were premenopausal (no change in cycle interval), early perimenopausal (change in interval but no gaps of ≥3 months), late perimenopause (no menses for 3–11 months), and postmenopausal (≥12 consecutive months of amenorrhea). FMP date was defined as the last menstrual bleeding date reported during the visit immediately before the first visit when the participant was classified as postmenopausal. Height and weight were measured annually, and body mass index (BMI) was calculated.
Data analysis
For analyses using E2 and FSH, the sample consisted of 3068 observations in 554 women: 275 Caucasian, 134 African-American, 71 Chinese, and 74 Japanese. Because NTx was obtained at 5 sites, the NTx sample consisted of 2499 observations from 472 women. Missing values for weight or height occurred in 43 observations (1.7%), and 24 observations (1.0%) were missing smoking. These were imputed (20).
The 2 objectives were to estimate, based on each participant's current and previous values of the candidate predictors 1) whether she had crossed 1 of 3 landmark dates (2 years before FMP, 1 year before FMP, or the FMP) and 2) whether she was in 1 of 3 narrower time intervals (2 years through 1 year before FMP, 2 years before FMP and FMP, or 1 year before FMP and FMP). Primary predictors were changes in levels of E2, FSH, or NTx from person-specific reference values. For E2 and FSH, 87.5% of reference values were measured at SWAN baseline, and 97.7% of NTx levels were measured at baseline. We used modified Poisson regression with robust error variance estimation because the outcome is not rare (21). Generalized estimating equations were used to account for within-woman correlations (22).
We used a 3-stage strategy: 1) determine the candidate marker (E2, FSH, or NTx) or combination that best predicted having crossed each of the 3 landmarks, with optimum defined as the largest area under the receiver-operator curve (AUC); 2) create parsimonious models using backward selection; and 3) use stage 2 models to create prediction formulas for the probability of having crossed each of 3 landmarks and calculate sensitivity and specificity at varied probability thresholds.
In stage 1, we examined prediction of having crossed landmarks based on NTx only, reproductive hormones only, and then all 3 candidates with and without covariates. Covariates were time varying, measured at the same time as the primary predictors, and included age (continuous), MT stage, race/ethnicity, in-window serum collection (yes/no), BMI (BMI < 22; 22 ≤ BMI < 25; 25 ≤ BMI < 30; BMI ≥ 30), and current smoking (yes/no).
In stage 2, we refined the model with FSH and E2 (not NTx, because it did not improve prediction). Full models included changes in log-transformed values of the hormones, the same set of covariates as in stage 1, and interactions. Interaction terms were each hormone and “in-window” (during late perimenopause only) and each hormone and MT stage. We next used backward selection based on P values, and AUCs were computed. Final models were used to create prediction formulas for the probability of a woman having crossed each of 3 landmarks.
In stage 3, we assessed performance of the prediction formulas, graphically and quantitatively. Predicted probabilities for having crossed each of the 3 landmarks at the time of each follow-up were plotted against time relative to FMP (actual dates). Sensitivity and specificity of each formula were computed at various thresholds of predicted probability that a woman had crossed each landmark.
Results
Characteristics of participants are summarized in Table 1. Those who had measurements of all 3 candidate predictors (FSH, E2, and NTx) constituted a smaller sample of 472 women. They were similar to the larger sample of 554 women who had assessments of E2 and FSH only.
Table 1.
Demographic, Behavioral, Anthropometric, and MT Stage Characteristics of SWAN Participants in the Current Analysisa
| Participant Characteristics at SWAN Cohort Baseline | Analysis Sample With E2, FSH, and NTx Measurements (n = 472) | Analysis Sample With E2 and FSH Measurements (n = 554) |
|---|---|---|
| Categorical variables, % | ||
| MT stage | ||
| Premenopausal | 50.5 | 50.2 |
| Early perimenopausal | 49.5 | 49.8 |
| Race/ethnicity | ||
| African-American | 20.6 | 24.2 |
| Caucasian | 48.7 | 49.6 |
| Chinese | 15.0 | 12.8 |
| Japanese | 15.7 | 13.4 |
| Current cigarette use | 12.6 | 12.8 |
| BMI, kg/m2 | ||
| <22 | 31.9 | 30.5 |
| 22 ≤ BMI < 25 | 26.1 | 25.9 |
| 25 ≤ BMI < 30 | 19.9 | 20.8 |
| ≥30 | 22.1 | 22.8 |
| Continuous variable, mean (sd) | ||
| Age, y | 45.6 (2.7) | 45.6 (2.7) |
We used data from SWAN annual visits spanning SWAN baseline (1996–1997) and follow-up visit 10 (2006–2007). Inclusion criteria for this study were having had a natural FMP; at least 1 reference measurement of the candidate prediction markers (FSH, E2, or NTx), defined as a measure made more than 2 years before the FMP; at least 1 postreference measurement made at least 2 years before the FMP; and at least 1 measurement of the marker that took place in the time interval between 2 years before and 1 year after the FMP. Exclusion criteria were use of medications at any time before the FMP that may affect menstruation or endogenous hormone levels. Values are from the SWAN cohort baseline, the time at which most women entered into the analysis. The reference (first values) of E2 and FSH were taken at the SWAN cohort baseline in 87.5% of women. For NTx, 97.7% of initial levels came from the cohort baseline. The sample in which all 3 candidate markers (E2, FSH, and NTx) were measured was smaller than the sample that had E2 and FSH measured, because only 5 of the 7 SWAN clinical sites obtained urinary samples for NTx (see Materials and Methods for details).
In the larger sample that did not have NTx measurements, there were 2514 observations (excluding reference observations) in 554 participants (Table 2). The median number of observations per woman was 4 (interquartile range [IQR], 3–6). The median reference value of E2 was 56.7 pg/mL (IQR, 32.8–81.3), and the median reference FSH value was 15.4 mIU/mL (IQR, 11.7–22.1). In the smaller sample, the median NTx reference value was 29.6 nM BCE/mM creatinine (IQR, 22.1–38.3). The remainder of the values displayed in Table 2 emanate from the larger sample. The ratio of current FSH to the reference value became larger, whereas the ratio of current E2 to its reference value became smaller as the women approached and crossed the FMP date. The magnitude of the change in the FSH ratio was substantially larger than that of the E2 ratio or the NTx ratio.
Table 2.
Mean or Median Values of Candidate Predictor Variables at Initial Measurement and at Each Time Interval of Follow-upa
| Participant Characteristics and Biomarker Level | Time at Which Observations Were Made |
||||
|---|---|---|---|---|---|
| Referenceb | ≥2 y Before FMP | Between 2 and 1 y Before FMP | Between 1 y Before FMP and FMP | Between FMP and 1 y After FMP | |
| Sample size | 554 | 1390 | 376 | 324 | 424 |
| Age, y | 46.3 (2.4) | 48.4 (2.4) | 50.8 (2.3) | 51.8 (2.2) | 52.8 (2.3) |
| Initial FSH level, IU/L | 15.4 (11.7, 22.1) | ||||
| Initial E2 level, pg/mL | 56.7 (32.8, 81.3) | ||||
| FSH ratio | 1.19 (0.81–1.84) | 1.75 (1.03–2.98) | 2.54 (1.39–4.53) | 5.03 (3.03–7.74) | |
| E2 ratio | 0.86 (0.47–1.46) | 0.78 (0.40–1.69) | 0.68 (0.36–1.57) | 0.41 (0.21–0.83) | |
| Log(FSH ratio) | 0.20 (0.70) | 0.52 (0.88) | 0.90 (0.87) | 1.57 (0.75) | |
| Log(E2 ratio) | −0.15 (0.97) | −0.14 (1.22) | −0.28 (1.20) | −0.85 (1.10) | |
| MT stage | |||||
| Premenopause | 332 (64.2%) | 322 (23.2%) | 28 (7.5%) | 4 (1.2%) | 1 (0.2%) |
| Early perimenopause | 185 (35.8%) | 1031 (74.2%) | 267 (71.0%) | 154 (47.5%) | 35 (8.3%) |
| Late perimenopause | 37 (2.7%) | 81 (21.5%) | 166 (51.2%) | 388 (91.5%) | |
| In-windowc | 554 (100%) | 1362 (98.0%) | 306 (81.4%) | 172 (53.1%) | 44 (10.4%) |
| Smoking | 66 (12.8%) | 154 (11.2%) | 32 (8.6%) | 44 (13.8%) | 39 (9.2%) |
| BMI, kg/m2 | |||||
| <22 | 125 (24.5%) | 310 (22.7%) | 82 (22.1%) | 52 (16.3%) | 78 (18.8%) |
| 22 ≤ BMI < 25 | 130 (25.4%) | 327 (23.9%) | 89 (24.0%) | 79 (24.7%) | 94 (22.7%) |
| 25 ≤ BMI < 30 | 115 (22.5%) | 354 (25.9%) | 91 (24.5%) | 80 (25.0%) | 100 (24.2%) |
| ≥30 | 141 (27.6%) | 375 (27.5%) | 109 (29.4%) | 109 (34.1%) | 142 (34.3%) |
| Initial NTx, nM BCE/mM creatinine | 29.6 (22.1–38.3) | ||||
| NTx ratio | 1.02 (0.78–1.32) | 1.08 (0.81–1.48) | 1.10 (0.84–1.52) | 1.38 (0.98–1.95) | |
| Log(NTx ratio) | 0.01 (0.47) | 0.06 (0.49) | 0.11 (0.48) | 0.33 (0.47) | |
With the exception of NTx, values are from the 554 participants who had FSH and E2 levels assessed because this larger sample was used to derive the final models. Each woman contributed data for at least 2 observation times. The NTx values are from the subset of women (n = 472) who had all 3 candidate predictors (FSH, E2, and NTx) measured; mean or median values of the variables shown did not differ between the larger and the smaller analysis samples (data not shown). Means and SDs are shown for continuous variables; numbers and percentages are provided for categorical variables; for the ratios of predictors, medians and IQRs are given.
Reference value is the earliest value obtained at a time point greater than 2 years before the FMP. FSH, E2, and NTx ratios are computed as current value divided by the reference measurement.
In-window indicates whether the sample was collected between days 2 to 5 of the menstrual cycle and applies only to observations made during late perimenopause; in earlier MT stages, observations made outside this window were not used (see Materials and Methods for details).
We compared the ability of 5 increasingly large models to estimate the probability that a woman had crossed 2 years before FMP, 1 year before FMP, and the FMP. Predictive capacity was quantified with AUCs; higher values indicate better prediction. Considering FSH, E2, or NTx, without any additional covariates, the model with E2 and FSH was better than that with NTx alone (Figure 1). The addition of NTx to the E2 and FSH model only minimally improved the prediction; AUCs were 0.778, 0.822, and 0.863 for models of crossing 2 years before FMP, 1 year before FMP, and the FMP, respectively.
Figure 1.
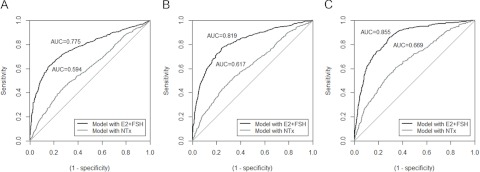
Receiver operating characteristic curves for candidate models to predict that participants have crossed each of 3 landmark dates: 2 years before the FMP (A), 1 year before the FMP (B), or the FMP date (C). For each of FSH, E2, and NTx, the log of the ratio of value at the current visit to reference value was used as predictor.
Because NTx contributed minimal additional prediction to the models containing FSH and E2, Poisson models for having crossed landmark dates were refined using the larger sample with E2 and FSH measurements. Final model results are shown in Table 3. In addition to the variables and interaction terms shown, the model initially included race/ethnicity, time-varying values of current smoking and BMI, and interaction terms between log(FSH ratio) and MT stages and log(E2 ratio) and in-window; these did not remain in the model after backward selection. The AUCs for the final models that predicted the probability of a woman having crossed 2 years before FMP, 1 year before FMP, and the FMP were 0.902, 0.926, and 0.945, respectively.
Table 3.
Results of a Multivariable Model Consisting of Repeated Measures of FSH, E2, and Covariates to Predict Whether a Woman Has Crossed Each of 3 Landmark Dates: 2 Years Before the FMP, 1 Year Before the FMP, or the FMP Datea
| Predictor Variablesb | Multivariable Probability Ratios of Having Crossed Each Landmark Datec |
|||||
|---|---|---|---|---|---|---|
| 2 y Before the FMP (AUC = 0.902) |
1 y Before the FMP (AUC = 0.926) |
FMP Date (AUC = 0.945) |
||||
| P Ratio (95% CI) | P | P Ratio (95% CI) | P | P Ratio (95% CI) | P | |
| Log(FSH ratio) | 0.077 (0.015, 0.139) | .015 | 0.22 (0.15, 0.30) | <.001 | 0.33 (0.25, 0.41) | <.001 |
| Log(FSH ratio) × in-windowd | 0.46 (0.34, 0.58) | <.001 | 0.53 (0.37, 0.68) | <.001 | 0.89 (0.55, 1.23) | <.001 |
| Log(E2 ratio) | −0.51 (−0.77, −0.24) | <.001 | 0.097 (0.044, 0.150) | <.001 | ||
| Log(E2 ratio) × early perimenopause | 0.78 (0.51, 1.04) | <.001 | ||||
| Log(E2 ratio) × late perimenopause | 0.55 (0.28, 0.82) | <.001 | ||||
| Age (per year) | 0.12 (0.10, 0.14) | <.001 | 0.12 (0.10, 0.14) | <.001 | 0.10 (0.07, 0.13) | <.001 |
| In-window | −0.36 (−0.61, −0.12) | .004 | −0.65 (−0.96, −0.33) | <.001 | −1.69 (−2.39, −1.00) | <.001 |
| Early perimenopause | 1.42 (1.01, 1.83) | <.001 | 1.96 (1.10, 2.81) | <.001 | 1.85 (−0.12, 3.83) | .06 |
| Late perimenopause | 1.95 (1.49, 2.40) | <.001 | 2.97 (2.07, 3.87) | <.001 | 3.46 (1.42, 5.49) | <.001 |
This model was constructed in the sample of 554 participants who had FSH and E2 levels assessed because NTx did not add to capacity to predict landmark dates. In addition to the variables and interaction terms shown, the model initially included race/ethnicity, time-varying values of current smoking and BMI, and interaction terms between log(FSH ratio) and MT stages and log(E2 ratio) and in-window; these terms did not remain in the model after backward selection.
For FSH and E2, log of the ratio of value at the current visit to reference value was used as a predictor. Referent for MT stages is premenopause.
Having crossed each landmark date means that the individual could be at any time point subsequent to that landmark date. Prediction equations are as follows: Probability of having crossed 2 years before FMP = 0.0002 × (FSH ratio)0.077 × [(FSH ratio) × window]0.46 × (E2 ratio)−0.51 × [(E2 ratio) × early perimenopause]0.78 × [(E2 ratio) × early perimenopause]0.78 × 1.13age × 0.70window × 4.13early-perimenopause × 7.0late-perimenopause; probability of having crossed 1 year before FMP = 6.32 × 10⁻⁵ × (FSH ratio)0.22 × [(FSH ratio) × window]0.53 × (E2 ratio)0.097 × 1.13age × 0.52window × 7.09early-perimenopause × 19.4late-perimenopause; and probability of having crossed FMP = 5.68 × 10⁻⁵ × (FSH ratio)0.33 × [(FSH ratio) × window]0.89 × 1.11age × 0.18window × 6.37early-perimenopause × 31.6late-perimenopause.
In-window indicates whether the serum was collected during days 2 to 5 of a menstrual cycle and pertains to late perimenopausal samples only (see Materials and Methods for details).
Using the prediction formulas derived from the final models (Table 3), model-predicted probabilities of having crossed the 3 landmarks were computed at each visit for each participant. We expected the predicted probabilities would be low at visits before the actual landmark date and high at visits that came after the participant had actually crossed the landmark. To test this, we averaged the predicted probabilities over women who were at similar points on the timeline and examined these means as a function of actual time to/after the FMP (Figure 2). As expected, the sample mean of the predicted probabilities of crossing each of the 3 landmarks increased monotonically as women progressed further along the timeline, so that predicted probabilities (y-axis) were higher after each landmark (x-axis) than before it. For example, the predicted probability of having crossed the FMP minus 2 years landmark increased from just under 0.2 at FMP minus 5 years to just under 0.4 at FMP minus 2 years to a bit under 0.6 at FMP minus 1 year to 0.85 at the FMP. Similarly, the predicted probability of having crossed the FMP minus 1 year landmark went above 0.35 after women actually crossed it, and the predicted probability of having crossed the FMP went above 0.45 after women actually crossed it. This illustrates that a woman can be classified as having crossed an FMP-related landmark if her model-predicted probability of having crossed it is higher than an appropriately chosen threshold.
Figure 2.
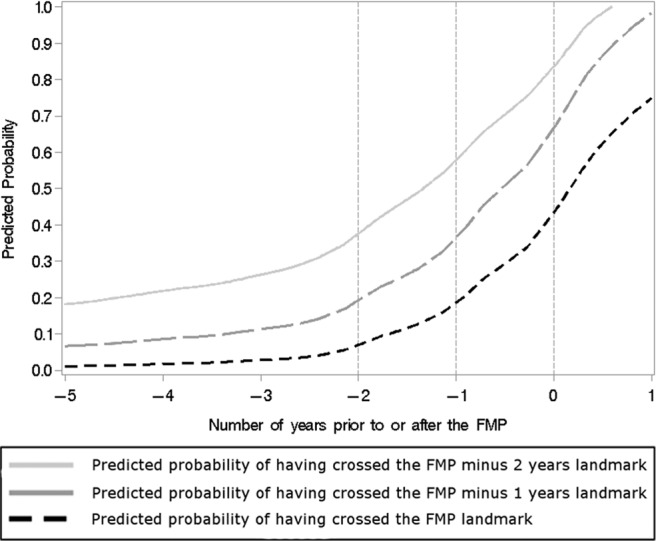
Sample means of predicted probabilities of having crossed each of 3 landmark dates relative to the FMP as a function of actual time of observation (relative to the FMP).
Table 4 presents the sensitivities and specificities with which a woman can be classified as having crossed each landmark by comparing her model-predicted probabilities against a range of thresholds, ranging from 0.3 to 0.6. For example, if we use P > 0.3 as the criterion to classify a woman as having crossed a landmark, we achieve sensitivity of 85% and specificity of 77% for the 2 years before FMP landmark and sensitivity of 89% and specificity of 90% for the FMP date. Using a higher threshold for model-predicted probability would achieve greater specificity at the expense of lower sensitivity.
Table 4.
Sensitivity and Specificity of Landmark-Crossing Classification, Based on Comparing Model-Predicted Probabilities Against Varying Thresholdsa
| Probability Thresholds Used for Classification | Sensitivity and Specificity of Classification as Having Crossed Each Landmark Dateb |
|||||
|---|---|---|---|---|---|---|
| 2 y Before the FMP |
1 y Before the FMP |
FMP |
||||
| Sensitivity, % | Specificity, % | Sensitivity, % | Specificity, % | Sensitivity, % | Specificity, % | |
| 0.3 | 85 | 77 | 80 | 92 | 89 | 90 |
| 0.4 | 75 | 89 | 75 | 95 | 84 | 92 |
| 0.5 | 67 | 96 | 72 | 96 | 70 | 94 |
| 0.6 | 59 | 98 | 62 | 97 | 52 | 97 |
The predicted probabilities are computed using the formulas presented in Table 3.
Classified as having crossed the landmark date if the model-predicted probabilities exceed the threshold in column 1.
Having crossed a landmark means that at the time of measurement a woman could be beyond that landmark. However, a woman can be classified as having crossed one landmark and not having crossed a later landmark, which localizes her to the interval between 2 landmarks. The entries in Table 4 also provide the sensitivities and specificities with which a woman can be classified as not having crossed the landmarks, but with the roles of sensitivity and specificity switched. Thus, for example, if we used P < 0.3 as the criterion to classify a woman as not having crossed a later landmark, we would achieve sensitivity of 92% and specificity of 80% for not having crossed the 1 year before FMP landmark and sensitivity of 90% and specificity of 89% for not having crossed the FMP landmark.
Discussion
To discern whether women had crossed selected landmarks on the timeline to becoming postmenopausal, we created a multivariable model based mainly on 1 current and 1 previous serum level of E2 and FSH. The model's discrimination, its ability to correctly rank women according to whether or not they had crossed a landmark, was excellent; AUCs for having crossed each landmark were 0.894 or greater.
Although these AUC values are excellent, they are insufficient indicators of clinical usefulness; sensitivity and specificity at candidate “diagnostic” thresholds must be assessed (23). AUC measures performance of a classifier over all possible threshold values of a continuous score. When a continuous score is used for classification, the result is rated as positive (ie, has crossed) or negative (has not crossed) based on whether the score (the probability of having crossed the date, calculated by our model) is greater than a specified threshold. Each threshold has an associated sensitivity (probability of correctly classifying those who have crossed) and specificity (probability of correctly classifying those who have not) (24, 25).
Determining whether a woman has crossed a specific landmark responds to the question, “How much longer will my MT last?” Having crossed 2 years before FMP means that a woman could be just after 2 years before FMP and up to 1 year after it; maximum time remaining until she reached clinical postmenopause would be 3 years. We demonstrated that classification of a woman as having crossed an FMP-related landmark can be done with high sensitivity and specificity. Optimum selection of sensitivity and specificity depend on the costs of incorrect classification; these costs depend on the clinical or research scenario and personal preferences (26).
Previous attempts at predicting when the FMP date were inspired by the desire to help women know what's in store as well as to describe factors that influence timing of menopause (1–4). Studies used a variety of designs, exposures, and modeling, each distinct from those used herein. The Melbourne Women's Midlife Health Project concentrated on longitudinally assessed menstrual cycle variability as the predictor of FMP and formulated the running range (the difference between the woman's longest and shortest cycle to date) (1). Among women who were at least 45 years old and who experienced a running range of 6 weeks, there was a 50% probability that they would have 10 additional menstrual cycles (2). Adding an FSH value and an indicator of whether the woman sensed she was in transition refined prediction (1). Using one-time premenopause or early perimenopausal measures of exposures, SWAN constructed survival curves that gauged time to FMP; factors retained in the model were age, education, current smoking, race/ethnicity, vasomotor symptoms, recalled cycle characteristics, E2, and FSH (3). Limiting predictors to age, bleeding regularity, smoking, and hormone levels, SWAN′s survival model estimated median times to FMP of >5 years to within 1 year. Anti-Mullerian hormone (AMH) has been added to the slate of candidate FMP predictors; premenopausal AMH is strongly related to time to FMP (4, 27, 28). For example, in the Penn Ovarian Aging Study, the median number of years until FMP in women aged 40 to 44 years at baseline ranged between 12.5 years for the highest to 8 years for the lowest quartile AMH (4).
The clinical applicability of methods to estimate time to FMP is a function of feasibility, lead time, and the degree of certainty required. The running range's reliance on menstrual diaries can be a merit (inexpensive) or detriment (difficult to maintain). The survival models required a clinic visit for baseline blood sampling during premenopause or early perimenopause (3, 4). Their long lead time between ascertainment of the exposures to the FMP may make them best suited to reproductive planning. The repeated-hormone method employed here also requires that women have an E2 and FSH early in the transition because a reference sample is required. An attribute of this repeated-hormone strategy is that it classifies participants' temporal positions based on a within-woman change in hormone measurements rather than by comparing levels with a population-based standard. Analogous to the impact of chosen probability threshold on the sensitivity and specificity of our prediction model, survival models will give different estimates of time to FMP depending on the stipulated probability that the FMP has occurred. For example, whether one chooses to estimate median time to menopause (a probability of 50%) or the time at which 90% of women have done so will yield distinctive results (3, 4).
Our second research goal, identifying that a woman is early in the transmenopause (motivated by our previous SWAN findings that bone loss commences 1 year before the FMP or 2 years before clinically diagnosed menopause) requires the ability to classify an observation as having been made between 2 years and 1 year before FMP, because this time frame corresponds to the time of onset of rapid bone loss (6). We demonstrated how such a classification can be made using the predicted probabilities of having crossed as well as not having crossed the landmarks. Reasonably high sensitivity and specificity could be achieved for this more stringent classification as well. If the proposed bone loss prevention strategy were not hazardous, it would be best to optimize the test's sensitivity, so that the time at which bone loss begins would not be missed (6).
To our knowledge, no studies have articulated the goal of discerning whether a woman has reached 1 year before FMP, the time at which we previously found that rapid bone loss begins (6). Although SWAN (29) and other studies (30) document that rates of bone loss are greater in late perimenopause than they are in premenopause or early perimenopause, menstrually defined late perimenopause is a poor signal of the time remaining until the FMP (6). In SWAN, in the year before the FMP, 70% of women were still early perimenopausal and only 30% were late perimenopausal (6). It is logical to assume that the early in “early perimenopausal” means just that. But 60% of early perimenopausal women become postmenopausal with no additional clinical bleeding signal (ie, without gaps in cycles).
Strengths and novel aspects of this study are use of repeated measures and quantification of the sensitivity and specificity of model-derived classification for a range of classifier thresholds. Because sensitivity and specificity were presented for a range of thresholds, the user can assign the preferred level of certainty that designates the test as positive and then assess performance characteristics at that certainty. Additional merits are the community-based sample incorporating 4 ethnic/racial backgrounds, annual assessment of medications and bleeding patterns, and longitudinal assays of biomarkers by single laboratory.
Limitations of this study include that it required unequivocal FMP dates, resulting in a reduction in sample size; importantly, women who have had unequivocal FMPs by follow-up visit 10 do not constitute a biased sample (5). Second, we sampled hormones annually; more frequent sampling may have allowed more precise estimation of location on the timeline (31). Whether our method of hormone sampling could be implemented in clinical practice also remains to be seen, but it appears plausible. At SWAN baseline, participants were premenopausal or early perimenopausal and aged 42–52 years when their first sample was taken. The second measurement was acquired at any subsequent time, as long as menstruation had not stopped for 12 months. Model replication in an independent sample is necessary before clinical use; once validated, user-friendly web-based calculators could be developed.
Acknowledgments
We thank the study staff at each site and all the women who participated in SWAN.
The SWAN has grant support from the National Institutes of Health (NIH), Department of Health and Human Services, through the National Institute on Aging (NIA), the National Institute of Nursing Research (NINR) and the NIH Office of Research on Women's Health (ORWH) (Grants NR004061, AG012505, AG012535, AG012531, AG012539, AG012546, AG012553, AG012554, and AG012495). The content of this manuscript is solely the responsibility of the authors and does not necessarily represent the official views of the NIA, NINR, ORWH, or the NIH.
Clinical centers included University of Michigan, Ann Arbor, MI (Siobán Harlow, PI 2011, MaryFran Sowers, PI 1994–2011); Massachusetts General Hospital, Boston, MA (Joel Finkelstein, PI 1999 to present; Robert Neer, PI 1994–1999); Rush University, Rush University Medical Center, Chicago, IL (Howard Kravitz, PI 2009 to present; Lynda Powell, PI 1994–2009); University of California, Davis/Kaiser, Davis, CA (Ellen Gold, PI); University of California, Los Angeles, CA (Gail Greendale, PI); Albert Einstein College of Medicine, Bronx, NY (Carol Derby, PI 2011; Rachel Wildman, PI 2010–2011; Nanette Santoro, PI 2004–2010); University of Medicine and Dentistry–New Jersey Medical School, Newark, NJ (Gerson Weiss, PI 1994–2004); and the University of Pittsburgh, Pittsburgh, PA (Karen Matthews, PI). The NIH Program Office was at the National Institute on Aging, Bethesda, MD (Winifred Rossi, 2012–present; Sherry Sherman, 1994–2012; Marcia Ory, 1994–2001) and NINR, Bethesda, MD (Program Officers). The central laboratory was at the University of Michigan, Ann Arbor, MI (Daniel McConnell, Central Ligand Assay Satellite Services). The coordinating center was at the University of Pittsburgh, Pittsburgh, PA (Maria Mori Brooks, PI, 2012–present; Kim Sutton-Tyrrell, Co-PI, 2001–2012) and New England Research Institutes, Watertown, MA (Sonja McKinlay, PI 1995–2001). The steering committee included Susan Johnson, current chair, and Chris Gallagher, former chair.
Disclosure Summary: The authors have nothing to disclose.
Footnotes
- AMH
- anti-Mullerian hormone
- AUC
- area under the receiver-operator curve
- BCE
- bone collagen equivalents
- BMD
- bone mineral density
- BMI
- body mass index
- E2
- estradiol
- FMP
- final menstrual period
- IQR
- interquartile range
- MT
- menopause transition
- NTx
- N-telopeptide
- SWAN
- Study of Women's Health Across the Nation.
References
- 1. Taffe J, Dennerstein L. Time to the final menstrual period. Fertil Steril. 2002;78:397–403 [DOI] [PubMed] [Google Scholar]
- 2. Taffe JR, Dennerstein L. Menstrual patterns leading to the final menstrual period. Menopause. 2002;9:32–40 [DOI] [PubMed] [Google Scholar]
- 3. Santoro N, Brockwell S, Johnston J, et al. Helping midlife women predict the onset of the final menses: SWAN, the Study of Women's Health Across the Nation. Menopause. 2007;14:415–424 [DOI] [PubMed] [Google Scholar]
- 4. Freeman EW, Sammel MD, Lin H, Gracia CR. Anti-Mullerian hormone as a predictor of time to menopause in late reproductive age women. J Clin Endocrinol Metab. 2012;97:1673–1680 [DOI] [PMC free article] [PubMed] [Google Scholar]
- 5. Matthews KA, Crawford SL, Chae CU, et al. Are changes in cardiovascular disease risk factors in midlife women due to chronological aging or to the menopausal transition? J Am Coll Cardiol. 2009;54:2366–2373 [DOI] [PMC free article] [PubMed] [Google Scholar]
- 6. Greendale GA, Sowers M, Han W, et al. 2012 Bone mineral density loss in relation to the final menstrual period in a multi-ethnic cohort: results from the study of women's health across the nation (SWAN). J Bone Miner Res. 27:111–118 [DOI] [PMC free article] [PubMed] [Google Scholar]
- 7. Recker R, Lappe J, Davies KM, Heaney R. Bone remodeling increases substantially in the years after menopause and remains increased in older osteoporosis patients. J Bone Miner Res. 2004;19:1628–1633 [DOI] [PubMed] [Google Scholar]
- 8. Sowers MR, Zheng H, Jannausch ML, et al. Amount of bone loss in relation to time around the final menstrual period and follicle-stimulating hormone staging of the transmenopause. J Clin Endocrinol Metab. 2010;95:2155–2162 [DOI] [PMC free article] [PubMed] [Google Scholar]
- 9. Akhter MP, Lappe JM, Davies KM, Recker RR. Transmenopausal changes in the trabecular bone structure. Bone. 2007;41:111–116 [DOI] [PubMed] [Google Scholar]
- 10. Zaidi M, Turner CH, Canalis E, et al. Bone loss or lost bone: rationale and recommendations for the diagnosis and treatment of early postmenopausal bone loss. Curr Osteoporos Rep. 2009;7:118–126 [DOI] [PubMed] [Google Scholar]
- 11. Randolph JF, Jr, Zheng H, Sowers MR, et al. Change in follicle-stimulating hormone and estradiol across the menopausal transition: effect of age at the final menstrual period. J Clin Endocrinol Metab. 96:746–754 [DOI] [PMC free article] [PubMed] [Google Scholar]
- 12. Burger HG, Dudley EC, Hopper JL, et al. Prospectively measured levels of serum follicle-stimulating hormone, estradiol, and the dimeric inhibins during the menopausal transition in a population-based cohort of women. J Clin Endocrinol Metab. 1999;84:4025–4030 [DOI] [PubMed] [Google Scholar]
- 13. Sowers MR, Zheng H, McConnell D, Nan B, Harlow S, Randolph JF., Jr Follicle stimulating hormone and its rate of change in defining menopause transition stages. J Clin Endocrinol Metab. 2008;93:3958–3964 [DOI] [PMC free article] [PubMed] [Google Scholar]
- 14. Sowers MF, Zheng H, Cauley J, Greendale GA, Lo J, Finkelstein J. Increased bone turnover (N-telopeptides) across the menopause transition: Study of Women's Health Across the Nation (SWAN). Bethesda, Maryland: Program of the ASBMR Forum on Aging and Skeletal Health; 2011, p. 33 [Google Scholar]
- 15. Sowers M, Crawford SL, Sternfeld B, et al. 2000. Design, Survey, Sampling and Recruitment Methods of SWAN: A Multi-Center, Multi-Ethnic, Community Based Cohort Study of Women and the Menopausal Transition. San Diego, CA: Academic Press [Google Scholar]
- 16. Sowers MR, Jannausch M, McConnell D, et al. Hormone predictors of bone mineral density changes during the menopausal transition. J Clin Endocrinol Metab. 2006;91:1261–1267 [DOI] [PubMed] [Google Scholar]
- 17. Stricker R, Eberhart R, Chevailler MC, Quinn FA, Bischof P, Stricker R. Establishment of detailed reference values for luteinizing hormone, follicle stimulating hormone, estradiol, and progesterone during different phases of the menstrual cycle on the Abbott ARCHITECT analyzer. Clin Chem Lab Med. 2006;44:883–887 [DOI] [PubMed] [Google Scholar]
- 18. Cauley JA, Danielson ME, Greendale GA, et al. Bone resorption and fracture across the menopausal transition: the Study of Women's Health Across the Nation. Menopause. 2012:19:1200–1207 [DOI] [PMC free article] [PubMed] [Google Scholar]
- 19. Hannon R, Eastell R. Preanalytical variability of biochemical markers of bone turnover. Osteoporos Int. 2000;11(Suppl 6):S30–S44 [DOI] [PubMed] [Google Scholar]
- 20. Graham JW. Missing data analysis: making it work in the real world. Annu Rev Psychol. 2009;60:549–576 [DOI] [PubMed] [Google Scholar]
- 21. Nurminen M. To use or not to use the odds ratio in epidemiologic analyses? Eur J Epidemiol. 1995;11:365–371 [DOI] [PubMed] [Google Scholar]
- 22. Liang KY, Zeger SL. Longitudinal data analysis using generalized linear models. Biometrika. 1986;73:13–22 [Google Scholar]
- 23. Homer DW, Lemeshow S. 2000. Applied Logistic Regression. 2nd ed New York, NY: John Wiley, Sons [Google Scholar]
- 24. Hanley JA, McNeil BJ. The meaning and use of the area under a receiver operating characteristic (ROC) curve. Radiology. 1982;143:29–36 [DOI] [PubMed] [Google Scholar]
- 25. Faraggi D, Reiser B. Estimation of the area under the ROC curve. Stat Med. 2002;21:3093–3106 [DOI] [PubMed] [Google Scholar]
- 26. Brown CD, Davis HT. Receiver operating characteristics curves and related decision measures: a tutorial. Chemometrics Intelligent Lab Syst. 2006;80:24–38 [Google Scholar]
- 27. Broer SL, Eijkemans MJ, Scheffer GJ, et al. Anti-Mullerian hormone predicts menopause: a long-term follow-up study in normoovulatory women. J Clin Endocrinol Metab. 2011;96:2532–2539 [DOI] [PubMed] [Google Scholar]
- 28. Tehrani FR, Shakeri N, Solaymani-Dodaran M, Azizi F. Predicting age at menopause from serum antimullerian hormone concentration. Menopause. 2011;18:766–770 [DOI] [PubMed] [Google Scholar]
- 29. Finkelstein JS, Brockwell SE, Mehta V, et al. Bone mineral density changes during the menopause transition in a multiethnic cohort of women. J Clin Endocrinol Metab. 2008;93:861–868 [DOI] [PMC free article] [PubMed] [Google Scholar]
- 30. Lo JC, Burnett-Bowie SA, Finkelstein JS. Bone and the perimenopause. Obstet Gynecol Clin North Am. 2011;38:503–517 [DOI] [PMC free article] [PubMed] [Google Scholar]
- 31. Recker R, Lappe J, Davies K, Heaney R. Characterization of perimenopausal bone loss: a prospective study. J Bone Miner Res. 2000;15:1965–1973 [DOI] [PubMed] [Google Scholar]