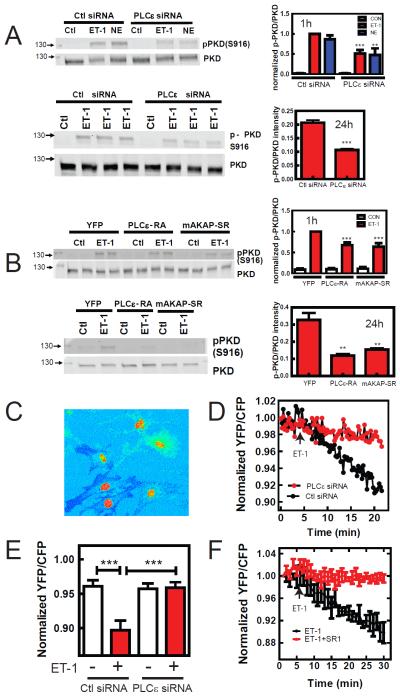
Figure 4.
PLCε regulates nuclear PKD activation. (A) NRVMs were infected with PLCε or control (Ctl) siRNA, followed by treatment with 100 nM ET-1 or 10 μM Norepinephrine (NE) for 1h and ET-1 for 24h, and assessment of PKD phosphorylation by Western blotting each repeated 3–4 times. Statistically different from Ctl siRNA **p<0.01, ***p<0.005 (B) NRVMs were infected with either control YFP, mAKAP-SR or PLCε-RA expressing adenoviruses to disrupt PLCε-mAKAP scaffolding, followed by treatment with 100 nM ET-1 for 1h or 24h and assessment of total PKD activation. Statistically different from Ctl siRNA ***p<0.005 (C) NRVMs were transduced with adenovirus expressing nuclear targeted D kinase activation reporter (nDKAR). The YFP to CFP ratio is shown as a pseudocolor image to emphasize the high level of FRET in the nucleus. D) a region in the nucleus from NRVMs expressing showing nDKAR FRET was selected and the YFP/CFP ratio was followed for the indicated times after 100 nM ET-1 addition in PLCε siRNA or ctl siRNA adenovirus treated NRVMs. E) Pooled data for the YFP/CFP ratio of nDKAR analyzed 20 min after addition of ET-1 (+) or vehicle (−) from 5 independent experiments in PLCε siRNA or Ctl siRNA expressing NRVMs (50–100 cells each condition) ***p<0.005. F) NRVMs were cotransfected with plasmids expressing nDKAR and mAKAP-SR1 or control LacZ. ET1 (100nM) was added at the indicated time. Data are pooled from 4 independent cells for each treatment from 2 separate NRVM preparations. All quantitative data is (+/− SEM). See also Figure S3.

