

Summary
To assess if immunochemotherapy influenced the prognostic value of IPI in elderly diffuse large B-cell lymphoma (DLBCL) patients, we evaluated the performance of the standard International Prognostic Index (IPI) and following modifications: age adjusted (AA)-IPI, revised (R)-IPI, and an elderly IPI with age cut-off 70 years (E-IPI) in patients >60 years treated with RCHOP (rituximab, cyclophosphamide, doxorubicin, vincristine and prednisone). In 267 patients, by IPI/AA-IPI 60% were high-intermediate, 53% high and 12% low risk. With R-IPI, 60% were poor risk and none very good risk. Using E-IPI, 45% were high-intermediate/high risk and 27% low risk. No differences in outcome were seen in the low/low-intermediate groups with IPI/AA-IPI. For E-IPI, failure-free survival (FFS) and overall survival (OS) were significantly different for low/low-intermediate groups. No differences were detected in the four indices with model fit/discrimination measures; however, E-IPI ranked highest. For elderly R-CHOP treated patients, distribution of IPI/AA-IPI skewed toward high/high-intermediate risk with no differences in FFS/OS between low/low-intermediate risk. In contrast, with E-IPI, more are classified as low risk with significant differences in FFS/OS for low-intermediate compared to low risk. The R-IPI does not identify a very good risk group, thus minimizing its utility in this population. The prognostic discrimination provided by the E-IPI for low and low-intermediate elderly DLBCL patients needs validation by other datasets.
Keywords: immunochemotherapy, prognostic, elderly, NHL, CHOP
Introduction
Diffuse large B-cell lymphoma (DLBCL) is the most common type of non-Hodgkin lymphoma (NHL).(Harris, et al 2000, Monti, et al 2005, Rosenwald, et al 2002) In DLBCL, the International Prognostic Index (IPI) is a clinical prognostic model that predicts outcome.(The International Non-Hodgkin’s Lymphoma Prognostic Factors Project 1993) This model, based on five independent prognostic factors including age > 60 years, Ann Arbor stage III or IV, serum lactate dehydrogenase (LDH) >1x normal, performance status (PS) ≥ 2, and number of extra-nodal sites (EN) >1, identified four distinct prognostic groups. Characterizing patients by the number of prognostic factors as low (none or one factor, 35%), low-intermediate (two factors, 27%), high-intermediate (three factors, 22%), or high (four or five factors, 26%) predicted 5-year overall survival (OS) values of 73%, 51%, 43%, and 26%, respectively. The estimated relative risks associated with each of the independently significant risk factors were comparable. For younger (age ≤ 60) patients an age adjusted IPI (AA-IPI) based on 3 risk factors (stage, LDH and PS) also identified four distinct groups with survivals ranging from 32% to 83%.(The International Non-Hodgkin’s Lymphoma Prognostic Factors Project 1993)
Both the IPI and the AA-IPI were developed when standard therapy was anthracycline-based combination chemotherapy; predominantly CHOP (cyclophosphamide, doxorubicin, vincristine and prednisone). (Fisher, et al 1993) Recently, the standard of care for DLBCL has changed and significant improvements in outcome for patients have been reported by incorporating monoclonal antibody therapy with CHOP. A seven-year update of the Groupe d’Etude de Lymphome d’Adultes (GELA) trial demonstrated a durable benefit of adding rituximab, a chimeric IgG1 antibody targeting CD20, to CHOP chemotherapy (R-CHOP) for the treatment of elderly patients with DLBCL (age > 60 years), with a 5-year OS of 58% with R-CHOP versus 45% with CHOP alone (p=0.0073).(Coiffier, et al 2002, Feugier, et al 2005) The US Intergroup trial (E4494/C9793) also confirmed the superiority of R-CHOP in patients aged 60 years and older with DLBCL. In this study R-CHOP significantly prolonged the failure-free survival (FFS) compared to CHOP alone (53% versus 46%, p=0.04).(Habermann, et al 2006) Subsequently, the German High Grade Lymphoma Study Group RICOVER-60 trial, Mabthera International Trial (MInT) trial, and a Canadian population-based study have also confirmed the value of the addition of rituximab to chemotherapy in DLBCL.(Pfreundschuh, et al 2008, Pfreundschuh, et al 2006, Sehn, et al 2005)
Recently the Vancouver group analysed the applicability of the IPI in a registry population of patients with newly diagnosed DLBCL treated with R-CHOP. (Sehn, et al 2007) A revision of the IPI (R-IPI) was proposed, redistributing the five IPI elements into three prognostic groups with 4-year OS ranging from 55% to 94%. Notably, 4-year OS exceeded 50% in the highest risk group, suggesting a marked improvement in outcome in the rituximab era.
Results from the RICOVER-60 trial and the Dutch HOVON (Stichting Hemato-Oncologie voor Volwassenen Nederland) trials in patients over age 60 found age > 70 to be an adverse factor.(Pfreundschuh, et al 2008, Sonneveld et al 2006) The latter patients had an inferior outcome largely due to excessive toxicity and the inability to complete the planned therapy.
The present study assessed the IPI, AA-IPI and R-IPI in patients treated with R-CHOP in the US Intergroup study E4494, a study restricted to patients > 60 years. Based on reports of significance of age within an older population, we propose and evaluate an elderly IPI (E-IPI) with 70 years as the cut-off point for the IPI and also compare the relative dose intensity of chemotherapy by age in E4494.
Patients and methods
We performed a retrospective analysis of prognostic indices in elderly patients treated on the R-CHOP arm of the US Intergroup trial E4494 conducted according to the Declaration of Helsinki and approval by Human Investigations Committees.
Patients were 60 years of age or older and had been randomized to receive 6 to 8 cycles of CHOP plus rituximab (administered on days -7 and -3, and prior to the third, fifth, and seventh cycles as previously described).(Habermann, et al 2006) Complete or partial responders after R-CHOP, stratified by initial standard IPI, were then randomized to observation or maintenance rituximab (MR) administered weekly for four consecutive weeks at six-month intervals for a total of four cycles. MR did not influence outcome after R-CHOP, therefore we included all R-CHOP treated patients in this analysis.(Morrison et al 2007)
The distribution of patients for the index groups (IPI, AA-IPI, R-IPI, E-IPI) has been reported, as well as the FFS and OS (Habermann, et al 2006). FFS was defined as the time from R-CHOP randomization to the first relapse, non-protocol treatment or death. OS was defined as the time from R-CHOP randomization to death from any cause. FFS and OS were estimated by the Kaplan-Meier method and compared by clinical features using the log-rank test.(Kaplan & Meier 1958) Cox proportional hazards model was used to estimate the hazard ratio (HR) with the low risk groups as the reference group. Performance of indices was compared by a measure of global fit (Akaike’s information criteria, AIC) and by a measure of discrimination (concordance probability estimate, CPE). (Akaike 1974) (Gönen & Heller 2005)(Harrell 2001) Low values of AIC indicate better fit and high values of CPE indicate better discrimination. The area under the receiver operator characteristic curve (ROC) over time has been shown and denoted as area under the ROC curve (AUC). (Heagerty & Zheng 2005)
Relative Dose of CHOP
To understand if outcome with advanced age is related to differences in chemotherapy dose delivered or to differences in the inherent biology of the disease in elderly patients, the relative dose (RD) of R-CHOP was compared according to age younger or older than 70 years. At each cycle, RD was calculated as: [Actual dose (mg) / BSA (m2)] / [Protocol specified dose (mg/ m2)] *100. Median RD’s were compared using the Wilcoxon rank sum test and the proportions that reached full dose (defined as >=85% of planned) were compared using the Fisher’s exact test. Fisher’s exact test was also used to compare baseline characteristics by whether patients achieved full dose of the average relative dose (ARD) of cyclophosphamide and doxorubicin.
Results
Among the 267 patients randomized to the R-CHOP arm, the frequency of the individual prognostic factors within the IPI and the estimated relative risk from univariate analysis of FFS and OS are provided in Table I. The median age of our study population was 69 years (range 60-92). The majority (75%) had advanced stage disease and more than 60% had an elevated LDH. Sixty percent had 3 or more adverse risk factors (Table II). In univariate analysis, FFS and OS were significantly different (p<0.01) by the IPI factors with the estimated relative risk (RR) ranging from 1.6-2.3 for FFS and 1.8-2.3 for OS. Patients ≥70 years of age were at an increased risk of failure, as compared to patients < 70 years (RR estimate of 1.7, p=0.002). The estimated 3-year FFS was 64 (95% confidence interval {CI}: [56,72] versus 49 95% CI: [40,58] and 3-year OS was 74 (95% CI: [72,82] versus 58 (95% CI: [49,66], respectively.
Table I.
FFS and OS Univariate Analysis by the IPI Risk Factors
| Prognostic Factor* | N (%) | FFS Univariate Analysis | OS Univariate Analysis | ||||
|---|---|---|---|---|---|---|---|
| Estimated 3-year FFS (95% CI) | RR (95% CI) | p-value*** | Estimated 3-year OS (95% CI) | HR (95% CI) | p-value*** | ||
| Age ≥ 70 years** | 128 (49) | 49 (40, 58) | 1.7 (1.2,2.4) | 0.002 | 58 (49, 66) | 2.0 (1.4,2.9) | 0.002 |
| ECOG PS > 1 | 39 (14.6) | 43 (27, 59) | 1.6 (1.1,2.5) | 0.027 | 46 (30, 62) | 2.0 (1.3,3.1) | 0.003 |
| Elevated LDH | 160 (60) | 48 (40, 56) | 1.7 (1.2,2.5) | 0.003 | 57 (50, 65) | 2.1 (1.4,3.1) | 0.0004 |
| Extra-nodal sites ≥ 1 | 81 (30) | 39 (28, 50) | 2.3 (1.6,3.2) | < 0.001 | 39 (28, 50) | 2.3 (1.6,3.2) | < 0.0001 |
| Stage III/IV | 201 (75) | 51 (44, 59) | 1.8 (1.2,2.8) | 0.005 | 51 (44, 59) | 1.8 (1.2,2.8) | 0.005 |
ECOG PS, Eastern Cooperative Oncology Group Performance Status; LDH, Lactic dehydrogenase; IPI, International Prognostic Index; RR, Relative Ratio; HR, Hazard Ratio; FFS, Failure-Free Survival; OS, Overall Survival
Reference groups are age < 70 years, ECOG PS 0-1, normal LDH, no extra-nodal sites and stage I-II
All patients (N=267) were older than 60 years of age
Log rank-p value
Table II.
Distribution and Outcome of Patients according to the IPI, Age Adjusted IPI, Revised IPI and Elderly IPI
| Group | Factors | Patients N (%) | FFS | OS | ||||
|---|---|---|---|---|---|---|---|---|
|
| ||||||||
| Estimated 3-year (95% CI) | Estimated HR (95% CI) | Wald p-value | Estimated 3-year * (95% CI) | Estimated HR (95% CI) | Wald p-value | |||
|
| ||||||||
| IPI | ||||||||
| Low | 0-1 | 32 (12) | 78 (63, 94) | 1 | 83 (70, 97) | 1 | ||
| Low Intermediate | 2 | 75 (28) | 70 (59, 81) | 1.3 (0.7,2.6) | .42 | 80 (71, 89) | 1.3 (0.6,2.9) | .53 |
| High Intermediate | 3 | 88 (33) | 56 (46, 67) | 1.8 (0.9,3.4) | .09 | 68 (58, 78) | 1.7 (0.8,3.6) | .18 |
| High | 4-5 | 72 (27) | 33 (22, 45) | 3.9 (2,7.4) | < 0.001 | 43 (32, 54) | 4 (1.9,8.6) | < 0.001 |
| Age Adjusted-IPI | ||||||||
| Low | 0 | 32 (12) | 78 (63, 94) | 1 | 83 (70, 97) | 1 | ||
| Low Intermediate | 1 | 93 (35) | 68 (58, 77) | 1.4 (0.7,2.8) | .31 | 78 (69, 86) | 1.3 (0.6,2.8) | .49 |
| High Intermediate | 2 | 118 (44). | 47 (38, 56) | 2.4 (1.3,4.6) | .007 | 59 (50, 68) | 2.5 (1.2,5.2) | .02 |
| High | 3 | 24 (9) | 31 (12, 51) | 4 (1.9,8.7) | < 0.001 | 35 (15, 54) | 4.6 (2,10.9) | < 0.001 |
| Revised-IPI | ||||||||
| Very Good | 0 | 0 (0) | - | - | ||||
| Good | 1-2 | 107 (40) | 72 (63, 81) | 1 | 81 (73, 88) | 1 | ||
| Poor | 3-5 | 160 (60) | 46 (39, 54) | 2 (1.4,2.9) | < 0.001 | 57 (49, 64) | 2.1 (1.4,3.1) | < 0.001 |
| Elderly-IPI(age ≥ 70 years) | ||||||||
| Low | 0-1 | 72 (27) | 77 (69, 89) | 1 | 86 (78, 94) | 1 | ||
| Low Intermediate | 2 | 75 (28) | 62 (50, 73) | 2.1 (1.2,3.6) | .006 | 74 (64, 84) | 1.9 (1,3.5) | .04 |
| High Intermediate | 3 | 77 (29) | 47 (36, 59) | 2.9 (1.7,4.8) | < 0.001 | 58 (47, 69) | 3.3 (1.9,5.9) | < 0.001 |
| High | 4-5 | 43 (16) | 28 (14, 43) | 5.6 (3.2,9.9) | < 0.001 | 36 (21, 50) | 6 (3.3,11) | < 0.001 |
FFS, Failure-Free Survival; OS, Overall Survival; IPI, International Prognostic Index; CI, Confidence Interval; HR, Hazard Ratio
All risk groups significantly different; log rank p < 0.001
For each of the 4 indices, the estimated FFS and OS distribution using the Kaplan Meier method are shown in Figures 1 and 2. The estimated 3-year FFS and OS by risk groups are provided in Table II as well as the estimated HR using the lowest risk group as the reference group. The 3-year FFS and OS estimates among patients reclassified between the IPI and E-IPI groups are provided in Table III.
Figures 1.
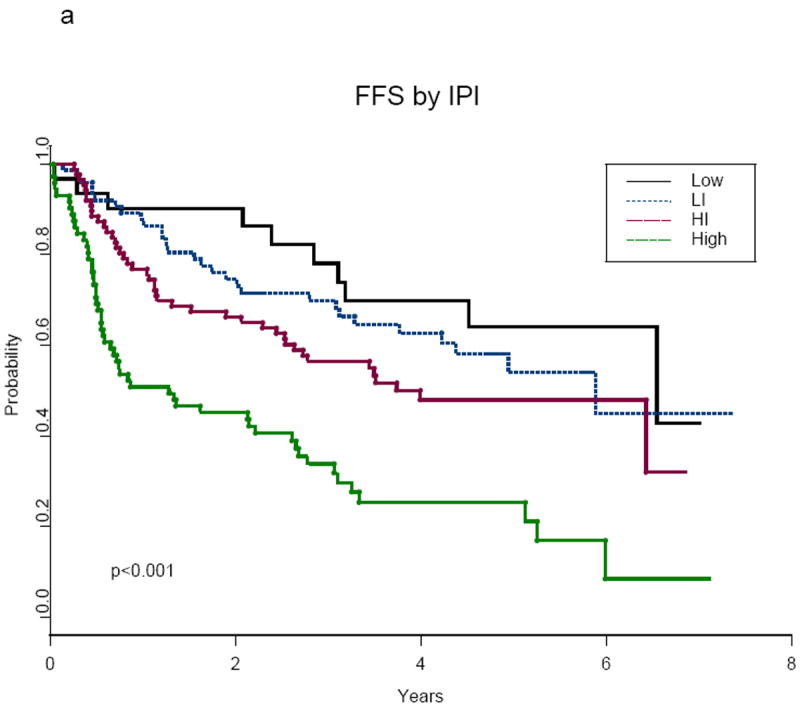
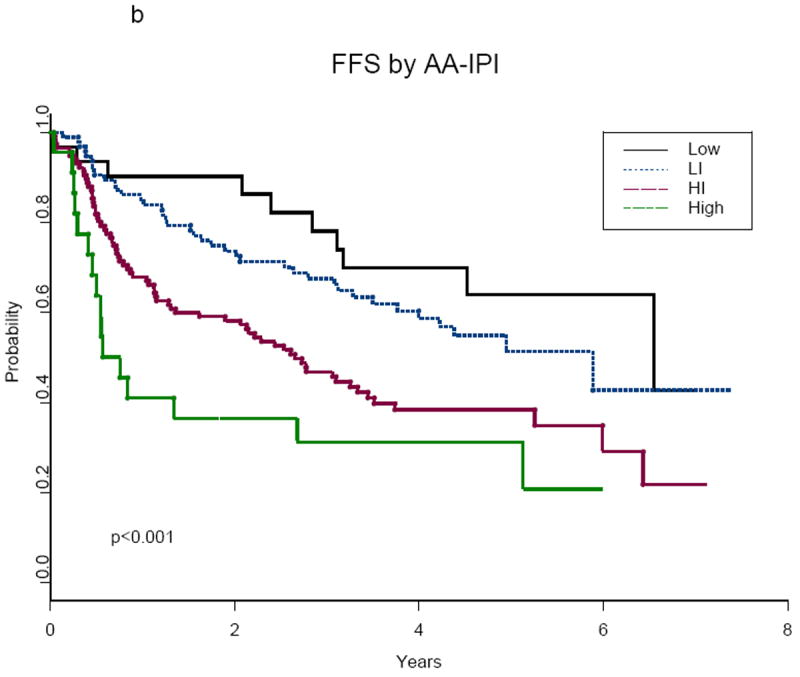
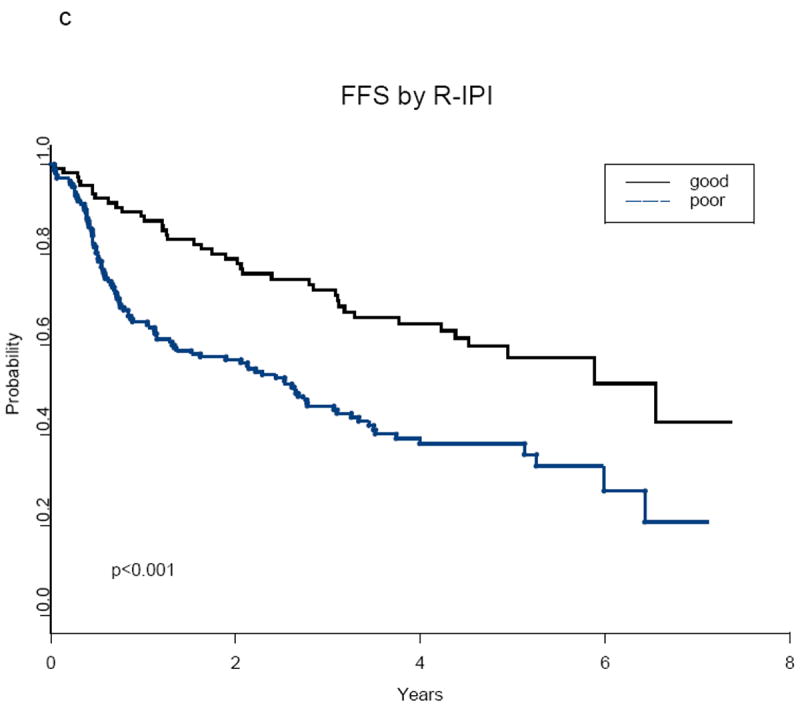
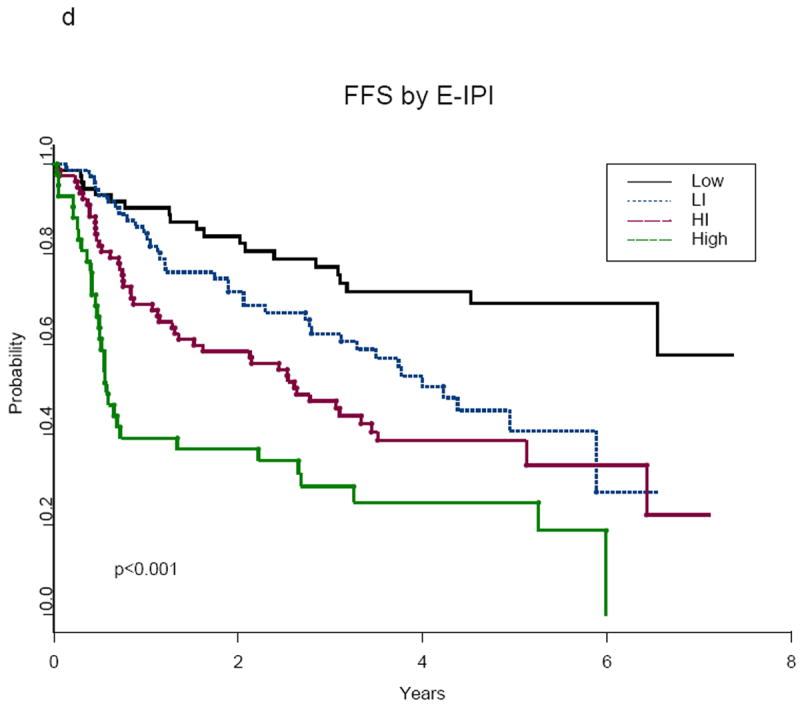
a-d: Failure-Free Survival (FFS) According to Prognostic Indices
Abbreviations:
IPI, International Prognostic Index; AA-IPI, Age-Adjusted International Prognostic Index; R-IPI, Revised International Prognostic Index; E-IPI, Elderly International Prognostic Index; Low, Low risk; LI, Low Intermediate Risk; HI, High Intermediate Risk; High, High Risk; poor, Poor Risk; good, Good Risk
Figures 2.
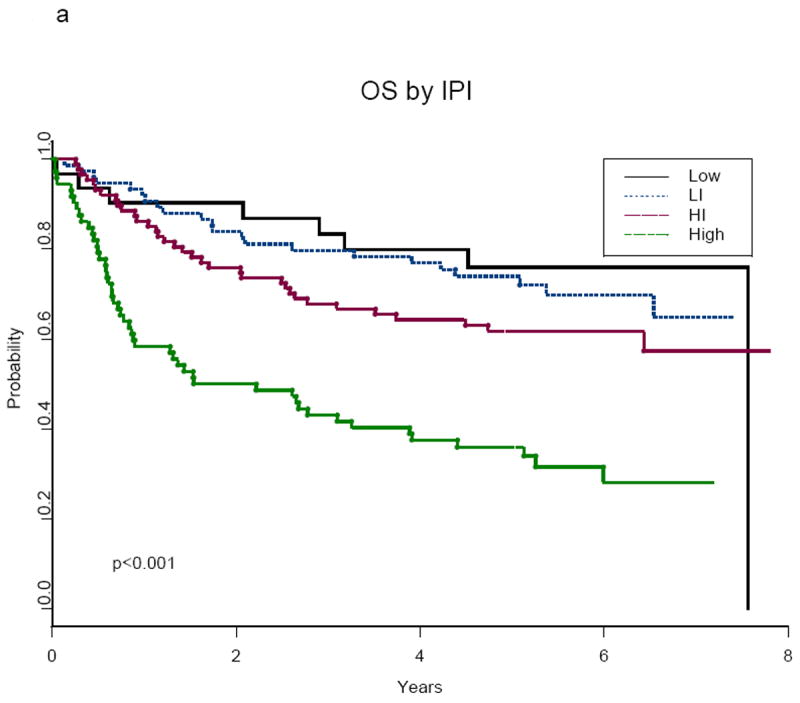
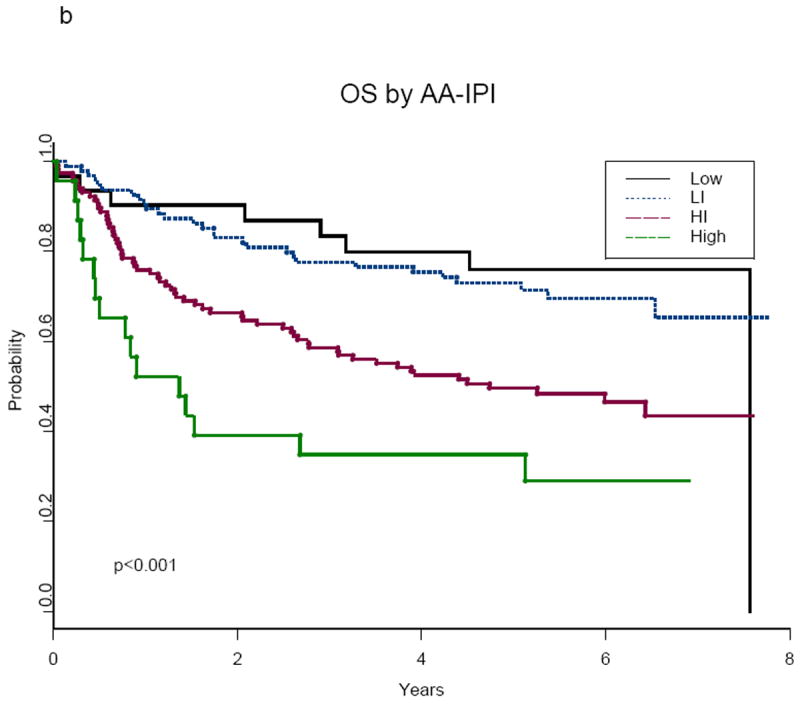
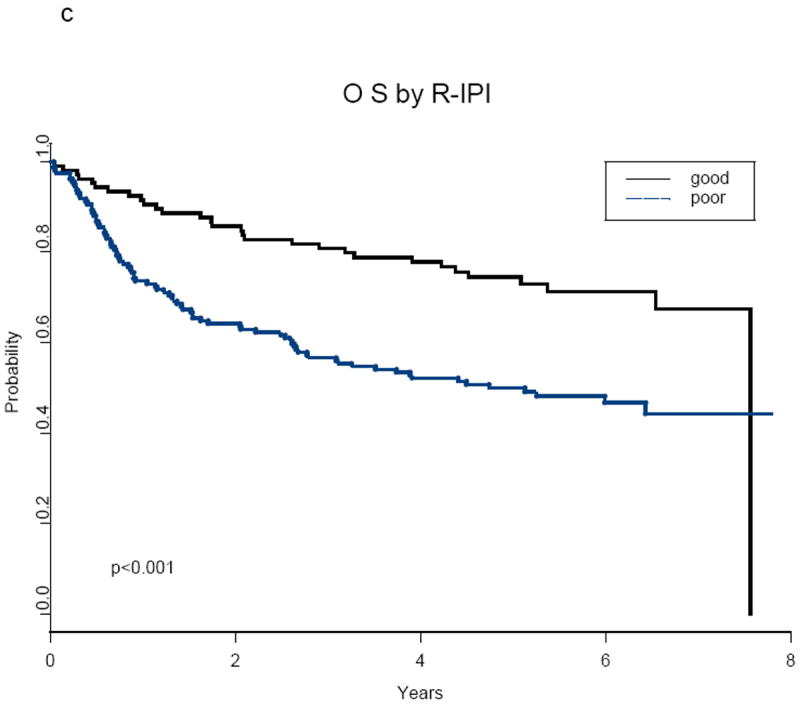
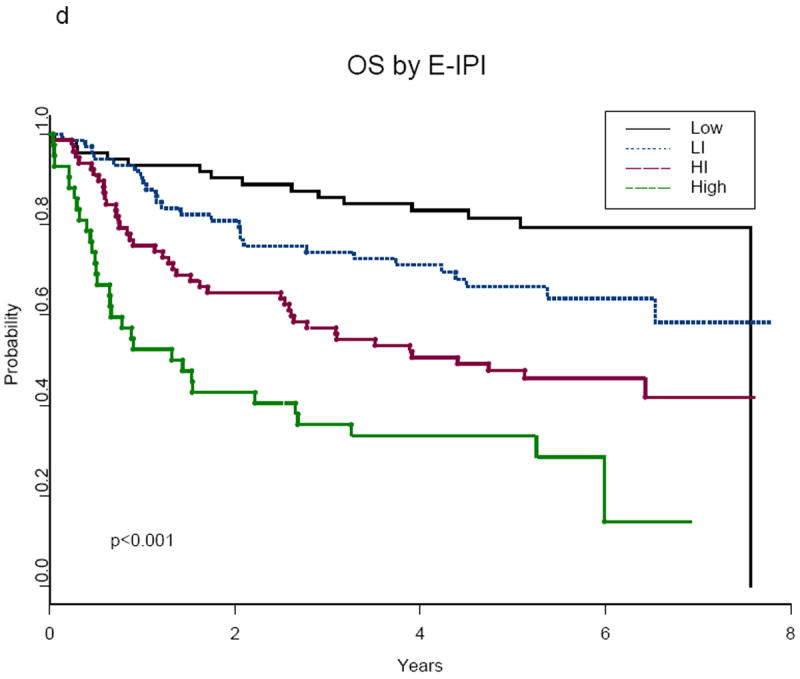
a-d: Overall Survival (OS) According to Prognostic Indices
Abbreviations:
IPI, International Prognostic Index; AA-IPI, Age-Adjusted International Prognostic Index; R-IPI, Revised International Prognostic Index; E-IPI, Elderly International Prognostic Index; Low, Low Risk; LI, Low Intermediate Risk; HI, High Intermediate Risk; High, High Risk; poor, Poor Risk; good, Good Risk
Table III.
Comparison of 3-year FFS and OS for patients reclassified between IPI and E-IPI
| Risk Group | n | 3-year FFF (95% CI) | 3-year OS (95% CI) |
|---|---|---|---|
|
| |||
| Different for IPI and E-IPI | |||
| Low intermediate IPI and low E-IPI | 42 | 79 (67, 91) | 87 (77, 97) |
| High intermediate IPI and low intermediate E-IPI | 41 | 63 (47, 79) | 78 (64, 92) |
| High intermediate IPI and high intermediate E-PI | 30 | 41 (23, 59) | 53 (35, 71) |
| Same for IPI and E-IPI | |||
| Low intermediate IPI and low E-IPI | 33 | 59 (43,75) | 70 (54, 86) |
| High intermediate IPI and high intermediate E-IPI | 48 | 51 (37, 65) | 60 (46, 74) |
| High IPI and high E-IPI | 42 | 28 (13, 43) | 36 (22, 50) |
FFS, Failure-Free Survival; OS, Overall Survival; PI, International Prognostic Index; E-IPI, Elderly International Prognostic Index; CI, Confidence Interval
IPI and Age-adjusted IPI
When the standard IPI was employed, as would be expected by the older population in this study, relatively few (12%) patients were in the low (0-1 factor) risk group. The risk groups for the remaining patients were distributed as: low intermediate (2 factors): 28%, high intermediate (3 factors): 33%, and high (4 or 5 factors): 27% (Table II). No differences were detected in the outcomes for the low and low intermediate groups (estimated HR of 1.3, p>0.4 for FFS and OS)(Table II, Figures 1a and 2a). In contrast, significant differences were noted in the comparison of the high intermediate and high risk groups: 3-year FFS 56% versus 33% (log-rank p<0.01) and 3-year OS 68% versus 43% (log-rank p<0.01), respectively (Table II, Figures 1a and 2a).
With application of the AA-IPI, the majority of patients had either low intermediate (35%) or high intermediate risk (44%) disease (Table II). Both low (12%) and high (9%) risk groups were proportionally small (Table II). Similar to the IPI, the AA-IPI was prognostic of outcome for both FFS and OS (Table II, Figures 1b and 2b) with no difference detected between the low and low-intermediate risk groups (estimated HR of 1.4 and 1.3, respectively, for FFS and OS, p>0.3). Significant differences in outcome were noted for the high intermediate versus the high-risk group: 3-year FFS 47% versus 31% (log-rank p<0.001) and 3-year OS 59% versus 35% (log-rank p<0.001), respectively. Although the AA-IPI identified a high-risk group with very poor outcome, only 24 (9%) patients were in this category (Table II).
Revised international prognostic index
The R-IPI defines three risk groups with 0, 1-2, and 3-5 of the IPI factors designated as very good, good and poor. By definition, in our study of patients 60 years or older, all patients had at least 1 factor. Therefore, there were no patients in the very good category. Within the two remaining groups, 40% of our patients were classified as good risk and 60% as poor risk (Table II). FFS and OS for these two groups were significantly different (estimated HR of 2.0 and 2.1, respectively, p<0.001, Table II), with 3-year FFS estimates of 72% versus 46% and 3-year OS estimates of 81% versus 57% for the good versus poor risk patients.
Elderly international prognostic index
Using 70 years of age instead of 60 years as the cut-off point in the IPI resulted in more patients in the E-IPI low risk category compared to the standard IPI (27% versus 12%) whereas the high-risk group was reduced (16% versus 27%), (Table II). The 3-year FFS estimates for the low, low intermediate, high intermediate and high-risk groups according to E-IPI were 77%, 62%, 47% and 28% respectively, (Figure 1d). The 3-year OS estimates were 86%, 74%, 58% and 36% for the respective E-IPI groupings (Figure 2d). Within the E-IPI risk groups, significant differences in FFS and OS were detected between both the low and low intermediate risk groups and the high intermediate and high risk groups (estimated HR of 2.1 and 1.9 for FFS and OS, respectively, p<0.05, Table II).
Specifically, among the low intermediate IPI patients, 42 (56%) were reclassified as low risk by the E-IPI. Among the high intermediate IPI patients, 41 (46%) were classified as low intermediate by the E-IPI and of the high risk IPI patients, 30 (42%) were reclassified as high intermediate by E-IPI. The 3-year estimates among the reclassified patients were better than those who were not reclassified and the estimated values were closer to the 3-year estimates for the corresponding E-IPI category than the corresponding IPI category (Table III).
Relative dose of CHOP
The median RD for each agent in R-CHOP was close to 100% at each cycle (data not shown). The median average RD intensity across 6 cycles was 99.7% for cyclophosphamide and 99.4% for doxorubicin. Of the 128 patients ≥ 70 years, 70% completed 6 cycles of therapy as compared to 88% of 139 patients < 70 years (p<0.001). The reasons for not completing 6 cycles of therapy for those ≥ 70 years of age (n=38) versus those < 70 years (n=16) were excessive complications and toxicity (34% vs. 31%), patient withdrawal or refusal (26% vs. 0%), patient death without progressive disease (24% vs. 25%), progressive disease (5% vs. 25%) and other reasons (11% vs. 19%), respectively. The outcome of patients ≥ 70 years with incomplete therapy was significantly inferior to those who completed therapy; estimated 3-year FFS 23% versus 60%, p=0.0001 and 3-year OS 30% versus 70%, p=0.0001, respectively.
Comparison of IPI, AA-IPI, R-IPI and E-IPI
The area under the ROC curve, denoted as AUC, is shown in Figures 3a for FFS and in 3b for OS. As to be expected for long-term outcomes, such as FFS and OS, the AUC ranged from 0.58 to 0.68 across time for the various indices. These figures suggest the following ranking of the indices, from highest to lowest AUC over time: E-IPI, IPI, AA-IPI and R-IPI. Similar rankings were obtained using the global model fit criterion (AIC, Table IV) and discrimination measure (CPE, Table IV) with the E-IPI achieving the best fit and discrimination for this population. However, the 95% confidence intervals of the estimated CPE for the E-IPI overlaps with the other indices.
Figure 3.
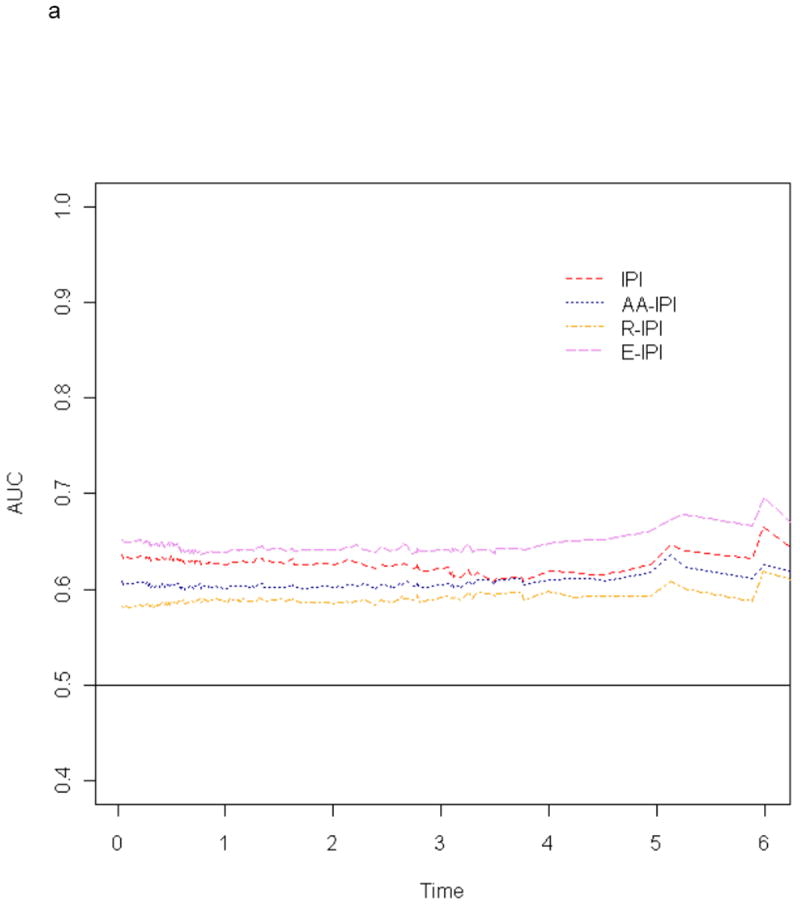
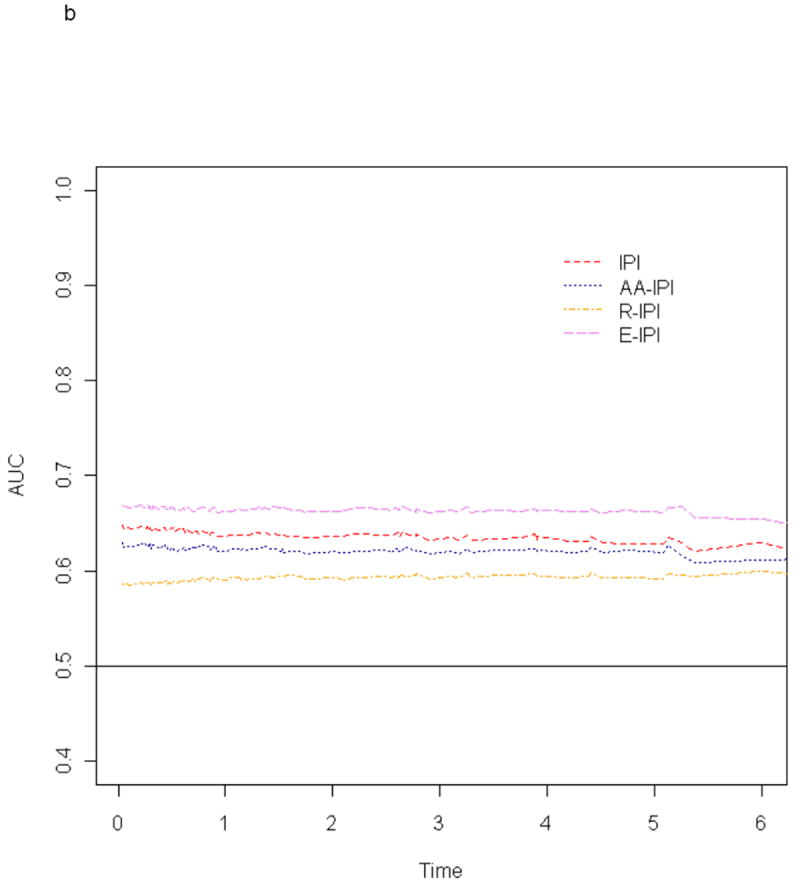
a-b: Time Weighted Area Under the Receiver Operator Characteristics Curves (AUC) for Failure-Free Survival (3a) and Overall Survival (3b) According to Prognostic Indices
Abbreviations:
IPI, International Prognostic Index; AA-IPI, Age-Adjusted International Prognostic Index; R-IPI, Revised International Prognostic Index; E-IPI, Elderly International Prognostic Index
Table IV.
Results from Comparison of IPI, Age Adjusted IPI, Revised IPI and Elderly IPI Using Model Fit and Discrimination Criteria
| Group | FFS | OS | ||
|---|---|---|---|---|
|
| ||||
| Model Fit (AIC*) | Model Discrimination: CPE ** (95% CI) | Model Fit (AIC*) | Model Discrimination: CPE ** (95% CI) | |
|
| ||||
| IPI | 1342 | 0.62 (0.58,0.66) | 1155 | 0.63 (0.58,0.67) |
| Age-Adjusted IPI | 1353 | 0.60 (0.56,0.65) | 1163 | 0.62 (0.57,0.66) |
| Revised IPI | 1352 | 0.59 (0.55,0.63) | 1168 | 0.59 (0.55,0.64) |
| Elderly IPI | 1335 | 0.64 (0.60,0.69) | 1147 | 0.66 (0.61,0.70) |
AIC, Akakie Information Criterion; CPE, Concordance Probability Estimate; FFS, Failure-Free Survival; OS, Overall Survival; IPI, International Prognostic Index
Discussion
Our data showed the standard IPI to be prognostic in patients >60 years in the R-CHOP era (Figures 1a and 2a), but no differences were detected between low and low intermediate risk groups. Similar results were found with the AA-IPI (Figures 1b and 2b). Both the IPI and the AA-IPI identified a group of high-risk patients with a poor prognosis, however, only 9% of the patients were high risk per the AA-IPI. In this older population, the R-IPI yielded two risk groups, minimizing the utility of this index in this population. In contrast, classification by the E-IPI resulted in survival differences between the low and low intermediate risk groups.
In the original IPI analysis, age was dichotomized at 60 years because candidacy for high dose therapies supported by autologous stem cells was restricted to younger patients.(The International Non-Hodgkin’s Lymphoma Prognostic Factors Project 1993) Patients > 60 years were treated on different protocols than younger patients based on tolerance for intensified treatment. However, currently, this is no longer the case, as the use of granulocyte colony-stimulating factor (G-CSF) has resulted in similar dose intensity of therapies in both younger and older patient populations in several trials.(Pfreundschuh, et al 2008, Pfreundschuh, et al 2006) Most importantly, data across several studies have shown that outcomes in patients >60 years are significantly improved by adding rituximab to CHOP chemotherapy.(Feugier, et al 2005, Habermann, et al 2006, Pfreundschuh, et al 2008)
To better delineate the impact of age as a risk factor in the era of growth factors and rituximab in an older population, an age cut-off point of 70 years in the US Intergroup trial E4494 was evaluated. This was also the median age in our study population. Additionally, data demonstrates greater myelosuppression (73% versus <40% in younger patients) and co-morbidity play a role in treatment tolerance in patients > 70 years.(Balducci and Beghe 2001) We found ≥70 years to be a significant adverse factor on univariate analysis both for FFS and OS. As anticipated, the E-IPI age modification placed more patients in the low risk category and fewer patients in the high-risk category as compared to the IPI and the AA-IPI. In addition, significant differences in outcome were detected between the low and low-intermediate risk groups and a particularly unfavorable high-risk group was identified, with estimated FFS of 28% and OS of 36% (Figures 1d and 2d) at 3 years. The 3-year estimates among reclassified patients were better than those who were not reclassified and were closer to the 3-year estimates for the corresponding E-IPI categories than to the IPI category (Table III).
In the R-CHOP era, other studies have also described age ≥ 70 to be associated with an inferior outcome in DLBCL. The RICOVER-60 trial and the Dutch HOVON trials in patients over age 60 found age > 70 to be an adverse factor.(Pfreundschuh, et al 2008, Sonneveld P 2006) In both studies, a dose dense schedule of R-CHOP was administered every 14 days. Patients greater than age 70 years had an inferior outcome largely due to their inability to complete the planned therapy and excessive toxicity compared to younger patients. This was the case in our study as well and fewer patients age ≥ 70 completed 6 cycles of therapy (70% compared to 88%, p=0.0001). The majority refused a full course of therapy or were unable to complete full course due to excessive toxicities. In addition, outcome of this group was significantly worse as compared to those who completed therapy (3-year FFS 23% versus 60%, p=0.0001 and OS 30% versus 70% p=0.0001, respectively).
Co-morbidities, often age-dependent, probably played a role in this observation. Co-morbidities have been classified as low, medium or high risk according to an index developed by the National Institute of Aging and the National Cancer Institute.(Yancik, et al 1998) A population-based study from the Netherlands has used the latter co-morbidity score and assessed outcome in patients with NHL.(Janssen-Heijnen, et al 2005) A high impact co-morbidity score doubled the risk of death and was independent of the IPI.(Janssen-Heijnen, et al 2005) A comprehensive geriatric assessment (CGA), in addition to co-morbidities also accounts for functional, cognitive, and emotional status, and has been used as a tool for tailoring therapy in patients > 70 years with aggressive lymphomas.(Repetto, et al 2002) A recent study prospectively evaluated the CGA for choice of chemotherapeutic agent and appropriate dosing in patients > 70 years with DLBCL. Most patients tolerated therapy well with a 3-year OS, disease-free survival and event-free survival of 71%, 80% and 58%, respectively, suggesting that this approach was a feasible method for tailoring therapy in elderly patients with DLBCL (Tirelli et al 2008) These studies and our data support the concept that patients aged > 60 years are a heterogeneous population with differing outcomes.
Clinical prognostic features incorporated in the IPI reflect the interaction of the biological heterogeneity of DLBCL and its treatment. As therapies evolve and impact outcomes, established prognostic factors must be reassessed. The goal of our analyses was to evaluate the performance of the IPI and newly proposed prognostic indices in older DLBCL patients treated on a uniform controlled trial in the rituximab era. The IPI and AA-IPI both identified a high-risk group with a particularly poor outcome despite R-CHOP therapy; however, no difference in outcome was detected for the low and low-intermediate risk groups. In contrast, the E-IPI proposed in this study identified low and low-intermediate risk groups with different prognosis and a high-risk group. Using the R-IPI, no patients were classified into the very good risk group, minimizing the utility of this index in patients older than 60 years of age. These distinctions have clinical significance as new therapeutic initiatives are required for high-risk patients while toxicity issues and detection of higher risk subsets become more important in low risk patients.(Alizadeh, et al 2000, Lenz, et al 2008, Malumbres, et al 2008, Moskowitz et al 2006, Nyman, et al 2007, Winter, et al 2006)
In conclusion, in our data set the IPI and AA-IPI remain useful tools for outcome prediction in patients greater than 60 years of age treated with R-CHOP. The IPI, AA-IPI and the E-IPI all identify a particularly unfavorable, high-risk group with less than a 50% chance of surviving 3 years. This has also been the observation in a recent report in which the IPI maintained its power for risk stratification in the R-CHOP era across three prospective trials in Germany. (Ziepert, et al, 2010) The additional prognostic discrimination provided by the E-IPI for low and low-intermediate risk patients needs to be validated by other datasets with DLBCL patients greater than 60 years of age.
Acknowledgments
Supported, in part by Public Health Service Grants No. CA13650, CA23318, CA66636, CA21115, CA16450, CA35431, CA11083, CA32291 and by the National Cancer Institute, the National Institutes of Health, and the Department of Health and Human Services.
The contents of this article are solely the responsibility of the authors and do not necessarily represent the official views of the National Cancer Institute.
Footnotes
Presented at the 48th Annual Meeting of the American Society of Hematology, December 2006, Atlanta, GA
Authorship
The contributions of RHA, TMH, VAM, RIF, BAP, and SJH include: study design, provision of study patients, collection and assembly of data, data analysis and interpretations and manuscript writing.
The contributions of HC, EAW and RDG include: study design, collection and assembly of data, data analysis and interpretations and manuscript writing.
disclosures
None of the authors reported a potential conflict of interest.
References
- Akaike H. A new look at the statistical model identification. IEEE Transactions on Automatic Control. 1974;19:716–723. [Google Scholar]
- Alizadeh AA, Eisen MB, Davis RE, Ma C, Lossos IS, Rosenwald A, Boldrick JC, Sabet H, Tran T, Yu X, Powell JI, Yang L, Marti GE, Moore T, Hudson J, Jr, Lu L, Lewis DB, Tibshirani R, Sherlock G, Chan WC, Greiner TC, Weisenburger DD, Armitage JO, Warnke R, Levy R, Wilson W, Grever MR, Byrd JC, Botstein D, Brown PO, Staudt LM. Distinct types of diffuse large B-cell lymphoma identified by gene expression profiling. Nature. 2000;403:503–511. doi: 10.1038/35000501. [DOI] [PubMed] [Google Scholar]
- Balducci L, Beghe C. Cancer and age in the USA. Critical Reviews in Oncology/Hematology. 2001;37:137–145. doi: 10.1016/s1040-8428(00)00109-8. [DOI] [PubMed] [Google Scholar]
- Coiffier B, Lepage E, Briere J, Herbrecht R, Tilly H, Bouabdallah R, Morel P, Van Den Neste E, Salles G, Gaulard P, Reyes F, Lederlin P, Gisselbrecht C. CHOP chemotherapy plus rituximab compared with CHOP alone in elderly patients with diffuse large-B-cell lymphoma. New England Journal of Medicine. 2002;346:235–242. doi: 10.1056/NEJMoa011795. [DOI] [PubMed] [Google Scholar]
- Feugier P, Van Hoof A, Sebban C, Solal-Celigny P, Bouabdallah R, Ferme C, Christian B, Lepage E, Tilly H, Morschhauser F, Gaulard P, Salles G, Bosly A, Gisselbrecht C, Reyes F, Coiffier B. Long-term results of the R-CHOP study in the treatment of elderly patients with diffuse large B-cell lymphoma: a study by the Groupe d’Etude des Lymphomes de l’Adulte. Journal of Clinical Oncology. 2005;23:4117–4126. doi: 10.1200/JCO.2005.09.131. [DOI] [PubMed] [Google Scholar]
- Fisher RI, Gaynor ER, Dahlberg S, Oken MM, Grogan TM, Mize EM, Glick JH, Coltman CA, Jr, Miller TP. Comparison of a standard regimen (CHOP) with three intensive chemotherapy regimens for advanced non-Hodgkin’s lymphoma. New England Journal of Medicine. 1993;328:1002–1006. doi: 10.1056/NEJM199304083281404. [DOI] [PubMed] [Google Scholar]
- Gönen M, Heller G. Concordance Probability and Discriminative Power of Proportional Hazards Regression. Biometrika. 2005;92:965–970. [Google Scholar]
- Habermann TM, Weller EA, Morrison VA, Gascoyne RD, Cassileth PA, Cohn JB, Dakhil SR, Woda B, Fisher RI, Peterson BA, Horning SJ. Rituximab-CHOP versus CHOP alone or with maintenance rituximab in older patients with diffuse large B-cell lymphoma. Journal of Clinical Oncology. 2006;24:3121–3127. doi: 10.1200/JCO.2005.05.1003. [DOI] [PubMed] [Google Scholar]
- Harrell FE., Jr . Regression Modeling Strategies. Springer; New York: 2001. [Google Scholar]
- Harris NL, Jaffe ES, Diebold J, Flandrin G, Muller-Hermelink HK, Vardiman J, Lister TA, Bloomfield CD. The World Health Organization classification of neoplastic diseases of the haematopoietic and lymphoid tissues: Report of the Clinical Advisory Committee Meeting, Airlie House, Virginia, November 1997. Histopathology. 2000;36:69–86. doi: 10.1046/j.1365-2559.2000.00895.x. [DOI] [PubMed] [Google Scholar]
- Heagerty PJ, Zheng Y. Survival model predictive accuracy and ROC curves. Biometrics. 2005;61:92–105. doi: 10.1111/j.0006-341X.2005.030814.x. [DOI] [PubMed] [Google Scholar]
- Janssen-Heijnen ML, van Spronsen DJ, Lemmens VE, Houterman S, Verheij KD, Coebergh JW. A population-based study of severity of comorbidity among patients with non-Hodgkin’s lymphoma: prognostic impact independent of International Prognostic Index. British Journal of Haematology. 2005;129:597–606. doi: 10.1111/j.1365-2141.2005.05508.x. [DOI] [PubMed] [Google Scholar]
- Kaplan E, Meier P. Nonparametric estimation from incomplete observations. Journal of the American Statistical Association. 1958;53:457–481. [Google Scholar]
- Lenz G, Wright G, Dave SS, Xiao W, Powell J, Zhao H, Xu W, Tan B, Goldschmidt N, Iqbal J, Vose J, Bast M, Fu K, Weisenburger DD, Greiner TC, Armitage JO, Kyle A, May L, Gascoyne RD, Connors JM, Troen G, Holte H, Kvaloy S, Dierickx D, Verhoef G, Delabie J, Smeland EB, Jares P, Martinez A, Lopez-Guillermo A, Montserrat E, Campo E, Braziel RM, Miller TP, Rimsza LM, Cook JR, Pohlman B, Sweetenham J, Tubbs RR, Fisher RI, Hartmann E, Rosenwald A, Ott G, Muller-Hermelink HK, Wrench D, Lister TA, Jaffe ES, Wilson WH, Chan WC, Staudt LM. Stromal gene signatures in large-B-cell lymphomas. New England Journal of Medicine. 2008;359:2313–2323. doi: 10.1056/NEJMoa0802885. [DOI] [PMC free article] [PubMed] [Google Scholar]
- Malumbres R, Chen J, Tibshirani R, Johnson NA, Sehn LH, Natkunam Y, Briones J, Advani R, Connors JM, Byrne GE, Levy R, Gascoyne RD, Lossos IS. Paraffin-based 6-gene model predicts outcome in diffuse large B-cell lymphoma patients treated with R-CHOP. Blood. 2008;111:5509–5514. doi: 10.1182/blood-2008-02-136374. [DOI] [PMC free article] [PubMed] [Google Scholar]
- Monti S, Savage KJ, Kutok JL, Feuerhake F, Kurtin P, Mihm M, Wu B, Pasqualucci L, Neuberg D, Aguiar RC, Dal Cin P, Ladd C, Pinkus GS, Salles G, Harris NL, Dalla-Favera R, Habermann TM, Aster JC, Golub TR, Shipp MA. Molecular profiling of diffuse large B-cell lymphoma identifies robust subtypes including one characterized by host inflammatory response. Blood. 2005;105:1851–1861. doi: 10.1182/blood-2004-07-2947. [DOI] [PubMed] [Google Scholar]
- Morrison VA, Weller EA, Habermann TM, Cassileth PA, Cohn JB, Gascoyne RD, Woda B, Fisher RI, Peterson BA, Horning SJ. Maintenance rituximab (MR) compared to observation (OBS) after R-CHOP or CHOP in older patients (pts) with diffuse large B-cell lymphoma (DLBCL): An Intergroup E4494/C9793 update. Journal of Clinical Oncology; Annual Meeting Proceedings Part 1; 2007. 8011. [Google Scholar]
- Moskowitz CHP, Horwitz S, Noy A, O’Connor O, Palomba M, Portlock C, Straus D, Chennin-Lessac S, Weaver A, Teruva-Feldstein J, Schoder H, Zelenetz A. Phase II Trial of Dose-Dense R-CHOP Followed by Risk-Adapted Consolidation with Either ICE or ICE and ASCT, Based upon the Results of Biopsy Confirmed Abnormal Interim Restaging PET Scan, Improves Outcome in Patients with Advanced Stage DLBCL. Blood. 2006;108:532a. [Google Scholar]
- Nyman H, Adde M, Karjalainen-Lindsberg ML, Taskinen M, Berglund M, Amini RM, Blomqvist C, Enblad G, Leppa S. Prognostic impact of immunohistochemically defined germinal center phenotype in diffuse large B-cell lymphoma patients treated with immunochemotherapy. Blood. 2007;109:4930–4935. doi: 10.1182/blood-2006-09-047068. [DOI] [PubMed] [Google Scholar]
- Pfreundschuh M, Trumper L, Osterborg A, Pettengell R, Trneny M, Imrie K, Ma D, Gill D, Walewski J, Zinzani PL, Stahel R, Kvaloy S, Shpilberg O, Jaeger U, Hansen M, Lehtinen T, Lopez-Guillermo A, Corrado C, Scheliga A, Milpied N, Mendila M, Rashford M, Kuhnt E, Loeffler M. CHOP-like chemotherapy plus rituximab versus CHOP-like chemotherapy alone in young patients with good-prognosis diffuse large-B-cell lymphoma: a randomised controlled trial by the MabThera International Trial (MInT) Group. Lancet Oncology. 2006;7:379–391. doi: 10.1016/S1470-2045(06)70664-7. [DOI] [PubMed] [Google Scholar]
- Pfreundschuh M, Schubert J, Ziepert M, Schmits R, Mohren M, Lengfelder E, Reiser M, Nickenig C, Clemens M, Peter N, Bokemeyer C, Eimermacher H, Ho A, Hoffmann M, Mertelsmann R, Trumper L, Balleisen L, Liersch R, Metzner B, Hartmann F, Glass B, Poeschel V, Schmitz N, Ruebe C, Feller AC, Loeffler M. Six versus eight cycles of bi-weekly CHOP-14 with or without rituximab in elderly patients with aggressive CD20+ B-cell lymphomas: a randomised controlled trial (RICOVER-60) Lancet Oncology. 2008;9:105–116. doi: 10.1016/S1470-2045(08)70002-0. [DOI] [PubMed] [Google Scholar]
- Repetto L, Fratino L, Audisio RA, Venturino A, Gianni W, Vercelli M, Parodi S, Dal Lago D, Gioia F, Monfardini S, Aapro MS, Serraino D, Zagonel V. Comprehensive Geriatric Assessment Adds Information to Eastern Cooperative Oncology Group Performance Status in Elderly Cancer Patients: An Italian Group for Geriatric Oncology Study. Journal of Clinical Oncology. 2002;20:494–502. doi: 10.1200/JCO.2002.20.2.494. [DOI] [PubMed] [Google Scholar]
- Rosenwald A, Wright G, Chan WC, Connors JM, Campo E, Fisher RI, Gascoyne RD, Muller-Hermelink HK, Smeland EB, Giltnane JM, Hurt EM, Zhao H, Averett L, Yang L, Wilson WH, Jaffe ES, Simon R, Klausner RD, Powell J, Duffey PL, Longo DL, Greiner TC, Weisenburger DD, Sanger WG, Dave BJ, Lynch JC, Vose J, Armitage JO, Montserrat E, Lopez-Guillermo A, Grogan TM, Miller TP, LeBlanc M, Ott G, Kvaloy S, Delabie J, Holte H, Krajci P, Stokke T, Staudt LM. The use of molecular profiling to predict survival after chemotherapy for diffuse large-B-cell lymphoma. New England Journal of Medicine. 2002;346:1937–1947. doi: 10.1056/NEJMoa012914. [DOI] [PubMed] [Google Scholar]
- Sehn LH, Donaldson J, Chhanabhai M, Fitzgerald C, Gill K, Klasa R, MacPherson N, O’Reilly S, Spinelli JJ, Sutherland J, Wilson KS, Gascoyne RD, Connors JM. Introduction of combined CHOP plus rituximab therapy dramatically improved outcome of diffuse large B-cell lymphoma in British Columbia. Journal of Clinical Oncology. 2005;23:5027–5033. doi: 10.1200/JCO.2005.09.137. [DOI] [PubMed] [Google Scholar]
- Sehn LH, Berry B, Chhanabhai M, Fitzgerald C, Gill K, Hoskins P, Klasa R, Savage KJ, Shenkier T, Sutherland J, Gascoyne RD, Connors JM. The revised International Prognostic Index (R-IPI) is a better predictor of outcome than the standard IPI for patients with diffuse large B-cell lymphoma treated with R-CHOP. Blood. 2007;109:1857–1861. doi: 10.1182/blood-2006-08-038257. [DOI] [PubMed] [Google Scholar]
- Sonneveld PVW, Biesma D, Holte H, VanMarwijk Kooij M, Kramer M, Wijermans P, Steijaert M, VanImhoff G, Lugtenburg P, Huijgens P, Eriksson E. Phase III Trial of 2-Weekly CHOP with Rituximab for Aggressive B-Cell Non-Hodgkin s Lymphoma in Elderly Patients. Blood. 2006;108:210a. [Google Scholar]
- The International Non-Hodgkin’s Lymphoma Prognostic Factors Project. A Predictive Model for Aggressive Non-Hodgkin’s Lymphoma. New England Journal of Medicine. 1993;329:987–994. doi: 10.1056/NEJM199309303291402. [DOI] [PubMed] [Google Scholar]
- Tirelli U, Balzarotti M, Uziel L, Ferreri A, Fratino L, Santoro A, Spina M. Comprehensive geriatric assessment (CGA)-adapted chemotherapy (CT) in elderly patients (>70 years) with diffuse large B-cell non-Hodgkin’s lymphoma (DLBCL). Journal of Clinical Oncology; 2007 ASCO Annual Meeting Proceedings; 2007. 19515. [Google Scholar]
- Winter JN, Weller EA, Horning SJ, Krajewska M, Variakojis D, Habermann TM, Fisher RI, Kurtin PJ, Macon WR, Chhanabhai M, Felgar RE, Hsi ED, Medeiros LJ, Weick JK, Reed JC, Gascoyne RD. Prognostic significance of Bcl-6 protein expression in DLBCL treated with CHOP or R-CHOP: a prospective correlative study. Blood. 2006;107:4207–4213. doi: 10.1182/blood-2005-10-4222. [DOI] [PMC free article] [PubMed] [Google Scholar]
- Yancik R, Wesley MN, Ries LA, Havlik RJ, Long S, Edwards BK, Yates JW. Comorbidity and age as predictors of risk for early mortality of male and female colon carcinoma patients: a population-based study. Cancer. 1998;82:2123–2134. [PubMed] [Google Scholar]
- Ziepert M, Hasenclever D, Kuhnt E, Glass B, Schmitz N, Pfreundschuh M, Loeffler M. Standard International Prognostic Index remains a valid predictor of outcome for patients with aggressive CD20+ B-cell lymphoma in the rituximab era. Journal of Clinical Oncology. 2010;28:2373–2380. doi: 10.1200/JCO.2009.26.2493. [DOI] [PubMed] [Google Scholar]