ABSTRACT.
Non-perinatal hypoxic–ischaemic encephalopathy (HIE) has varying anatomical patterns dependent on the type of insult, the degree and duration of cerebral hypoxia, or presence and degree of hypoperfusion. Profound insults can affect the entire cerebral cortex or just the perirolandic cortex, the cerebellum and the deep grey matter structures. Less severe insults may affect only the watershed regions. The objective of this article is to review the anatomical patterns of non-perinatal HIEs by MRI.
Non-perinatal hypoxic–ischaemic encephalopathy (HIE) can be a devastating neurological injury and prompt recognition of it can result in significant changes in patient management. HIE insults develop in varying regions of the brain depending on the severity and duration of hypoperfusion or hypo-oxygenation [1]. Brain parenchyma changes have corresponding MR signal characteristics that are often obvious but can be subtle [2]. It is important for radiologists to be aware of the variations in the appearance of HIE in order to be alert to the diagnosis in subtle cases, recognise unusual patterns and be aware of the clinical ramifications.
This review shows cases of HIE beyond the perinatal period. Aetiological factors and timing of imaging findings are delineated. The cases involve the usual HIE-specific neuroanatomical locations: the cerebral cortex, cerebellum, hippocampus, basal ganglia and thalamus. In addition, cases of HIE showing damage to the cerebral white matter and limbic system are demonstrated. Also, cases that mimic the appearance of HIE are presented. It is critical for a radiologist to be aware of potentially confounding cases.
Cerebral cortex
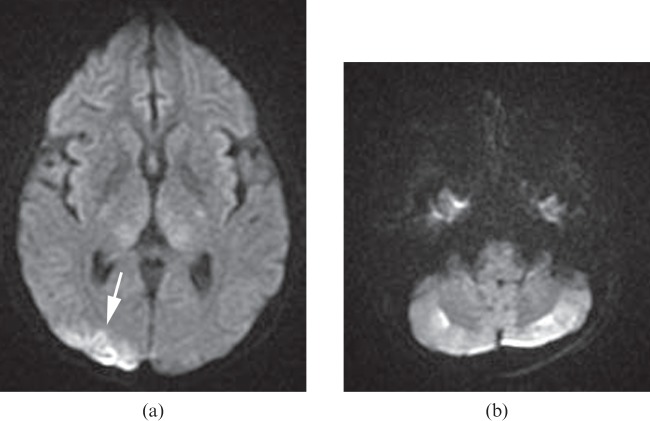
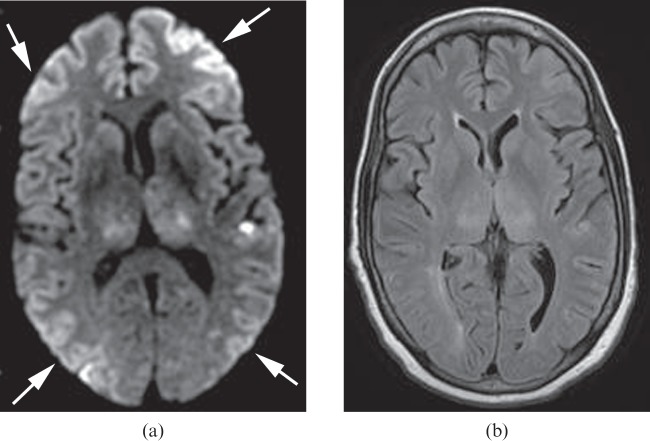
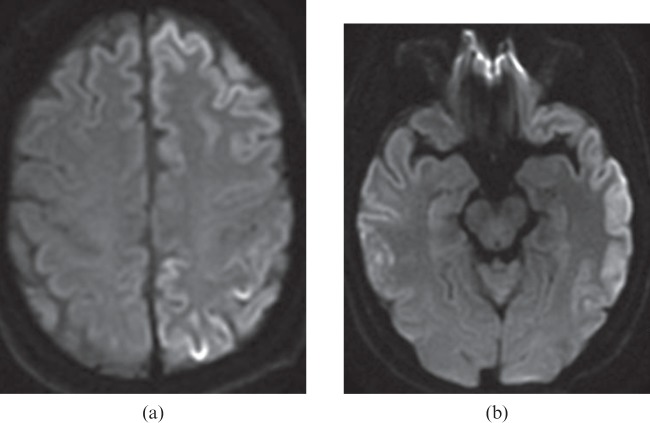
Mild cases of HIE, such as from mild or short-duration hypotension or brief cardiac arrest, are likely to demonstrate damage in the watershed zones (Figures 1 and 2) [3]. The watershed pattern is well known but the changes in HIE can present asymmetrically and this needs to be understood to avoid misdiagnosis (Figure 1).
Figure 1.
A 27-year-old female experienced sudden cardiac arrest in which her blood pressure decreased to non-palpable for 10 min. Diffusion-weighted image (a) shows high signal intensity areas in the cortical border zone between the right middle cerebral and posterior cerebral arteries, suggesting watershed infarcts (arrow). The apparent diffusion coefficient map (not shown) confirmed restricted diffusion in the corresponding area. There are also several small watershed infarcts in the cerebellar cortical regions bilaterally on the diffusion-weighted image (b).
Figure 2.
A 62-year-old female who sustained large fluid losses and subsequent hypotension during hepatic surgery 1 day previously. Diffusion-weighted image (a) shows multiple cerebral watershed infarcts (arrows). Fluid-attenuated inversion–recovery (FLAIR) image (b) shows no obvious signal abnormality in the corresponding areas. In addition, the more advanced changes of HIE are shown by the high signal lesions in the bilateral thalami and left temporal lobe. These are more conspicuous on the diffusion-weighted images than on the FLAIR images.
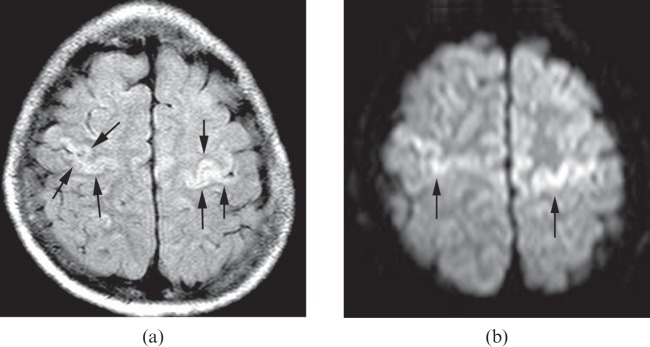
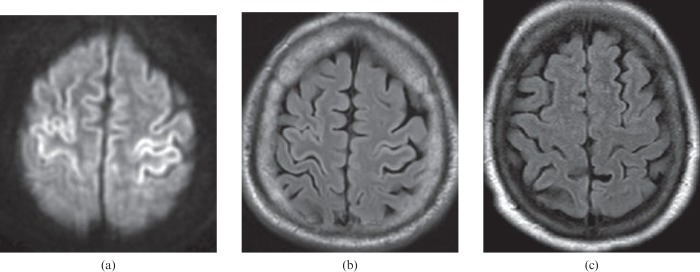
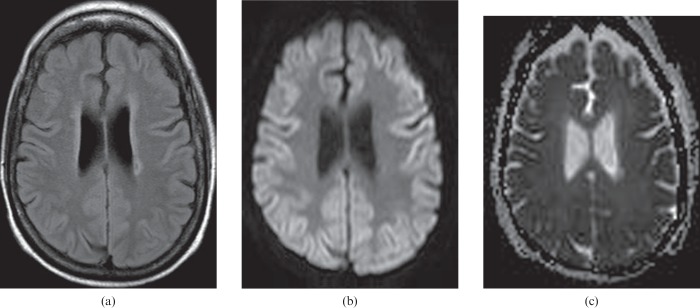
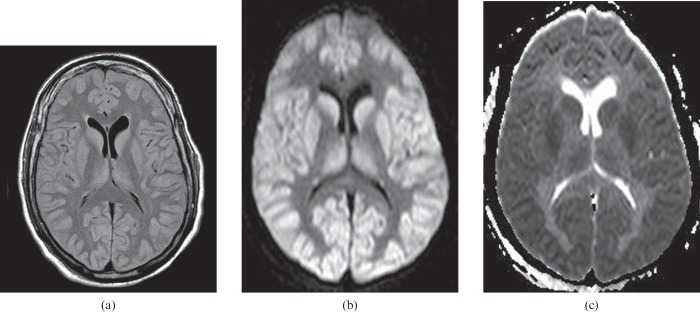
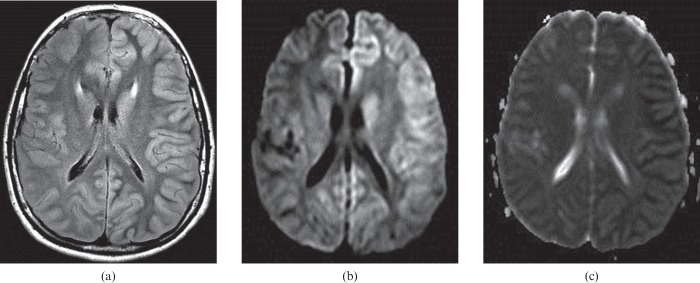
In moderate-to-severe cases of HIE, vulnerable areas are the perirolandic and occipital cortices (Figures 3 and 4) [4]. The cortical injury is easier to see on diffusion-weighted imaging (DWI), but subtle changes can also be identified on T2 fluid-attenuated inversion–recovery (FLAIR) imaging (Figure 4). In more severe cases of HIE, the effects may cause the entire cerebral cortex to swell (Figures 5–7) and eventually become necrotic [5]. In severe cases, the abnormality may be overlooked owing to the symmetric nature of the changes. This problem is well demonstrated on FLAIR imaging and DWI (Figure 5a,b). Visually, it should be noted that in these severe cases the apparent diffusion coefficient (ADC) maps demonstrate a pattern of very hypointense thickened grey matter (Figure 5c). The grey matter is mildly hyperintense to white matter on ADC maps in healthy individuals but this can flip-flop in cases of HIE (Figures 5c, 7c and 8c). Measuring the actual ADC values of the cortex can be useful when a patient has a potential history of a hypoxic–ischaemic insult and one is uncertain of the diagnosis. Of course, it is critical to know the time lapse between the event in question and the DWI acquisition, given that ADC values are time dependent in cases of stroke.
Figure 3.
A 10-year-old child who had respiratory and cardiac arrest secondary to tracheostomy tube obstruction after a motor vehicle accident. The fluid-attenuated inversion–recovery (FLAIR) image (a) and the diffusion-weighted image (b) show high signal intensity in perirolandic gyri (arrows). The apparent diffusion coefficient map (not shown) confirms the restricted diffusion in the corresponding areas. These findings are compatible with primary motor and sensory damages. It is important to closely evaluate the perirolandic gyri for this type of abnormality in cases of suspected hypoxic–ischaemic injury. It may be a subtle finding and the only finding present.
Figure 4.
A 60-year-old male who experienced a cardiorespiratory arrest and was without respiration for approximately 10 min. Restricted diffusion within the perirolandic cortex on the diffusion-weighted image (a) is compatible with hypoxic–ischaemic injury. The abnormality is not obvious on the fluid-attenuated inversion–recovery (FLAIR) image (b), but cortical thickening and minimal hyperintensity in the perirolandic cortex should be recognised when compared with a normal FLAIR image (c).
Figure 7.
A 69-year-old female who experienced a cardiorespiratory arrest. The findings of cortical injury are very subtle on the same-day MR examination (not shown), but obvious on the follow-up images (a–c) performed 2 days later. Fluid-attenuated inversion–recovery (FLAIR) image (a) shows mild cortical thickening and hyperintensity. Diffusion-weighted image (b) and apparent diffusion coefficient map (c) show diffuse cortical swelling and restricted diffusion throughout the cortex bilaterally. The patient died 3 days after cardiorespiratory arrest.
Figure 5.
A 45-year-old male who had severe cardiopulmonary failure secondary to sepsis. Fluid-attenuated inversion–recovery (FLAIR) (a) and diffusion-weighted (b) images show high signal intensity cerebral cortex, basal ganglia and thalami. The apparent diffusion coefficient map (c) shows restricted diffusion throughout all these grey matter structures. On conventional MRI (T1 and T2 weighted sequences), it is important to recognise the diffuse cortical abnormality, which may be indicated only by grey matter that appears too prominent owing to being slightly swollen and slightly increased in signal intensity.
Figure 8.
Images mimicking hypoxic–ischaemic encephalopathy are seen in a 13-year-old child who experienced seizures caused by familial hemiplegic migraine 1 day previously. Extensive left hemispheric cortical oedema is seen on the fluid-attenuated inversion–recovery image (a), and on the diffusion-weighted image (b).The apparent diffusion coefficient map demonstrates restricted diffusion in the cortex, confirming the presence of cytotoxic oedema and not vasogenic oedema (c). The MRI findings mimic hemispheric hypoxic–ischaemic injury, which could arise from several causes such as the presence of a high-grade internal carotid artery stenosis or occlusion with a foetal-origin posterior cerebral artery and no physiological anterior communicating artery. All the left hemispheric abnormality resolved on follow-up MRI (not shown).
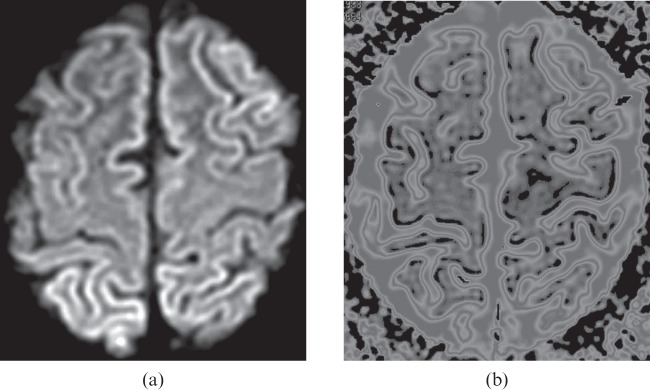
Though typical of HIE, the MR signal changes in the cortex are not specific to HIE and can be seen with other aetiologies such as recent seizure activity (Figure 8); encephalitis (Figure 9); Creutzfeldt–Jakob disease (CJD) (Figure 10); hypoglycaemia; hyperammonaemia; mitochondrial encephalomyopathy, lactic acidosis and stroke-like episodes (MELAS); and hyponatraemia [6,7,8]. These cases usually have patchy non-symmetrical abnormalities that do not involve the perirolandic or watershed zones. Particular patterns of involvement (e.g. the temporal lobe in herpes encephalitis) can be suggestive of an alternative diagnosis. Also, laboratory values can be critical to differentiate cases of hypoglycaemia, hyperammonaemia and hyponatraemia. Microbiological and cerebrospinal fluid analysis can help to determine the aetiology of encephalitis and CJD. However, biopsy may be needed (brain biopsy or even a muscle biopsy for MELAS).
Figure 9.
Images mimicking hypoxic–ischaemic encephalopathy are seen in a 20-year-old female with a diagnosis of Epstein–Barr virus encephalitis. Diffusion-weighted image (a) shows high signal intensity cerebral cortex bilaterally. The apparent diffusion coefficient (ADC) map (b) with the threshold value set at 6.00×10⁻⁴ mm2 s−1 shows obvious black areas along the cortex; the black voxels define the restricted diffusion (ADC<6.00×10⁻⁴ mm2 s−1) derived from cortical injury.
Figure 10.
A 61-year-old male with rapidly progressive dementia over 1 month. Creutzfeldt–Jakob disease was confirmed with cerebrospinal fluid studies positive for protein 14-3-3 and high total tau. The diffusion-weighted images (a,b) show bilateral left>right hemispheric hyperintense cortex that had restricted apparent diffusion coefficient values.
Cerebellum
The cerebellum can show damage that is often limited to the watershed zones in mild cases of HIE (Figure 1) and can be widespread in severe cases. Cerebellar Purkinje fibres are hypermetabolic and therefore sensitive to hypoxic injury [9].
Limbic system
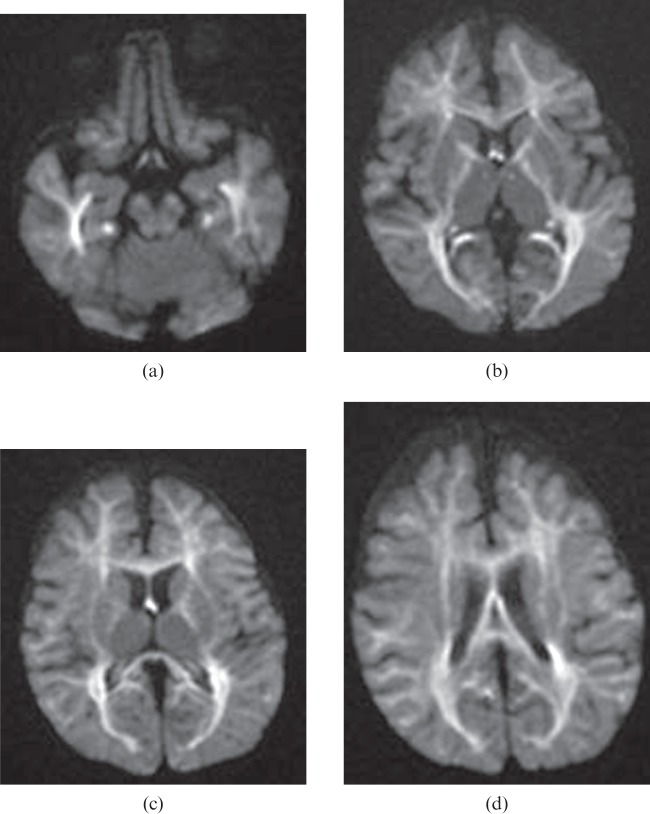
Infarction of the entire hippocampus can develop if the global ischaemic insult is severe (Figure 6) [10]. The fornix, cingulum and hippocampus can be simultaneously involved in severe global ischaemia (Figure 11) [11]. Fornix and hippocampal infarction can lead to memory deficits and amnesia [12].
Figure 6.
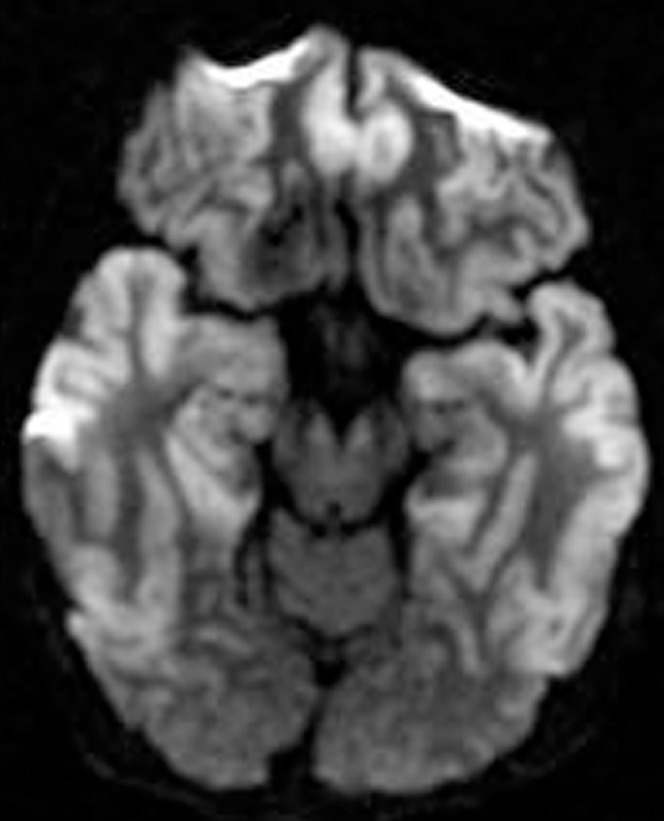
A 48-year-old male who had respiratory failure following oesophageal perforation. Diffusion-weighted image shows high signal intensity areas along the frontal and temporal cortices, including the hippocampi bilaterally.
Figure 11.
A 14-month-old child who had end-stage liver disease and experienced repeated episodes of respiratory failure and marked hypotension following sepsis. Diffusion-weighted images (a–d) show bilateral, symmetrical hyperintensities in the hippocampi, mammillothalamic tracts, fornices, cingula, internal capsules and the white matter including the corpus callosum. The apparent diffusion coefficient map (not shown) confirms restricted diffusion in the corresponding areas.
Basal ganglia and thalamus
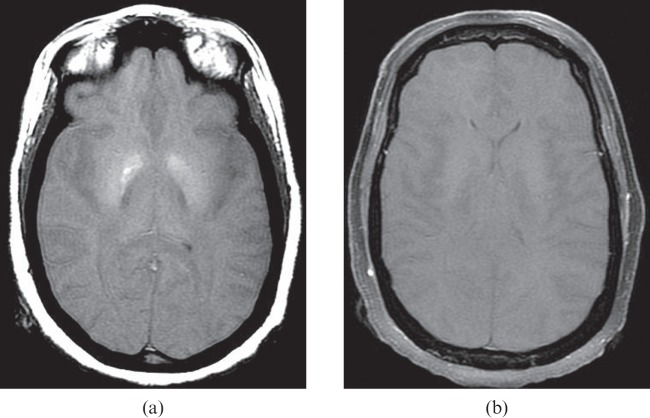
When global ischaemia affects the basal ganglia, usually the caudate and putamen are the most vulnerable (Figure 5) [13]. The globus pallidus can be affected selectively in unusual cases such as carbon monoxide poisoning and may also be affected in diffuse global damage (Figures 12 and 13) [14]. The thalamus is often damaged in global ischaemia (Figures 2 and 5) [13].
Figure 12.
A 48-year-old female who suffered massive pulmonary haemorrhage during an endobronchial procedure 1 day previously and subsequent cardiac arrest. T1 weighted image (a) shows hyperintensity in the globus pallidus bilaterally, compatible with necrosis. Post-contrast image (b) shows no intracranial enhancement, suggestive of brain death. Apparent diffusion coefficient mapping (not shown) confirmed diffuse brain infarction.
Figure 13.
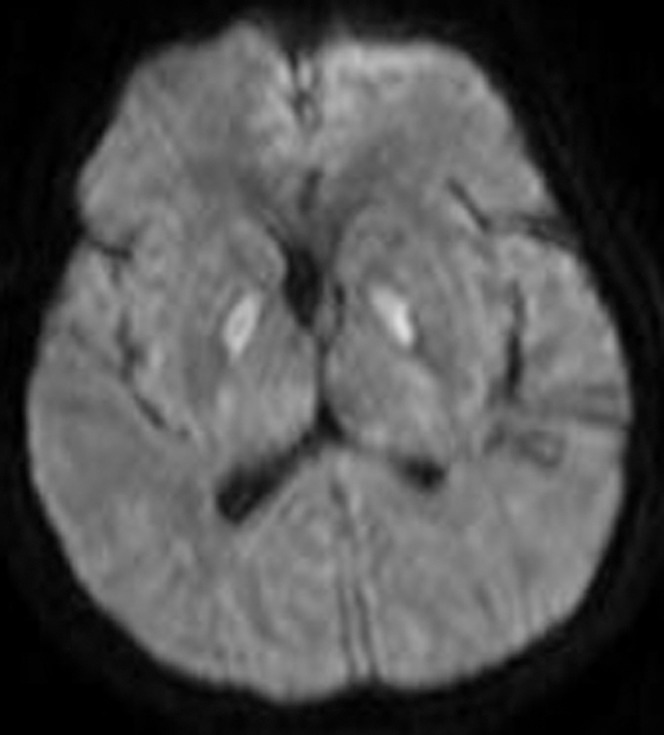
A 57-year-old female with respiratory arrest. The diffusion-weighted image demonstrates high signal in the globus pallidi bilaterally. Restricted diffusion is confirmed with the apparent diffusion coefficient map (not shown). This appearance is suggestive of carbon monoxide poisoning but can be seen owing to other aetiologies of hypoxic–ischaemic injury.
White matter
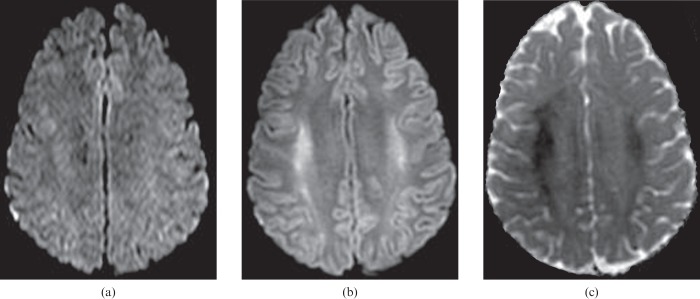
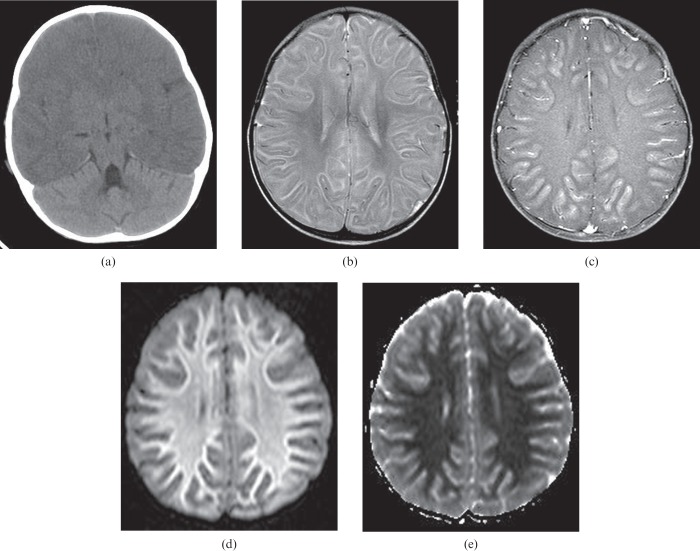
Global ischaemia will sometimes lead to demyelination and destruction of cerebral white matter (Figure 14), especially when hypotension complicates intensive care [1]. White matter involvement might be overlooked on conventional T2 weighted imaging because markedly oedematous grey matter may make the white matter appear to have relatively low signal intensity and to be normal in appearance. DWI and ADC mapping in this condition are helpful in recognising the white matter changes by clearly depicting the restricted diffusion (Figure 15). The white matter in unusual cases may also be affected after ischaemia without prominent grey matter involvement (Figure 11) [13]. Delayed white matter infarction is possibly due to the development of post-anoxic leukoencephalopathy (Figure 14) [15]. MRI of encephalitis in cases of severe white matter abnormality could be a confounding diagnostic consideration.
Figure 14.
A 24-year-old female experienced sudden cardiac arrest. Restricted diffusion in the motor strips, basal ganglia and hippocampi were found (not shown) on MRI performed on the same day, but there are no obvious signal changes in the white matter on the diffusion-weighted images (DWIs) (a). Follow-up DWI (b) and apparent diffusion coefficient map (c) performed 5 days later demonstrate interval progression of restricted diffusion involving the white matter of the corona radiata (not shown) and the centrum semiovale bilaterally. There is also new restricted diffusion in the splenium of the corpus callosum (not shown).
Figure 15.
A 1-year-old child who experienced a generalised seizure and respiratory failure with images performed 3 days (a) and 5 days (b–e) after the seizure. Unenhanced CT scan (a) reveals diffuse hypoattenuation of the cerebral hemisphere with sparing of the cerebellum, suggesting redistribution of blood to the posterior circulation and the presence of subsequent diffuse cerebral oedema. T2 weighted (b) and post-contrast T1 weighted (c) images predominantly show extensive grey matter injury. Diffusion-weighted image (d) and apparent diffusion coefficient map (e) show obvious restricted diffusion throughout the cerebral white matter even though the findings of the white matter injury are not clearly demonstrated on the conventional MR images.
Conclusion
Our cases demonstrate that the anatomical site of tissue injury varies following a concept known as selective vulnerability. Particular sites with high energy demands face cytotoxic crisis when presented with mandatory anaerobic metabolism due to low oxygen delivery [1].
It is well known that DWI during the early phase after cerebral hypoxia is superior to conventional MRI for detecting ischaemia and can be used as a predictor of clinical outcome [16]. However, even severe cases of HIE may have normal or subtle findings on DWI initially (Figures 7 and 14). That is why a radiologist must be very aware of the potential diagnosis, know the patterns that are seen and be able to detect subtle findings of diffuse HIE. However, measurement of ADC values and MR examinations over time when there is difficulty making the diagnosis initially can be crucial when evaluating HIE. Early detection will save time and provide more timely guidance to the clinical team concerning overall prognosis and give the patient and family better information about recovery [16].
Subtle imaging findings pointed out in this presentation aid the radiologist in making HIE diagnosis when the diagnosis might otherwise be missed.
References
- 1.Huang BY, Castillo M. Hypoxic-ischemic brain injury: imaging findings from birth to adulthood. Radiographics 2008;28:417–39. [DOI] [PubMed] [Google Scholar]
- 2.Tha KK, Terae S, Yamamoto T, Kudo K, Takahashi C, Oka M, et al. Early detection of global cerebral anoxia: improved accuracy by high-b-value diffusion-weighted imaging with long echo time. AJNR Am J Neuroradiol 2005;26:1487–97. [PMC free article] [PubMed] [Google Scholar]
- 3.Kjos BO, Brant-Zawadzki M, Young RG. Early CT findings of global central nervous system hypoperfusion. AJR Am J Roentgenol 1983;141:1227–32. [DOI] [PubMed] [Google Scholar]
- 4.Rademakers RP, van derKnaap MS, Verbeeten B, Jr, Barth PG, Valk J. Central cortico-subcortical involvement: a distinct pattern of brain damage caused by perinatal and postnatal asphyxia in term infants. J Comput Assist Tomogr 1995;19:256–63. [PubMed] [Google Scholar]
- 5.Christophe C, Clercx A, Blum D, Hasaerts D, Segebarth C, Perlmutter N. Early MR detection of cortical and subcortical hypoxic-ischemic encephalopathy in full-term infants. Pediatr Radiol 1994;24:581–4. [DOI] [PubMed] [Google Scholar]
- 6.Moritani T, Smoker WR, Sato Y, Numaguchi Y, Westesson PL. Diffusion-weighted imaging of acute excitotoxic brain injury. AJNR Am J Neuroradiol 2005;26:216–28. [PMC free article] [PubMed] [Google Scholar]
- 7.Chan R, Erbay S, Oljeski S, Thaler D, Bhadelia R. Hypoglycemia and diffusion-weighted imaging. J Comput Assist Tomogr 2003;27:420–3 [DOI] [PubMed] [Google Scholar]
- 8.Nardone R, McCoy M, Kunz AB, Kraus J, Staffen W, Ladurner G, et al. Hyponatremic encephalopathy mimicking hypoxic-ischemic encephalopathy. Clin Neuroradiol 2010;20:243–6. [DOI] [PubMed] [Google Scholar]
- 9.Castillo M. Selective vulnerability and the cerebellum in neonates. AJNR Am J Neuroradiol 2007;28:20–1. [PMC free article] [PubMed] [Google Scholar]
- 10.Moretto MB, Arteni NS, Lavinsky D, Netto CA, Rocha JB, Souza DO, et al. Hypoxic-ischemic insult decreases glutamate uptake by hippocampal slices from neonatal rats: prevention by guanosine. Exp Neurol 2005;195:400–6. [DOI] [PubMed] [Google Scholar]
- 11.Barkovich AJ, Miller SP, Bartha A, Newton N, Hamrick SE, Mukherjee P, et al. MR imaging, MR spectroscopy, and diffusion tensor imaging of sequential studies in neonates with encephalopathy. AJNR Am J Neuroradiol 2006;27:533–47. [PMC free article] [PubMed] [Google Scholar]
- 12.McMackin D, Cockburn J, Anslow P, Gaffan D. Correlation of fornix damage with memory impairment in six cases of colloid cyst removal. Acta Neurochir 1995;135:12–18. [DOI] [PubMed] [Google Scholar]
- 13.Arbelaez A, Castillo M, Mukherji SK. Diffusion weighted MR imaging of global cerebral anoxia. AJNR Am J Neuroradiol 1999;20:999–1007. [PMC free article] [PubMed] [Google Scholar]
- 14.Sener RN. Acute carbon monoxide poisoning: diffusion MR imaging findings. AJNR Am J Neuroradiol 2003;24:1475–7. [PMC free article] [PubMed] [Google Scholar]
- 15.Andronikou S, Van Toorn R. The DWI ‘reversal sign’ of white matter hypoxic ischaemic injury in older children: an unusual MRI pattern for age. Pediatr Radiol 2009;39:293–8. [DOI] [PubMed] [Google Scholar]
- 16.Els T, Kassubek J, Kubalek R, Klisch J. Diffusion-weighted MRI during early global cerebral hypoxia: a predictor for clinical outcome? Acta Neurol Scand 2004;110:361–7. [DOI] [PubMed] [Google Scholar]


