Abstract
HLM006474 was identified using a computer-based virtual screen and the known crystal structure of the DNA bound E2F4/DP2 heterodimer. Treatment of multiple cell lines with HLM006474 resulted in the loss of intracellular E2F4 DNA-binding activity as measured by electrophoretic mobility shift assay within hours. Overnight exposure to HLM006474 resulted in down regulation of total E2F4 protein as well as known E2F targets. The effects of HLM006474 treatment on different cell lines varied, but included a reduction in cell proliferation and an increase in apoptosis. HLM006474 induced apoptosis in a manner distinct from cisplatin and doxorubicin. E2F4-null MEFs were less sensitive than wildtype counterparts to the apoptosis-inducing activity of the compound revealing its biological specificity. A375 cells were extremely sensitive to the apoptosis-inducing activity of the compound in two-dimensional culture and HLM006474 was a potent inhibitor of melanocytes proliferation and subsequent invasion in a three-dimensional tissue culture model system. Together, these results suggest that interference with E2F activity using small molecules may have clinical application in cancer therapy.
INTRODUCTION
The E2F/Rb pathway is central to the regulation of the mammalian cell cycle, and thus, it appears a reasonable target for the development of chemotherapeutic agents (1–3). The E2F family is composed of nine members with various biological roles (4–6). E2F1 is the best studied member of the family and has been shown to have numerous and even opposing roles in cell growth control depending on the context of experimentation (1–3). In the context of drug-induced apoptosis of highly transformed cells, E2F1 is downstream target of the ATM/ATR signaling pathway (7) and contributes significantly to the apoptotic activity of DNA damaging drugs and cyclin dependent kinase inhibitors (7). In contrast, E2F4 -- the most abundant member of the E2F family -- contributes to survival in the context of treatment with chemotherapeutic drugs or cdk inhibitors (8–11).
While individual members of the E2F family have specialized roles, a variety of complementary approaches have shown that down regulation of total intracellular E2F activity can lead to apoptosis (12), growth arrest (13, 14) or both (15). These observations suggest that small molecules that would inhibit the DNA-binding activity of E2F might have a significant benefit in cancer therapy. We have used the known crystal structure of the DNA bound E2F4/DP2 heterodimer to guide a computational screen for small molecules that might inhibit this interaction (16). One small molecule, HLM006474, emerged with in vivo activity. This manuscript describes an initial characterization of HLM006474’s biological activities in a number of commonly examined cancer cell lines. HLM006474 was particularly active against a melanocyte cell line, A375. In two-dimensional culture, A375 cells were extremely sensitive to the apoptosis-inducing activity of the compound and in a three-dimensional tissue culture model system HLM006474 was a potent inhibitor of A375 proliferation and invasion.
MATERIALS AND METHODS
Computer Docking and Chemical Synthesis
Details of the virtual screen and chemical synthetic strategy are provided in the Supplementary Material and Methods.
Cell lines and drug treatments
An expanded description of the cell lines used and the drug treatments is provided in the Supplementary Material.
Biochemical Assays
Electrophoretic mobility shift assays (EMSAs) were performed utilizing 20 µg of whole cell extract and an 32P-labeled oligonucleotide probe, as previously described (17). Antibodies used in supershift experiments were: E2F4 (mouse monoclonal 2–12E8(18), gift from J. Lees, MIT), Rb (Calbiochem; OP28), p107 (Santa Cruz Biotechnology; SC-318x), p130 (Santa Cruz Biotechnology; SC-317x), E2F1 (Santa Cruz Biotechnology; SC-193x), E2F2 (Santa Cruz Biotechnology; SC-633x), E2F2 (NeoMarkers, MS-264-s), E2F3 (Santa Cruz Biotechnology; SC-879x), E2F3 (Santa Cruz Biotechnology; SC-878x). EMSA signals were captured with a Storm PhosphoImager and band intensities quantified with ImageQuant Software. Quantitative EMSA assays were performed in triplicate. Western blots utilized 50 µg of whole cell extract per lane as previously described (8, 9, 19). Primary antibodies used in these studies consisted of E2F4 (Santa Cruz Biotechnology; SC-1082), E2F1 (Santa Cruz Biotechnology; SC-251), β-actin (Sigma; A5441), PARP (Cell Signaling; #9542), cyclinD3 (BD Pharmingen; 14781A), cyclinA (monoclonal gift from E. Leof, Mayo Clinic Cancer Center(20)), p53 (BD Pharmingen; 554293), Bax (Santa Cruz Biotechnology; SC-493), Mcl-1 (Santa Cruz Biotechnology; SC-819), p107 (Santa Cruz Biotechnology; SC-318), and p130 (Santa Cruz Biotechnology; SC-317). Detection of proteins was accomplished using horseradish-peroxidase-conjugated secondary antibodies and enhanced chemiluminescence (ECL) purchased from Amersham.
Cell cycle, apoptosis and viability analysis
Cells were detached from culture plates by trypsin treatment, washed twice with PBS, and fixed in 70% ethanol. Fixed cells were washed twice with PBS and treated with RNase A and propidium iodide (PI). PI staining was examined using a Becton-Dickinson FACScan instrument and Cell Quest software. TUNEL assay for apoptosis utilized a Pharmingen APO-BRDU Kit (8, 9, 19). MTS (3-(4, 5-dimethylthiazol-2-yl)-5-(3-carboxymethoxyphenyl)-2- (4-sulfophenyl)-2H-tetrazolium, inner salt) assays were conducted using a CellTiter 96® AQueous One Cell Proliferation Assay Kit (Promega). More details are provide in the Supplementary Materials.
Three-dimensional skin reconstruction model
Culture inserts of differentiated full-thickness 3D skin reconstruction model of A375 melanoma cells were purchased from MatTek (Ashland, MA). These were prepared by culturing mixed suspensions of normal human epidermal keratinocytes and A375 cells (1:10 ratio) on fibroblast contracted collagen gels and allowing differentiation for approximately one week in serum free media to form a 3D skin-like structure. These cultures were treated with 0, 40 or 80 µM 6474 and harvested after 0, 2, 5, 8, 12, 16 and 20 days.
RESULTS
Identification and synthesis of HLM006474
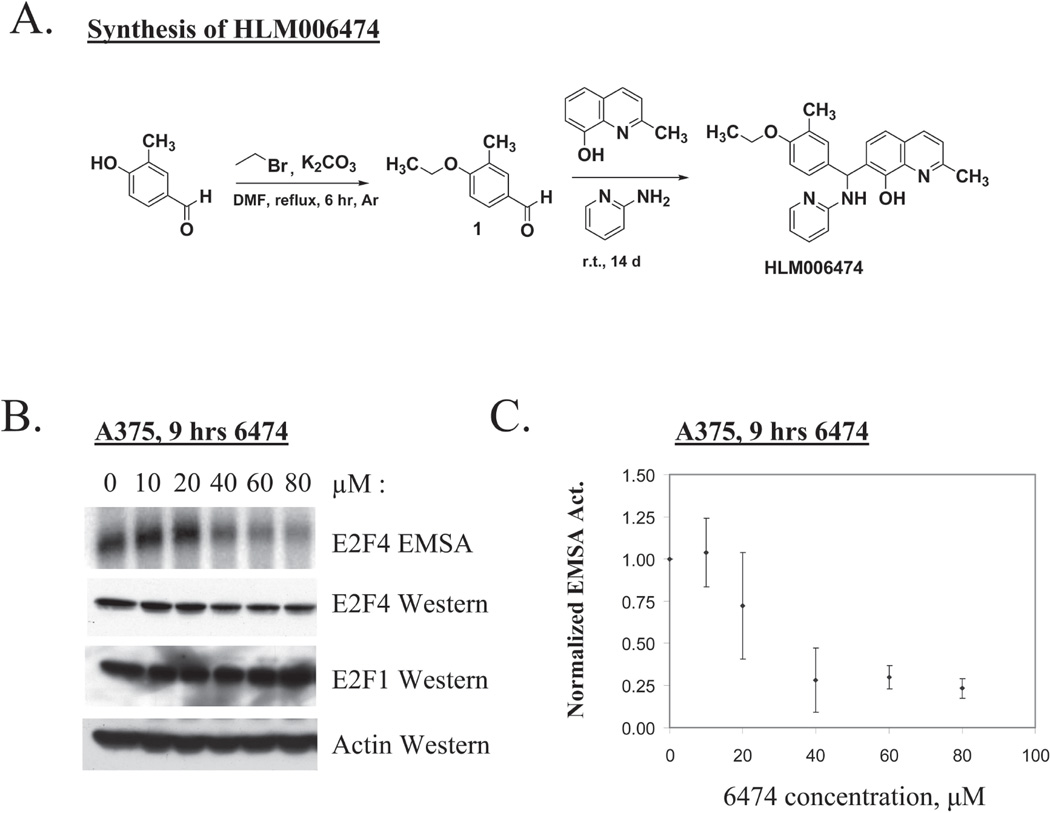
Grid-based Ligand Docking from Energetics (GLIDE, Schrődinger, Portland, OR) was used to screen a 20,000 compound 3D chemical database (from ChemDiv, Inc) (21, 22) for putative interactions with the known crystal structure of the E2F4/DP2 heterodimer (16). Four-hundred small molecules emerged from the docking studies with predicted free energies ranging from −10.95 to −6.35 kcal/mol. These four hundred high scoring molecules were screened for the ability to inhibit E2F4 DNA-binding at 20 µM in standard E2F EMSAs (23). STAT3 EMSAs were used as negative control to insure that inhibition was E2F-specific (24). Incubation of these compounds with NIH-3T3 protein extracts identified ten compounds with potential E2F4-inhibitory activity. To measure activity against a human cancer cell line MCF-7 cells were treated with these ten compounds in culture and inhibition of E2F4 DNA-binding activity determined by EMSA. Only one of the ten compounds, HLM006474, demonstrated measurable activity in vivo (data not shown). HLM006474 was synthesized at a large scale as a pure sample (as described in the Materials and Methods). The chemical synthesis and structure of HLM006474 are shown in Fig 1A. HLM006474 is not specific to E2F4 and appears to inhibit binding by all E2F complexes (see Supplementary Fig S1 and S2). However, because E2F4 is the predominant E2F species present in cellular extracts, as measured by EMSA (Fig S2), and because it has previously been shown that downregulation of E2F4 can predispose to chemotherapy-induced apoptosis (8), the remaining report focuses on the biological activity of pure HLM006474 as it relates to inhibition of E2F4.
Figure 1. HLM006474 inhibits E2F4 DNA-binding in vivo.
A. The synthesis scheme and chemical structure of HLM006474 (Formula C24H25N3O2, MW 399.5).
B. Human A375 melanocytes were treated for 9-hrs with the indicated concentration of HLM006474 (6474). Whole cell extracts were prepared and total E2F4 activity determined by EMSA (top panel). The identity of the E2F4 complex is demonstrated in Supplementary Fig 1. Identical extracts were examined in westerns using the indicated antibodies to E2F4 and E2F1. The actin western serves as a loading control.
C. PhosphoImager EMSA results from multiple experiments are quantified and plotted. Signal intensities are normalized to the untreated sample. The error bars represent the standard deviation from the mean. Results reveal an in vivo IC50 of 29.8 µM (± 7.6 µM) for A375 cells.
HLM006474 inhibits E2F4 activity in vivo
The E2F/Rb pathway is disrupted in virtually ever case of melanoma, and thus, we sought to determine whether HLM004674 would have activity in a melanoma model. To this end, A375 cells, which represent a commonly used melanoma cell line, were treated for 9-hrs with various concentrations of HLM006474 to determine if the compound would have activity in vivo. Whole cell extracts of treated cells were prepared and the DNA-binding activity of E2F4 measured by EMSA. Fig 1B demonstrates that at 10 and 20-µM concentrations HLM006474 has little effect on E2F4 DNA-binding activity in A375 cells; however at 40-µM E2F4 inhibition is clearly apparent and increases at 60- and 80-µM concentrations. Since the observed loss of E2F4 DNA-binding activity could be the result of down regulation of E2F4 protein, we performed Western blots on the same samples used for EMSA. We find that 9-hrs of treatment with HLM006474 does not significantly affect the expression of E2F4 or E2F1—demonstrating that the diminished E2F4 signal observed by EMSA is not due to decreased protein expression. Likewise, the expression of E2F1 was not affected by the compound at 9-hrs. Actin served as a loading control in these experiments and in those that follow.
PhosphoImager EMSA signals from four independent experiments were quantified using ImageQuant and the results are graphed in Fig 1C. The apparent IC50 (drug concentration required to reduce total E2F4 DNA-binding activity by 50% of untreated cells was calculated using the Statistical Analysis System (Proc Probit). Data indicate an in vivo IC50 of 29.8 µM (± 7.6 µM). In the experiments that follow 40-µM drug was used as standard HLM006476 concentration since that concentration of drug should reduce E2F4 activity by 50–75% and should limit off target effects.
HLM006474 treatment leads to downregulation of total E2F4 protein
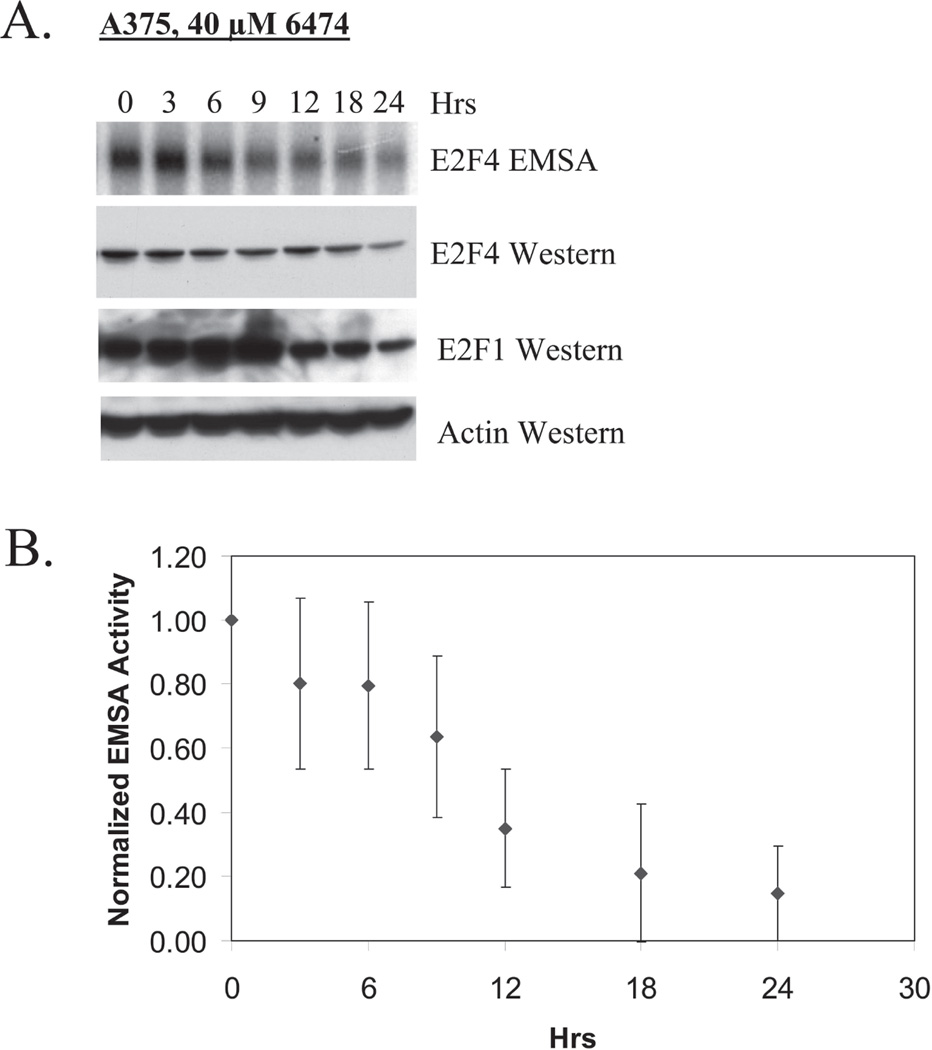
To determine the activity of HLM006474 over time, A375 cells were treated with 40-µM of compound and examined at 0-, 3-, 6-, 9-, 12-, 18- and 24-hrs by EMSA and western (Fig 2). With a single 40-µM dose, inhibition of E2F4 DNA-binding activity became apparent 9-hrs following treatment and persists for up to 24-hrs. By 24-hrs a decrease in total E2F4 protein became apparent -- suggesting that inhibition of E2F4 DNA-binding may predispose E2F4 to degradation. The level of pro-apoptotic E2F1 rises at early time points, but is diminished at 24-hrs. EMSA activities from A375 cells treated with HLM006474 were quantified using ImageQuant and the results are plotted in Fig 2B. This analysis indicates that half of the E2F DNA-binding activity is lost between 9- and 12-hrs after 40 µM HLM006474 treatment. The observation that HLM006474 downregulates total E2F4 protein was not anticipated; however it may contribute to the lasting biological effect of the compound. Collectively, these data indicate that HLM006474 inhibits E2F4 activity through inhibition of its DNA-binding activity and down regulation of its expression.
Figure 2. HLM006474 treatment leads to down regulation of total E2F4 protein.
A. A375 cells were treated with 40 µM HLM006474 and EMSA and Western analyses performed at the indicated time intervals.
B. EMSA results from four independent experiments (as in A) were quantified and averages plotted as a function of time of treatment. The error bars represent the standard deviation from the mean.
HLM006474 can induce apoptosis
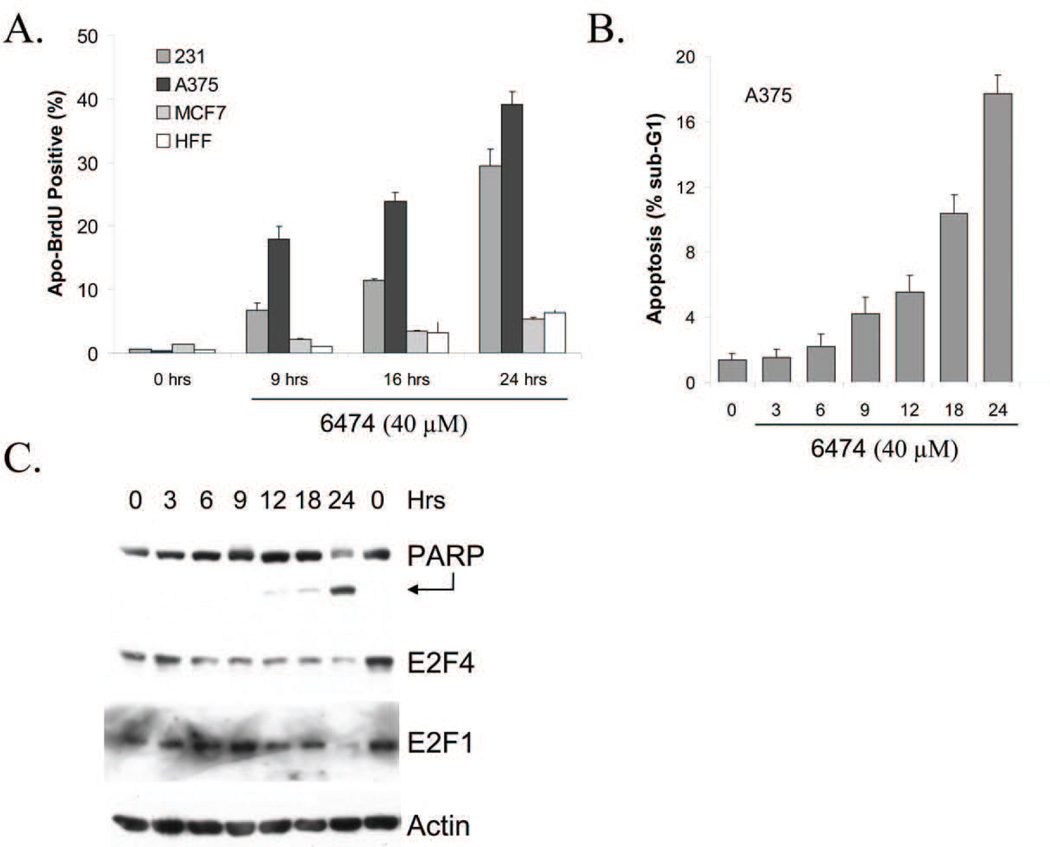
The preliminary data described above strongly suggest that HLM006474 might serve as an effective chemotherapeutic agent. To examine its effect on a range of commonly studied cell lines, we utilized standard MTS assays to quantify cell viability following HLM006474 treatment. The results of these assays clearly indicate that HLM006474 decreases the number of viable cells over the experimental time course (see supplementary Fig S3). In no case does the compound appear to increase proliferation, as might occur if depression of E2F activity would be sufficient to induce cellular proliferation. To determine if treatment with HLM006474 contributes to apoptosis, A375, MDA-MB-231 (231), MCF-7 and human foreskin fibroblasts (HFF) cells were treated with 40-µM HLM006474 for 24-hrs and subjected to a FACS based terminal deoxynucleotidyl transferase (TUNEL) assay (Apo-BrdU Kit from BD Pharmingen). Fig 3A reveals a dramatic induction of apoptosis in the A375 and 231 cell lines. In contrast, HLM006474 did not induce an obvious increase in apoptosis in HFF or MCF-7 cells.
Figure 3. HLM006474 induces apoptosis in multiple cell lines.
A. A375, MD-MBA-231 (“231”), MCF-7 and HFFs were treated with 40 µM HLM006474 for various times as indicated. Levels of apoptosis were determined using an Apo-BrdU TUNEL assay (BD Pharmingen).
B. A375 cells were treated with 40 µM HLM006474 for various times as indicated. Levels of apoptosis were determined based upon sub-G1 DNA content.
C. A375 cells were treated as in B. Levels of PARP cleavage, E2F4, and E2F1 were determined by Western blotting. Actin served as a loading control.
To further examine the timing of HLM006474-induced apoptosis, A375 cells were treated with 40-µM HLM006474, harvested and fixed at various time periods. Cells were then stained with propidium iodide to examine cell cycle status as estimated by flow cytometry. While no other obvious cell cycle effects were observed (data not shown) Fig 3B highlights the significant increase in sub-G1 DNA content of the cells beginning approximately 9-hrs following HLM006474 treatment. Likewise, PARP cleavage (Fig 3C) indicates significant apoptosis by 12-hrs following HLM006474 treatment. Thus, HLM006474-induced apoptosis appears to temporally follow the down regulation of E2F4 DNA-binding and be largely coincident with E2F4 protein down regulation (see Fig 2B). Experiments described in supplementary Fig. S4 demonstrate that melanoma cell lines with multiple drug resistance are also sensitive to treatment with HLM006474. Taken together, these results demonstrate that HLM006474 is a potent inducer of apoptosis.
HLM006474 treatment leads to apoptosis in a manner distinct from traditional chemotherapeutic drugs
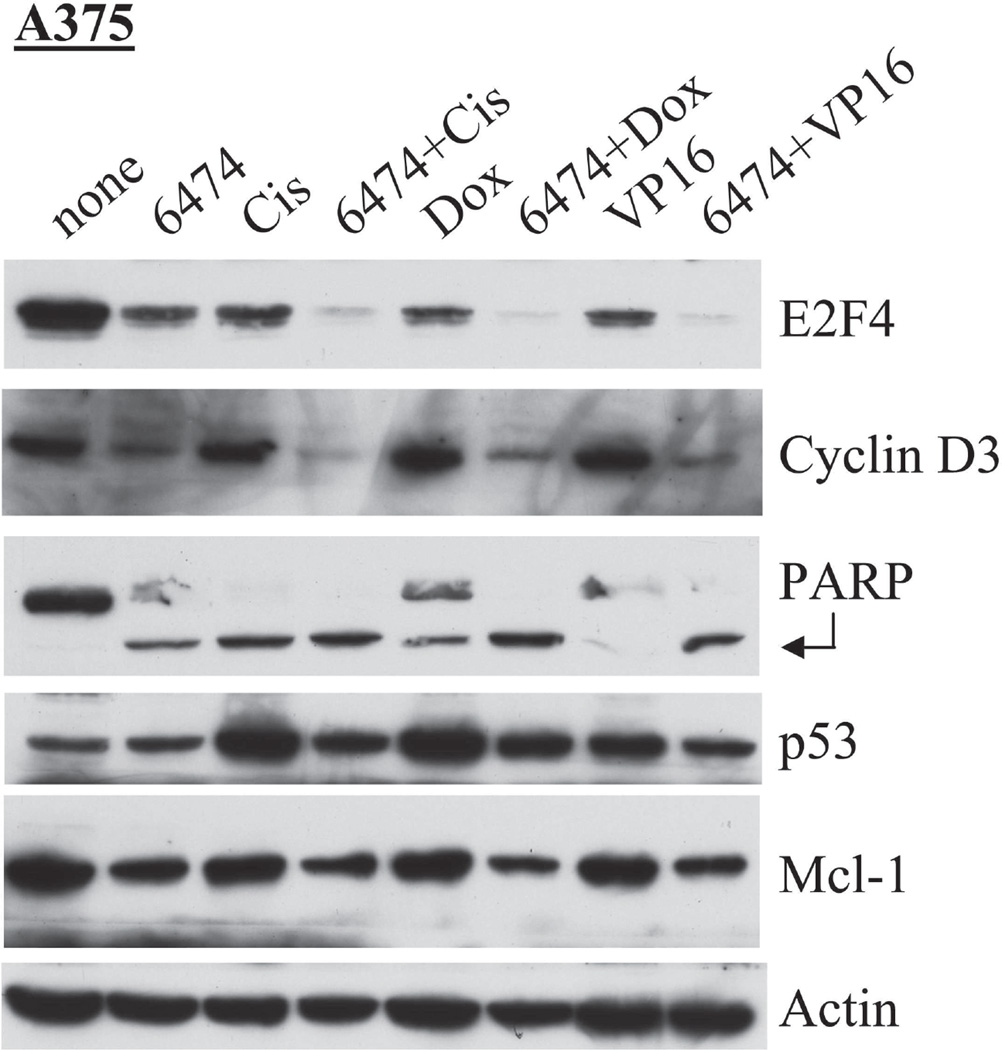
To compare the mechanism of HLM006474-induced apoptosis with that of several standard DNA damaging drugs, A375 cells were treated for 24-hrs with 40-µM HLM006474, 10 µM cisplatin, 10 nM doxorubicin, 10 µM VP16 or with two-drug combinations. We have previously shown that these chemotherapeutic drugs lead to a modest repression of E2F4 expression (in several cell lines), and that E2F4 deficiency leads to an increased susceptibility to the action of these drugs (8). As expected, Fig 4 reveals that each of these drugs individually reduced E2F4 levels in A375 cells after 24-hrs of treatment. However, every two-drug combination essentially eliminated E2F4 expression; suggesting that HLM006474 may synergize with these various drugs in the elimination of E2F4 activity.
Figure 4. HLM006474 treatment leads to apoptosis in a manner distinct from traditional chemotherapeutic drugs.
A375 cells were treated 24-hrs with 40-µM HLM006474, 10 µM cisplatin, 10 nM doxorubicin or 10 µM VP16 or with combinations and Western analyses performed with the antibodies as indicated. The arrow highlights cleavage PARP, which can be an indicator of apoptosis.
We have previously shown that cyclin D3 promoter is upregulated upon serum stimulation dependent upon an E2F site at position −143 to −135 (25). Fig 4 reveals that HLM006474 treatment significantly reduces cyclin D3 protein expression, thus supporting the hypothesis that HLM006474 is blocking at least a subset of E2F-regulated genes. Treatment with the traditional chemotherapeutics cisplatin, doxorubicin and VP16, in contrast, had little effect on cyclin D3 (Fig 4) or other cell cycle factors (data not shown). Westerns for PARP and the cleaved/activated form of PARP revealed that HLM006474 is a potent inducer of PARP cleavage, with no synergy between HLM006474 and the other drugs observed at these concentrations.
A Western against p53 was also performed to determine if p53 might play a role in HLM006474-induced apoptosis (Fig 4). As expected, the traditional chemotherapeutic agents each induced p53 expression; however HLM006474 did not (in fact, it may block p53 induction in A375 cells). Mcl-1, a pro-survival member of the Bcl-2 family, is known to be E2F regulated (26, 27). Western blots for Mcl-1 suggest that HLM006474 may slightly repress Mcl-1 in A375 cells. These results suggest that apoptosis induced by HLM006474 acts through a mechanism distinct from other traditional chemotherapies and may therefore be useful in malignancies that have become resistant to drugs that function through these pathways.
HLM006474 activity is partially dependent on E2F4
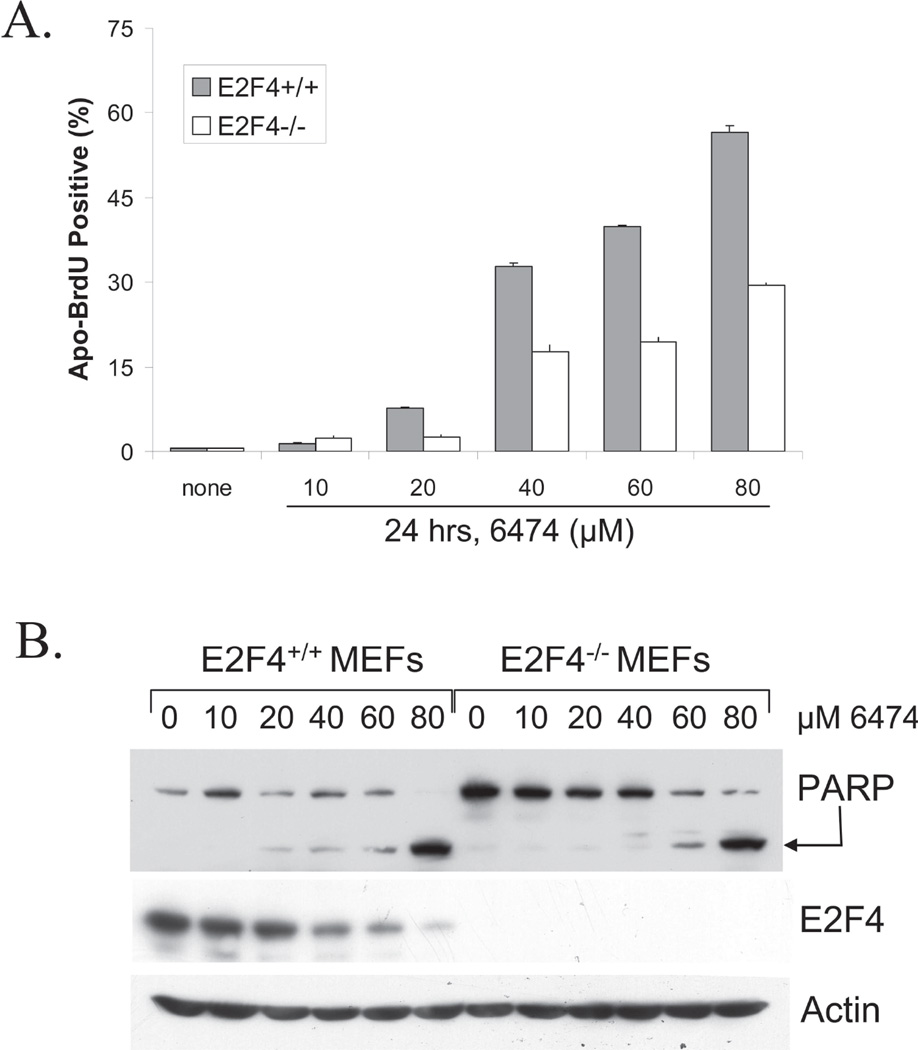
To determine if the effect of HLM006474 is dependent upon E2F4, we compared the HLM006474 response of immortalized MEFs derived from E2F4-deficient mice with MEFS derived from wildtype siblings. Fig 5A demonstrates that HLM006474 induces a two-fold increase in the level of apoptosis in WT cells as compared to that of E2F4-deficient cells. We have found these same E2F4-deficient MEFs to be more sensitive to every other drug that we have ever tested (8), thus the resistance to HLM006474 is even more convincing. The finding that E2F4-null MEFs are affected by HLM006474 suggests that E2F4 is not the sole target and that down regulation of additional E2Fs likely contributes to cell death. This is consistent with the biochemical evidence (supplementary Figs S1 and S2) that HLM006474 inhibits all E2F family members. Fig 5B demonstrates that PARP cleavage is evident in E2F4 proficient MEFs even as low as 20 µM HLM006474, whereas 60 µM HLM006474 is required to detect PARP cleavage in E2F4-deficient MEFs. Collectively, these data indicate that apoptosis induced by HLM006474 is in part dependent on E2F4.
Figure 5. HLM006474 activity is partially dependent on E2F4.
A. MEFS derived from sibling WT and E2F4−/− mice were treated for 24-hrs with the indicated doses of HLM006474. Apoptosis was determined using ApoBrdU (BD Pharmingen).
B. MEFS derived from sibling WT and E2F4−/− mice were treated as in A subjected to western blotting using a PARP antibody or E2F4 antibody. PARP cleavage (as indicated by the arrow) is an independent measure of apoptosis.
HLM006474 inhibits A375 proliferation in a three-dimensional model system
Given the biological and biochemical response of A375 cells to HLM006474 in cell culture, we postulated that this compound may inhibit malignant growth in a three-dimensional skin model of A375 invasion. In this model, the highly metastatic A375 melanocytes were mixed with normal human keratinocytes and seeded on fibroblast-contracted collagen gels. The mixed cells were then induced to differentiate in serum free media to form three-dimensional, highly differentiated, full thickness skin-like tissues. After seven days of differentiation the cells were then treated with 0 (DMSO carrier alone), 40 or 80 µM HLM006474. The three-dimensional models were then cultured for 2, 5, 8, 12, 16 and 20 days. At the appointed time, 3D cultures were fixed in formalin, paraffin embedded, sectioned and either stained with H&E or processed for immunohistochemistry (IHC) using antibodies against S-100 to measure expression of a melanocyte marker, E2F4 to determine if it were down regulated as in 2D culture, activated caspase-3 to measure apoptosis and Ki-76 to measure the proliferative index.
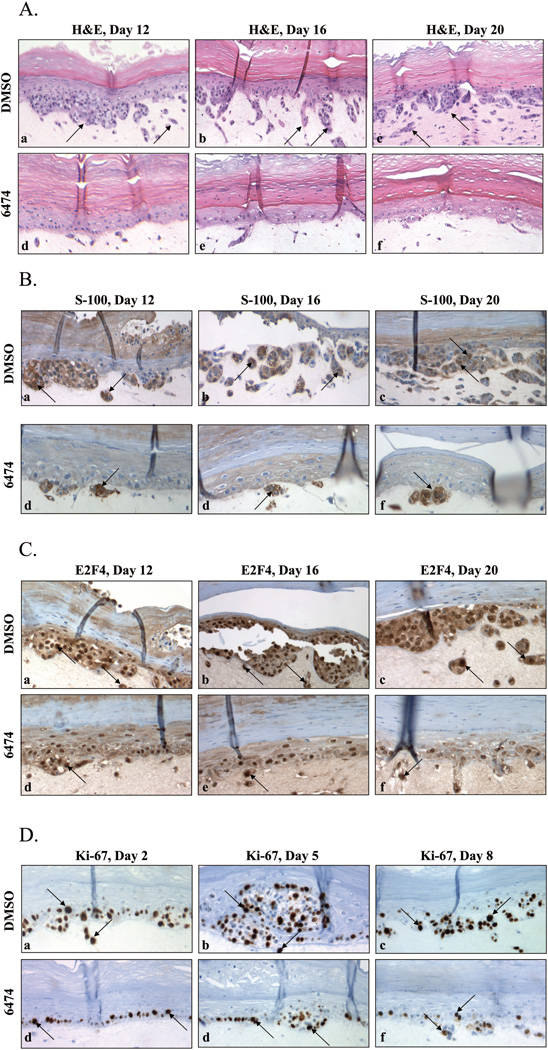
Fig 6A highlights the H&E stain of tissues over time in the absence and presence of HLM006474. Due to space limitations, the results of 80 µM HLM006474 treatment are not shown herein (there is essentially no melanocyte proliferation at 80 µM). In this figure, the keratinocytes form the upper epidermal layer, with the second distinct layer of cells representing the melanocytes. In the early time points this layer is only a few cells thick, and these cells are distinguished by their dark nuclear staining. The third distinct layer represents the fibroblast contracted collagen which makes up the underlying dermal substrate. Over time, the metastatic melanocytes proliferate and form nodes, which grow and invade the underlying collagen substrate. This growth and invasion is clearly evident in the DMSO treated samples.
Figure 6. HLM006474 inhibits melanocyte proliferation in a three-dimensional skin model.
A. H&E staining was performed on thin sections of day 12, 16 and 20 tissues treated with either DMS0 (a–c) or 40 µM HLM006474 (d–f). Magnification, 100×. The top bright red layer represents the epidermis, the next layer of cells with dark blue nuclei represent the melanocyte layer and the bottom largely unstained area represents the fibroblast contracted collagen dermal substrate. Arrows in the DMSO only cells indicate cells and cell clusters that have invaded the dermal layer that are largely absent in the HLM006474 treated tissues.
B. S100 IHC was performed as in Panel A. Magnification, 200×. Arrows point at S-100 positive cells, which are very rare in the HLM006474-treated tissue.
C. E2F4 IHC was performed on thin sections as in Panel A. Magnification, 200×. Arrows point at darkly stained nuclei and lightly stained cytoplasm, which are rare in the HLM006474-treated tissues.
D. Ki-67 IHC was performed on thin sections of day 2, 5 and 8 treated with either DMS0 (a–c) or 40 µM HLM006474 (d–f). Magnification, 200×.
To confirm the presence and growth of melanocytes the tissues were subjected to IHC with a melanocyte marker (S-100, see Fig 6B). Fig 6B reveals strong expression of S-100 in control treated cells. In contrast, only a few S-100 positive cells are observed in the HLM006474-treated tissues; making it clear that HLM006474 significantly inhibited the proliferation and subsequent invasion of the melanocytes into the collagen layer. Since a reduction in S-100 expression is considered an excellent marker for the successful treatment of melanoma (28), these results suggest that HLM006474 is a highly effective inhibitor of malignant growth in this model system. The compound had no obvious deleterious effects on the other cells (fibroblasts and keratinocytes) making up the 3D tissue.
Westerns of cells treated with HLM006474 in two-dimensional cultures indicated that the compound led to significant down regulation of the E2F4 protein. To determine if E2F4 was reduced in three-dimensional culture, sections were subjected to E2F4 IHC. Fig 6C reveals that E2F4 levels are clearly reduced in the treated tissues. Although there are less total cells in the HLM006774 treated tissue (which slightly complicates direct comparisons) it is clear that a lower fraction of HLM006474-treated cells stain positively for E2F4, and of those that are positive the staining is generally less intense. Finally, it is noted that in the treated tissues the remaining E2F4 is predominantly nuclear, whereas in the untreated cells a fraction of E2F4 is also located in the cytoplasm. Since E2F4 is known to shuttle between the cytoplasm (G1/S) and nucleus (G0/G1) during the cell cycle, this result may primarily reflect a quiescent state in the HLM006474-treated cells (29). These results indicate that HLM006474 is likely hitting its intended target in the 3D culture.
To determine whether the inhibition of invasion and melanocyte proliferation was due to increased apoptosis sections were stained with a marker for apoptosis (activated-caspase 3). No difference was observed in samples day 12, 16, or 20, and as such we stained earlier time point reasoning that apoptosis might be an early event that would eliminate cells that would later invade the collagen substrate. Supplementary Fig S5 reveals that no significant difference activated caspase-3 positive cells was observed even in the day 2, 5 or 8 tissues. These data do not fully rule out a possibility for apoptosis in the 3D culture model; however, since it is possible that these dying cells are simply hard to detect. To determine whether an inhibition of cell division might account for inhibition of melanocyte proliferation, tissue sections were stained with a proliferative marker (Ki-67, Fig 6D). The Ki-67 staining clearly reveals a decrease in the number of proliferative cells when treated with HLM006474. Thus, HLM006474’s most obvious mode of action in the 3D model is in the inhibition of proliferation.
DISCUSSION
Previous work suggested that down regulation of total E2F activity within cancer cells would lead to either growth arrest or apoptosis, thus we predicted that a small molecule inhibitor of E2F activity might have therapeutic efficacy in cancer. To test this hypothesis, we screened for compounds that might inhibit E2F DNA-binding and identified one small molecule that clearly targets E2F in vivo. In vivo this inhibitor leads to significant downregulation of E2F4 protein. This unexpected activity may account for the primary biological activity and specificity of HLM006474 and provides an easy way to monitor its biological activity (E2F4 western blotting or IHC). The mechanism by which HLM006474 leads to downregulation of E2F4 will be a topic for future research.
HLM006474 is predicted to make hydrogen bonds with three residues that are absolutely conserved within the E2F family, and thus, there is no reason to expect that HLM006474 is specific to E2F4 heterodimers. Indeed, the supplementary figures demonstrate that essentially all E2F complexes detectable by standard EMSA assay are inhibited by HLM006474. While HLM006474 is not specific to the DNA-binding domain of E2F4, experiments with E2F4 knockout MEFs demonstrate that cells which have presumably adapted to the absence of E2F4 (which has pro-survival activity) are less sensitive to HLM006474 than similarly-derived cells from littermate animals. This specificity is not trivial because we have repeatedly found E2F4-deficient MEFs to be more sensitive to every drug we have tested including flavopiridol, SNS-032, roscovitine, cisplatin and VP16 (8). Although it does not formally rule out the possibility that other E2Fs are also important targets, this result strongly argues that the E2F4 is an important target for HLM006474. This specificity may derive from HL006474’s ability to lead to the downregulation of the E2F4 polypeptide. Future analysis will examine the specific contribution of other E2F family members to the activity of HLM006474.
It is known that a number of E2F-regulated promoters are primarily governed by transcriptional repression by E2F4/Rb family complexes during G0/G1; followed by depression at the G1/S boundary. Given this mechanism, it would be predicted that blocking E2F DNA-binding activity should result in upregulation of these genes, which might possibly result in increased cell growth. This is a very serious consideration as it may ultimately limit the therapeutic efficacy of E2F-targeted therapies. At this point we have no direct evidence that HLM006474 can result in a net increase in cell growth in any cell line that we have tested. However, we note that only a subset of cell lines treated with HLM006474 are significantly growth inhibited at 40 µM (see supplementary Fig S3). Higher HLM006474 concentrations are more effective; however in order to limit off-target effects we have primarily performed experiments at 40 µM since it is just above the IC50 of 29.8 µM (± 7.6 µM). Future experiments will address the possibility that in some cell lines HLM006474 increases cell proliferation, but simultaneously increases apoptosis such that a net increase in cell number is not observed using the MTS assay. Nonetheless, our results suggest that generating a net increase in tumor growth with E2F inhibitors is not likely; consistent with the literature (12–15).
HLM006474 clearly induces apoptosis in sensitive cell lines, such as A374 and 231 cells. Although the phenomenon is well described in the literature (12–15), the exact mechanism of “E2F-deficiency induced apoptosis” has not been adequately investigated. It has been shown that de-repression can be an important mechanism of E2F regulation (30), and it is straightforward to speculate that inhibition of E2F might lead to de-repression of cell death proteins. We have previously demonstrated that E2F4 contributes significantly to survival during drug-induced apoptosis, and that several standard chemotherapeutic drugs significantly reduce E2F4 expression (8). Fig 4 reveals that HLM006474 synergizes with cisplatin, doxorubicin and VP16 to reduce E2F4 levels. Based on our work (8), as well as work published by others (6, 10, 11), we hypothesize that E2F deficiency-induced apoptosis is primarily the result of down regulation of E2F4’s pro-survival role. At this point we have not identified the key E2F target that may mediate this effect. P53 does not appear to play a role (Fig 4), Mcl-1 is modestly down regulated in A375 cells following HLM006474 treatment (Fig 4), which could account for the cells sensitivity to the compound. Likewise, pRb and p107 are down regulated following HLM006474 treatment (not shown). Since Rb family members are known to have prosurvival roles it is possible that their down regulation may contribute to cell death (31, 32). Future work will investigate this hypothesis further.
Although the biochemical mechanisms of HLM006474 action and specificity remain to be fully elucidated, we have clearly identified a compound with significant biological activity that targets E2F4. The biological activity of HLM006474 was demonstrated most convincingly in a three-dimensional model of melanocyte proliferation and invasion. In this experiment we highlight the ability of HLM006474 to inhibit the proliferation and subsequent invasion of A375 melanocytes into an underlying dermal substrate. This model further demonstrated that HLM006474 reduced the levels of E2F4 in the treated melanocytes and that the reduction of E2F4 resulted in a significant decrease in cellular proliferation as measured by Ki-67 staining. Surprisingly, this model did not detect significant levels of apoptosis (as measured by activated caspase 3 IHC) in the treated versus control melanocytes; even though the compound induced significant apoptosis in two-dimensional culture. One explanation for this observation is that the apoptotic cells are simply not detected efficiently by the assay in 3D. Alternatively, it is possible that the apoptosis-inducing activity of HLM006474 is limited in 3D culture due to survival contacts present there and that the main biological activity of HLM006474 is indeed the ability to inhibit cell cycle progression. We believe that these results provide proof of principle that E2F inhibitors may have therapeutic potential in the appropriate context.
Supplementary Material
ACKNOWLEDGEMENTS
We thank Dr. Wesley Brookes and Yunting Luo of the High Throughput and Chemistry cores for assistance with library screening chemical analysis, respectively. We thank Drs. Scott Freeman and Subhra Mohapatra for critical reading of this manuscript and helpful advice on experimentation. We thank David Boulware of the Moffitt Statistical Core for statistical analysis. This work was supported by funds from the National Cancer Institute (CA90489-01, W.D.C.) and by the High-throughput Screening & Chemistry, Molecular Biology, Tissue, Flow Cytometry, Analytical Microscopy, and the Molecular Imaging Core Facilities of the Moffitt Research Institute.
REFERENCES
- 1.Sage J. Hope in sight for retinoblastoma. Nat Med. 2007;13(1):30–31. doi: 10.1038/nm0107-30. [DOI] [PubMed] [Google Scholar]
- 2.La Thangue NB. The yin and yang of E2F-1: balancing life and death. Nat Cell Biol. 2003;5(7):587–589. doi: 10.1038/ncb0703-587. [DOI] [PubMed] [Google Scholar]
- 3.Johnson DG, Degregori J. Putting the Oncogenic and Tumor Suppressive Activities of E2F into Context. Current molecular medicine. 2006;6(7):731–738. doi: 10.2174/1566524010606070731. [DOI] [PubMed] [Google Scholar]
- 4.Kong LJ, Chang JT, Bild AH, Nevins JR. Compensation and specificity of function within the E2F family. Oncogene. 2007 doi: 10.1038/sj.onc.1209817. [DOI] [PubMed] [Google Scholar]
- 5.Trimarchi JM, Lees JA. Sibling rivalry in the E2F family. Nat Rev Mol Cell Biol. 2002;3(1):11–20. doi: 10.1038/nrm714. [DOI] [PubMed] [Google Scholar]
- 6.Crosby ME, Almasan A. Opposing roles of E2Fs in cell proliferation and death. Cancer Biol Ther. 2004;3(12):1208–1211. doi: 10.4161/cbt.3.12.1494. [DOI] [PMC free article] [PubMed] [Google Scholar]
- 7.Lin WC, Lin FT, Nevins JR. Selective induction of E2F1 in response to DNA damage, mediated by ATM-dependent phosphorylation. Genes Dev. 2001;15(14):1833–1844. [PMC free article] [PubMed] [Google Scholar]
- 8.Ma Y, Freeman SN, Cress WD. E2F4 Deficiency Promotes Drug-Induced Apoptosis. Cancer Biol Ther. 2004;3(12):1262–1269. doi: 10.4161/cbt.3.12.1239. [DOI] [PubMed] [Google Scholar]
- 9.Ma Y, Cress WD, Haura EB. Flavopiridol-induced apoptosis is mediated through up-regulation of E2F1 and repression of Mcl-1. Mol Cancer Ther. 2003;2(1):73–81. [PubMed] [Google Scholar]
- 10.DuPree EL, Mazumder S, Almasan A. Genotoxic stress induces expression of E2F4, leading to its association with p130 in prostate carcinoma cells. Cancer Res. 2004;64(13):4390–4393. doi: 10.1158/0008-5472.CAN-03-3695. [DOI] [PubMed] [Google Scholar]
- 11.Crosby ME, Jacobberger J, Gupta D, Macklis RM, Almasan A. E2F4 regulates a stable G(2) arrest response to genotoxic stress in prostate carcinoma. Oncogene. 2006;26(13):1897–1909. doi: 10.1038/sj.onc.1209998. [DOI] [PMC free article] [PubMed] [Google Scholar]
- 12.Montigiani S, Muller R, Kontermann RE. Inhibition of cell proliferation and induction of apoptosis by novel tetravalent peptides inhibiting DNA binding of E2F. Oncogene. 2003;22(32):4943–4952. doi: 10.1038/sj.onc.1206495. [DOI] [PubMed] [Google Scholar]
- 13.Wu CL, Classon M, Dyson N, Harlow E. Expression of dominant-negative mutant DP-1 blocks cell cycle progression in G1. Mol Cell Biol. 1996;16(7):3698–3706. doi: 10.1128/mcb.16.7.3698. [DOI] [PMC free article] [PubMed] [Google Scholar]
- 14.Fabbrizio E, Le Cam L, Polanowska J, et al. Inhibition of mammalian cell proliferation by genetically selected peptide aptamers that functionally antagonize E2F activity. Oncogene. 1999;18(30):4357–4363. doi: 10.1038/sj.onc.1202825. [DOI] [PubMed] [Google Scholar]
- 15.Bandara LR, Girling R, La Thangue NB. Apoptosis induced in mammalian cells by small peptides that functionally antagonize the Rb-regulated E2F transcription factor. Nat Biotechnol. 1997;15(9):896–901. doi: 10.1038/nbt0997-896. [DOI] [PubMed] [Google Scholar]
- 16.Zheng N, Fraenkel E, Pabo CO, Pavletich NP. Structural basis of DNA recognition by the heterodimeric cell cycle transcription factor E2F-DP. Genes Dev. 1999;13(6):666–674. doi: 10.1101/gad.13.6.666. [DOI] [PMC free article] [PubMed] [Google Scholar]
- 17.He Y, Armanious MK, Thomas MJ, Cress WD. Identification of E2F-3B, an alternative form of E2F-3 lacking a conserved N-terminal region. Oncogene. 2000;19(30):3422–3433. doi: 10.1038/sj.onc.1203682. [DOI] [PubMed] [Google Scholar]
- 18.Moberg K, Starz MA, Lees JA. E2F-4 switches from p130 to p107 and pRB in response to cell cycle reentry. Mol Cell Biol. 1996;16(4):1436–1449. doi: 10.1128/mcb.16.4.1436. [DOI] [PMC free article] [PubMed] [Google Scholar]
- 19.Ma Y, Cress WD. Transcriptional upregulation of p57 (Kip2) by the cyclin-dependent kinase inhibitor BMS-387032 is E2F dependent and serves as a negative feedback loop limiting cytotoxicity. Oncogene. 2007;26:3532–3540. doi: 10.1038/sj.onc.1210143. [DOI] [PMC free article] [PubMed] [Google Scholar]
- 20.Eblen ST, Fautsch MP, Anders RA, Leof EB. Conditional binding to and cell cycle-regulated inhibition of cyclin-dependent kinase complexes by p27Kip1. Cell Growth Differ. 1995;6(8):915–925. [PubMed] [Google Scholar]
- 21.Halgren TA, Murphy RB, Friesner RA, et al. Glide: a new approach for rapid, accurate docking and scoring. 2. Enrichment factors in database screening. J Med Chem. 2004;47(7):1750–1759. doi: 10.1021/jm030644s. [DOI] [PubMed] [Google Scholar]
- 22.Friesner RA, Banks JL, Murphy RB, et al. Glide: a new approach for rapid, accurate docking and scoring. 1. Method and assessment of docking accuracy. J Med Chem. 2004;47(7):1739–1749. doi: 10.1021/jm0306430. [DOI] [PubMed] [Google Scholar]
- 23.Ikeda MA, Jakoi L, Nevins JR. A unique role for the Rb protein in controlling E2F accumulation during cell growth and differentiation. Proc Natl Acad Sci U S A. 1996;93(8):3215–3220. doi: 10.1073/pnas.93.8.3215. [DOI] [PMC free article] [PubMed] [Google Scholar]
- 24.Siddiquee K, Zhang S, Guida WC, et al. Selective chemical probe inhibitor of Stat3, identified through structure-based virtual screening, induces antitumor activity. Proc Natl Acad Sci U S A. 2007 doi: 10.1073/pnas.0609757104. [DOI] [PMC free article] [PubMed] [Google Scholar]
- 25.Ma Y, Yuan J, Huang M, Jove R, Cress WD. Regulation of the Cyclin D3 Promoter by E2F1. J Biol Chem. 2003;278(19):16770–16776. doi: 10.1074/jbc.M212702200. [DOI] [PubMed] [Google Scholar]
- 26.Croxton R, Ma Y, Song L, Haura EB, Cress WD. Direct repression of the Mcl-1 promoter by E2F1. Oncogene. 2002;21(9):1359–1369. doi: 10.1038/sj.onc.1205157. [DOI] [PubMed] [Google Scholar]
- 27.Croxton R, Ma Y, Cress WD. Differences in DNA binding properties between E2F1 and E2F4 specify repression of the Mcl-1 promoter. Oncogene. 2002;21(10):1563–1570. doi: 10.1038/sj.onc.1205232. [DOI] [PubMed] [Google Scholar]
- 28.Salama I, Malone PS, Mihaimeed F, Jones JL. A review of the S100 proteins in cancer. Eur J Surg Oncol. 2007 doi: 10.1016/j.ejso.2007.04.009. [DOI] [PubMed] [Google Scholar]
- 29.Verona R, Moberg K, Estes S, Starz M, Vernon JP, Lees JA. E2F activity is regulated by cell cycle-dependent changes in subcellular localization. Mol Cell Biol. 1997;17(12):7268–7282. doi: 10.1128/mcb.17.12.7268. [DOI] [PMC free article] [PubMed] [Google Scholar]
- 30.Harbour JW, Dean DC. Rb function in cell-cycle regulation and apoptosis. Nat Cell Biol. 2000;2(4):E65–E67. doi: 10.1038/35008695. [DOI] [PubMed] [Google Scholar]
- 31.Macleod KF, Hu Y, Jacks T. Loss of Rb activates both p53-dependent and independent cell death pathways in the developing mouse nervous system. Embo J. 1996;15(22):6178–6188. [PMC free article] [PubMed] [Google Scholar]
- 32.Berry DE, Lu Y, Schmidt B, et al. Retinoblastoma protein inhibits IFN-gamma induced apoptosis. Oncogene. 1996;12(8):1809–1819. [PubMed] [Google Scholar]
Associated Data
This section collects any data citations, data availability statements, or supplementary materials included in this article.


