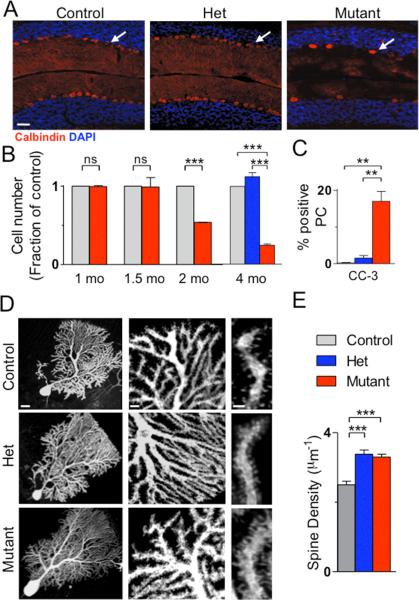
Figure 1. PC Tsc1 mutants display reduced PC numbers and abnormal PC morphology.
A. Mutants displayed reduced Purkinje cell numbers by Calbindin staining. B. PC loss occurred by 2 months in mutants. No PC loss was observed in hets at 4 months. C. Increased cleaved caspase-3 (CC-3) staining in mutants. (for B-C, controls/mutants: n=3 mice; hets, n=2 mice; >500 cells/group) D., E. Mutant PCs displayed increased spine density. (control: n=10 cells, 3 mice; het: n=10 cells, 4 mice; mutant: n=11 cells, 3 mice). *** p < 0.001, two-way ANOVA, Bonferroni's post hoc analysis. Scale bars in A.100μm; D. 20μm (left), 5μm (middle), 2μm (right).

