Abstract
Seeds are the most important plant storage organ and play a central role in the life cycle of plants. Since little is known about the protein composition of rice (Oryza sativa) seeds, in this work we used proteomic methods to obtain a reference map of rice seed proteins and identify important molecules. Overall, 480 reproducible protein spots were detected by two-dimensional electrophoresis on pH 4–7 gels and 302 proteins were identified by MALDI-TOF MS and database searches. Together, these proteins represented 252 gene products and were classified into 12 functional categories, most of which were involved in metabolic pathways. Database searches combined with hydropathy plots and gene ontology analysis showed that most rice seed proteins were hydrophilic and were related to binding, catalytic, cellular or metabolic processes. These results expand our knowledge of the rice proteome and improve our understanding of the cellular biology of rice seeds.
Keywords: mass spectrometry, proteomic analysis, rice seed, two-dimensional electrophoresis
Introduction
Rice (Oryza sativa L.) is the main food source for more than two-third of the world’s population (Sasaki and Burr, 2000), especially in Southeast Asia (Nwugo and Huerta, 2011; Wang et al., 2011). With the completion of the rice genome sequencing program, rice has become the model organism in molecular biological research of monocotyledons (Agrawal and Rakwal, 2011; Li et al., 2011). The International Rice Genome Sequencing Project (IRGSP) has generated high-quality sequences that cover 95% of the 389 Mb rice genome and has produced a genomic map for this species (Liu and Xue, 2006).
In recent years, many studies have investigated the functional genomics of rice. Traditional functional genomics have investigated mainly the changes in mRNA abundance in histiocytes. However, because of transcriptional regulation, mRNA levels do not provide a true indication of protein expression levels (Jugran et al., 2010; Ding et al., 2012). On the other hand, some proteins undergo complex post-translational modifications such that changes in the level of active protein may be more significant than those in the total protein content. Proteomic analysis was first described by Wilkins and Williams (1994) and seeks to study all proteins expressed in a cell, tissue or organism at a specific time or under specific circumstances by maximizing protein separation and identification (Wilkins et al., 1998). Two-dimensional electrophoresis (2-DE) combined with mass spectrometry (MS) are still the core tools for identifying differentially expressed proteins in proteomics (Yang et al., 2006, 2007a,b; Chitteti and Peng, 2007; Torabi et al., 2009; Chi et al., 2010; Ahrné et al., 2011; Fan et al., 2011; He et al., 2011; Nwugo and Huerta, 2011; Ding et al., 2012; Kalli and Hess, 2012).
Seeds are important plant storage organs that play a central role in the life cycle of plants because they are essential for plant reproduction and the initial stages of offspring formation (Yang et al., 2009). Seed biology is a major subject in plant research, although most studies have focused on seed dormancy and germination mechanisms (Koornneef et al., 2002; Finch-Savage and Leubner-Metzger, 2006; Yang et al., 2007b; Vaughan et al., 2008; He et al., 2011), with little being known about seed protein composition. Since proteomics is a well-established means of assessing global changes in protein profiles (Agrawal et al., 2006; Agrawal and Rakwal, 2011; Fan et al., 2011), in this study we used 2-DE and MALDI-TOF-MS to examine the proteomic profile of rice seeds. Our specific goals were (1) to determine the proteomic profile of rice seeds, (2) to identify the main protein components involved and (3) to understand the functional characteristics of the identified proteins.
Materials and Methods
Seeds
Seeds of the Nipponbare strain of rice (O. sativa L. spp. japonica, cv. Nipponbare, AA genome) were used in this work.
Protein extraction
The rice seeds were peeled and washed three times using purified water, after which proteins were extracted using a modified version of the protocol described by Shen et al. (2003). Seeds (2 g samples) were homogenized in pre-cooled extraction buffer (20 mM Tris-HCl, pH 7.5, 250 mM sucrose, 10 mM EGTA, 1 mM PMSF, 1 mM DTT and 1% Triton X-100) on ice. The homogenate was transferred to a 2 mL centrifuge tube and centrifuged (15,000 g, 4 °C, 20 min). The supernatant was collected and proteins were precipitated for 30 min in an ice bath by adding 50% cold trichloroacetic acid (TCA) until the final concentration of TCA was 10% (Yang et al., 2006). The supernatant was discarded after centrifugation (15,000 g, 4 °C, 20 min) and the pellet was then washed four times using cold acetone containing 13 mM DTT. After further centrifugation (15,000 g, 4 °C, 20 min), the pellet was vacuum-dried. The dried powder was dissolved in sample buffer (7 M urea, 2M thiourea, 4% Chaps, 2% Bio-Lyte pH 3-10, 1 mM PMSF and 1% DTT; 1 mg dried powder/0.1 mL of buffer) at 4 °C overnight. Following a final centrifugation (15,000 g, 4 °C, 20 min), the supernatant was used for 2-DE. Protein concentrations were determined by a dye-binding method (Bradford, 1976). Since some of the components of the sample buffer interfered with the Bradford assay an equal volume of sample buffer was added to the protein reagent to compensate for this interference. Bovine serum albumin was used as the standard.
Two-dimensional electrophoresis
Isoelectric focusing (IEF) was done using a Bio-Rad PROTEAN electrophoresis system and 17 cm immobilized IPG dry gel strips with a linear pH range (pH 4–7) (Bio-Rad, USA). Protein samples (∼1.5 mg) were loaded during the rehydration step (passive rehydration, room temperature, 12–13 h) and IEF was done at 300, 500 and 1000 V for 1 h, with linear ramping to 8000 V over 2 h and holding at 8000 V until a total voltage of 50 kVh was achieved. Subsequently, the strips were equilibrated for 15 min with buffer I (6 M urea, 50 mM Tris-HCl, pH 6.8, 30% v/v glycerol, 2.5% SDS, 1% w/v DTT) and then for 15 min with buffer II (6 M urea, 50 mM Tris-HCl, pH 6.8, 30% v/v glycerol, 2.5% SDS, 2.5% w/v iodoacetamide). After equilibration, the second dimension SDS-PAGE was done using 12% polyacrylamide gels. Proteins were detected by staining the gels with 0.116% Coomassie brilliant blue R-250.
Image and data analysis
The 2-DE gels were scanned (resolution: 300 dpi) with an ImageScanner III scanner (GE Healthcare BIOScience) and the gel images were analyzed with PDQuest software (Bio-Rad, USA). Each protein spot in the 2-DE map was assigned a number.
In-gel digestion and MALDI-TOF MS analysis
Protein spots were excised manually from the Coomassie blue-stained gels and each gel fragment was immersed in purified water and sonicated twice (10 min each). Subsequently, the gel pieces were destained with 50 mM ammonium bicarbonate and an equivalent volume of 50% acetonitrile, followed by sequential washing with 25 mM ammonium bicarbonate, 50% acetonitrile and 100% acetonitrile, respectively. After lyophilization, the gel fragments were rehydrated in digestion buffer (2 μL) containing 25 mM NH4HCO3 and 10 ng of trypsin/μL (Promega, Madison, WI, USA) at 4 °C. After 30 min, 10–15 μL of 25 mM NH4HCO3 was added and digestion was continued at 37 °C overnight (11–16 h). After digestion, the peptide solution was collected and tryptic peptide masses were determined using a MALDI-TOF mass spectrometer (Ultraflex-TOF-TOF, Bruker, Germany).
Database search and protein identification
All of the acquired peptide mass fingerprint data were used in online searches with the Mascot program through Biotechnology Information nonredundant database. The search parameters included trypsin as the selected enzyme (one missed cleavage was permitted), carbamidomethyl as the fixed modification, Gln- > pyro-Glu (N-terminal Q) as the variable modification and a peptide tolerance of ± 0.2 Da. O. sativa was selected as the taxonomic category. Proteins with a MOWSE score > 64 were considered as positive identifications.
Bioinformatics analysis of the identified proteins
The hydropathy of all proteins identified with a high level of confidence (MOWSE scores > 64) and the grand average of hydropathicity (GRAVY) for all the proteins were calculated as described by Kyte and Doolittle (1982), using the Protparam tool from the ExPASy site. The resulting grand average hydropathy values were then analyzed with Origin 7.0 software.
The Gene Ontology (GO) identity of each of the identified proteins was obtained by InterProscan searching. The GO classification of these proteins was obtained using the WEGO platform and the annotated data of the identified proteins.
Results
Proteomic profile of rice seeds
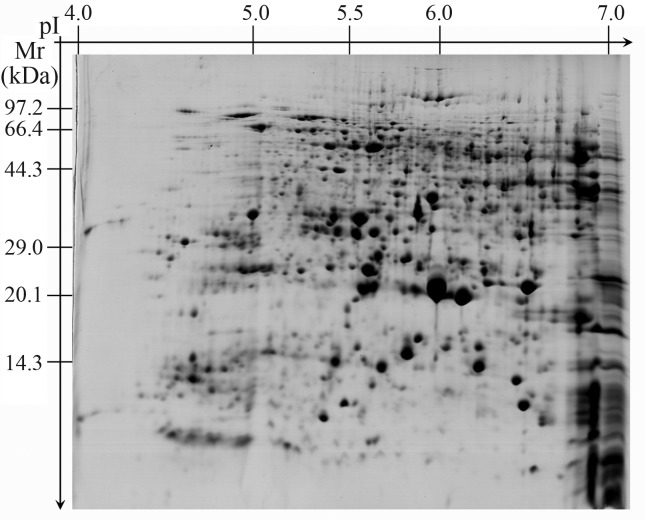
The analysis of 2-DE gels with PDQuest software detected 480 reproducible protein spots, most of which were distributed near the center of the gels (Figure 1). For example, the pI of 415 protein spots was between 5 and 7 and accounted for 84.5% of the total number of protein spots. In addition, the molecular mass of ∼90% of the proteins was between 15 kDa and 95 kDa.
Figure 1.
Proteome profile of rice seeds.
Protein identification by MALDI-TOF MS
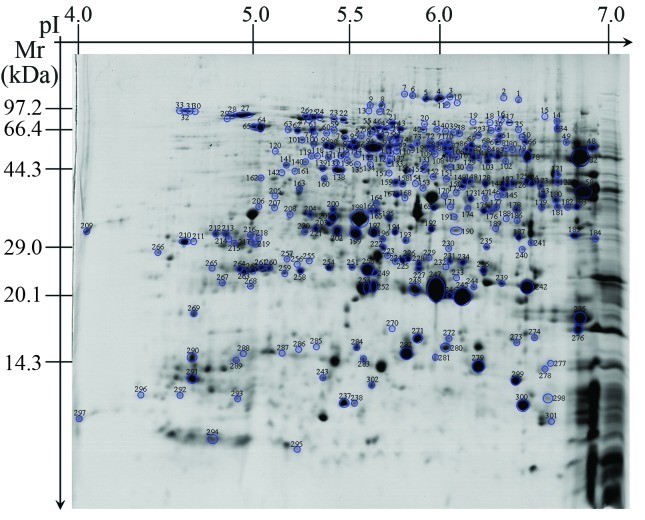
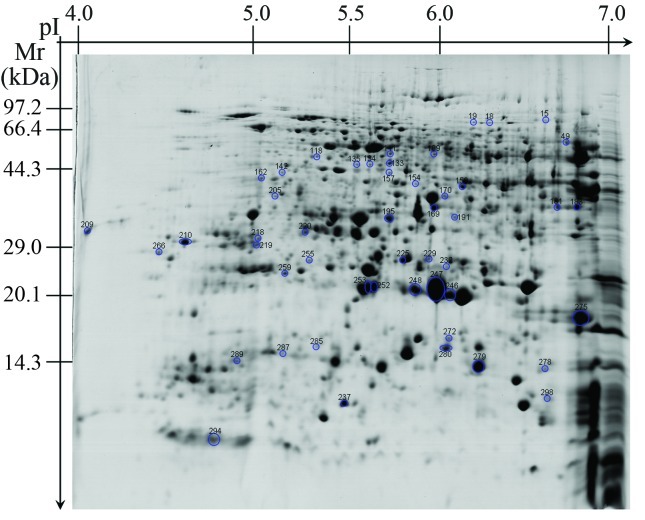
A comprehensive knowledge of rice seed proteins will greatly enhance our understanding and exploration of the functional characteristics of these seeds. The 480 reproducible proteins were screened by MALDI-TOF-MS to obtain peptide mass fingerprint data. Only 302 proteins (Figure 2) with high confidence levels (MOWSE scores > 64) were identified (Table S1 - Supplementary Material), of which 52 were unidentified proteins of unknown functions (Figure 3; Table S2 - Supplementary Material). In some cases, different spots contained the same protein (Table S1), e.g., spots 4, 5, 6 and 7 corresponded to hypothetical protein OsJ_13773, and spots 10 and 11 were putative aconitate hydratase.
Figure 2.
The protein spots identified by MALDI-TOF-MS. Each protein with a high confidence level (MOWSE score > 64) was assigned a number.
Figure 3.
The unknown proteins identified by MALDI-TOF-MS.
Classification of protein functions
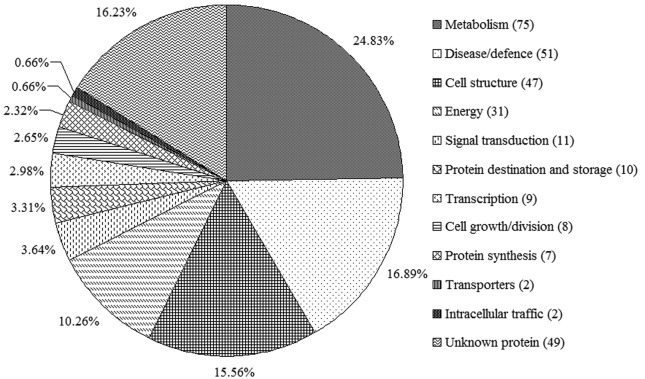
The 302 identified proteins represented the products of 252 different genes and were classified into 12 categories based on their functions (Figure 4) (Bevan et al., 1998). Protein functions were retrieved online as Gene Ontology information. The 12 categories were: Metabolism (1), Disease/defense (2), Cell structure (3), Energy (4), Signal transduction (5), Protein destination and storage (6), Cell growth/division (7), Protein synthesis (8), Transcription (9), Transporters (10), Intracellular traffic (11) and Unknown protein (12). The functional categories were determined according to Bevan et al. (1998). As shown in Figure 4, 75 spots were involved in metabolic processes and were the most abundant category (24.8%). Proteins related to disease/defense were the second most abundant category (16.9%) and unknown proteins were the third most abundant (16.2%).
Figure 4.
Functional classifications of the identified proteins. The number of proteins in each category is indicated in parentheses.
Bioinformatics analysis of identified proteins
Proteins with negative GRAVY scores were hydrophilic and those with positive GRAVY scores were hydrophobic. Figure 5 shows that identified proteins with negative GRAVY scores were significantly more abundant than those with positive GRAVY scores. The GRAVY values of most proteins were between −0.6 and 0, indicating that most of them were hydrophilic.
Figure 5.
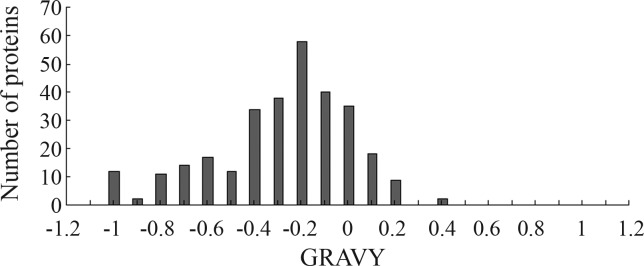
Hydropathic analysis of all proteins identified by 2-DE. Negative and positive GRAVY values indicate hydrophilic and hydrophobic proteins, respectively.
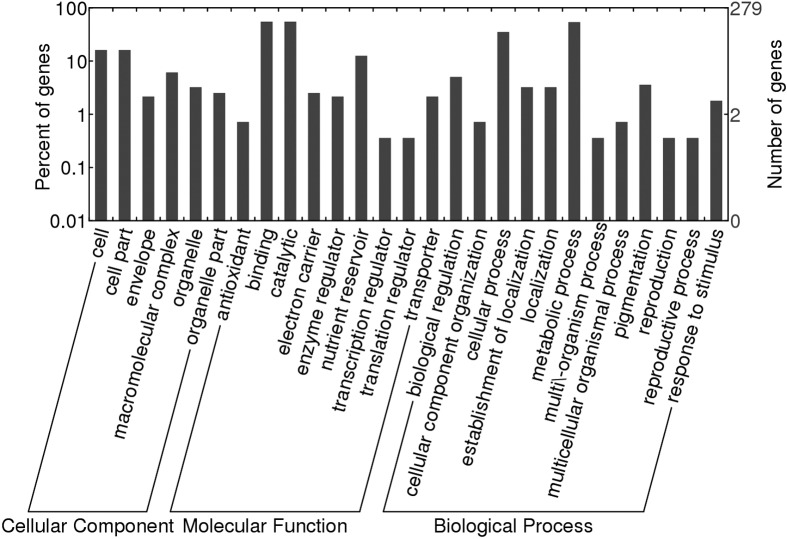
Figure 6 shows the GO analysis of the identified proteins, all of which were classified in terms of cellular component, molecular function, and physiological and biological processes using appropriate software (Gene Ontology Annotation Plot, WEGO). Most of the identified proteins associated with cellular components were involved in cell, cell parts, envelope, macromolecular complex, organelle and organelle parts, while those associated with molecular functions were involved in antioxidant, binding, catalytic, electron carrier, enzyme regulator, nutrient reservoir, transcription regulator and transporter activities. Biological processes involved biological regulation, cellular component organization, cellular process, establishment of localization, localization, metabolic process, multi/-organism process, multicellular organismal process, pigmentation, reproduction, reproductive process and response to stimulus.
Figure 6.
GO classifications of the identified proteins. All of the proteins were classified into three main categories and 26 subcategories.
Discussion
Proteomic technologies are the most widely applied approach for identifying proteins in rice (Yang et al., 2006, 2007a,b; Chitteti and Peng, 2007; Torabi et al., 2009; Chi et al., 2010; Fan et al., 2011; He et al., 2011; Nwugo and Huerta, 2011; Ding et al., 2012). In this study, we used 2-DE combined with MALDI-TOF-MS to obtain a 2-DE proteomic profile of rice seeds. A total of 480 reproducible protein spots were selected for MALDI-TOF-MS analysis. However, only 302 proteins with a MOWSE score > 64 were identified as proteins (see Tables S1 and S2); there were no significant matches for the other 178 protein spots. There are at least two possible explanations for this phenomenon. First, some protein spots with low confidence levels possibly contained more than one protein. Second, some small protein spots could not be identified by MALDI-TOF-MS or were not included in the databases because of a lack of information in the rice database (Woo et al., 2002).
The majority of corn proteins can be divided into three categories: storage proteins, structure- or metabolism-related proteins, and protective proteins (Shewry and Halford, 2002). As shown in Figure 4, 24.8% of the identified proteins were classified in the metabolism group, 16.9% were involved in disease/defense and 15.6% were cell structure proteins. Furthermore, 10.3% of the identified proteins were classified in the energy group. Together, the proteins in these groups accounted for > 67% of the identified proteins. Metabolism is essential for many activities and, not surprisingly, metabolism-related proteins have an important role in maintaining seed vigor. In addition, most metabolism- and energy-related proteins are associated with carbohydrate metabolic pathways (He et al., 2011), including glycolysis and the TCA cycle. In this study, many enzymes involved in glycolysis were identified, including pyruvate orthophosphate dikinase (spots 12 and 13), phosphoglucomutase (spot 21), pyrophosphate-fructose-6-phosphate 1-phosphotransferase (spot 51), pyrophosphate-fructose-6-phosphate 2-phosphotransferase (spot 52), UTP-glucose-1-phosphate uridylyltransferase (spots 56 and 97), fructose bisphosphate aldolase (spot 58), glucose-6-phosphate isomerase (spots 60 and 77), enolase (spots 94 and 95), glyceraldehyde 3-phosphate dehydrogenase (spots 143 and 145), glucose-6-phosphate 1-epimerase (spot 161) and triosephosphate isomerase (spots 250, 254, 256 and 257). Some enzymes involved in the TCA cycle were also identified, such as aconitate hydratase (spots 10 and 11), succinate dehydrogenase (spot 35), isocitrate dehydrogenase (spot 121), succinyl-CoA synthetase (spot 160) and malate dehydrogenase (spots 167, 168 and 173). Similarly, two enzymes involved in the alcoholic fermentation pathway were also identified, namely, alcohol dehydrogenase (spot 34) and pyruvate decarboxylase (spot 45). These results indicate that aerobic and anaerobic respiration occurs in storage rice seeds. The energy demand is met primarily by glycolysis and the TCA cycle, although anaerobic fermentation can also provide energy in the absence of oxygen.
We also identified 12 proteins related to amino acid metabolism: five of these have a central role in amino acid metabolism (spots 106, 148, 153, 155 and 156), four are involved in the metabolism of branched chain amino acids (spots 38, 40, 53 and 141) and the remaining three are involved in arginine metabolism (spots 105, 107 and 108). Compared with germinating rice seeds, there were fewer proteins associated with amino acid metabolism in storage rice seeds. There are several explanations for this phenomenon. First, dry seeds are used mainly for storage and transport, and a lower metabolic activity favors the preservation of rice seeds. Second, the moisture content of storage seeds is very low, with the existing metabolism providing only essential energy and many physiological and biochemical reactions are inactive. Third, staining with Coomassie brilliant blue may not be sufficiently sensitive to detect some spots so that more sensitive staining methods such as negative staining and fluorescence staining should be used in future studies. Finally, some strongly basic proteins or proteins with extreme molecular masses may be missed in the 2-DE gels. The presence of the same protein in different spots suggests variations in post-translational modifications or the presence of protein subunits, as also suggested by others (Yang et al., 2006; Chi et al., 2010; Liu and Bennett, 2011).
The hydropathy analysis showed that most of the rice seed proteins were hydrophilic. Rice seeds contain many proteins and enzymes related to metabolism and disease/defense, and these proteins may only be active in physiological processes when in solution, i.e., in a soluble state. The presence of soluble proteins is a further characteristic of rice seed proteins.
In a proteomic survey of metabolic pathways in rice, Koller et al. (2002) identified 2,528 unique proteins, 877 of which were from seeds. Of the 2,528 proteins detected, 189 were expressed in rice leaves, roots and seeds. In addition, there were 512 seed-specific proteins. Koller et al. (2002) collected their seed samples from the entire panicle at 14 days postanthesis. In contrast, we used seed samples from mature rice seeds and identified 302 proteins that represented 252 gene products. Our findings therefore expand the results of previous studies.
Conclusion
Seeds are a major food source for humans and are essential for plant reproduction. In this study, we identified 302 proteins in the proteome of rice seeds. These proteins represented 252 gene products and were classified into 12 functional categories. The 302 proteins identified here represent an important contribution to the rice proteome database and shed light on the protein content of rice seeds.
Acknowledgments
This work was supported by the Ministry of Agriculture Transgenic Major Project (grant 2009ZX08012018B), National Natural Science Foundation of China (grant 31201189), the Scientific Research Promotion Fund for the Talents of Jiangsu University (grant 11JDG049) and Postdoctoral Fund of Department of Personnel of Jiangsu Province (grant 1102010C).
Footnotes
Associate Editor: Marcia Pinheiro Margis
Supplementary Material
The following online material is available for this article:
Table S1 - The protein spots identified by MALDI-TOF-MS.
Table S2 - The unknown proteins identified by MALDI-TOF-MS.
This material is available as part of the online article from http://www.scielo.br/gmb.
References
- Agrawal GK, Rakwal R. Rice proteomics: A move toward expanded proteome coverage to comparative and functional proteomics uncovers the mysteries of rice and plant biology. Proteomics. 2011;11:1630–1649. doi: 10.1002/pmic.201000696. [DOI] [PubMed] [Google Scholar]
- Agrawal GK, Jwa NS, Iwahashi Y, Yonekura M, Iwahashi H, Rakwal R. Rejuvenating rice proteomics: Facts, challenges, and visions. Proteomics. 2006;6:5549–5576. doi: 10.1002/pmic.200600233. [DOI] [PubMed] [Google Scholar]
- Ahrné E, Ohta Y, Nikitin F, Scherl A, Lisacek F, Müller M. An improved method for the construction of decoy peptide MS/MS spectra suitable for the accurate estimation of false discovery rates. Proteomics. 2011;11:4085–4095. doi: 10.1002/pmic.201000665. [DOI] [PubMed] [Google Scholar]
- Bevan M, Bancroft I, Bent E, Love K, Goodman H, Dean C, Bergkamp R, Dirkse W, Van Staveren M, Stiekema W, et al. Analysis of 1.9 Mb of contiguous sequence from chromosome 4 of Arabidopsis thaliana. Nature. 1998;391:485–488. doi: 10.1038/35140. [DOI] [PubMed] [Google Scholar]
- Bradford MM. A rapid and sensitive method for the quantitation of microgram quantities of protein utilizing the principle of protein-dye binding. Anal Biochem. 1976;72:248–254. doi: 10.1016/0003-2697(76)90527-3. [DOI] [PubMed] [Google Scholar]
- Chi F, Yang P, Han F, Jing Y, Shen S. Proteomic analysis of rice seedlings infected by Sinorhizobium meliloti 1021. Proteomics. 2010;10:1861–1874. doi: 10.1002/pmic.200900694. [DOI] [PubMed] [Google Scholar]
- Chitteti BR, Peng Z. Proteome and phosphoproteome differential expression under salinity stress in rice (Oryza sativa) roots. J Proteome Res. 2007;6:1718–1727. doi: 10.1021/pr060678z. [DOI] [PubMed] [Google Scholar]
- Ding C, You J, Wang S, Liu Z, Li G, Wang Q, Ding Y. A proteomic approach to analyze nitrogen- and cytokinin-responsive proteins in rice roots. Mol Biol Rep. 2012;39:1617–1626. doi: 10.1007/s11033-011-0901-4. [DOI] [PubMed] [Google Scholar]
- Fan W, Cui W, Li X, Chen S, Liu G, Shen S. Proteomics analysis of rice seedling responses to ovine saliva. J Plant Physiol. 2011;168:500–509. doi: 10.1016/j.jplph.2010.08.012. [DOI] [PubMed] [Google Scholar]
- Finch-Savage WE, Leubner-Metzger G. Seed dormancy and the control of germination. New Phytol. 2006;171:501–523. doi: 10.1111/j.1469-8137.2006.01787.x. [DOI] [PubMed] [Google Scholar]
- He D, Han C, Yao J, Shen S, Yang P. Constructing the metabolic and regulatory pathways in germinating rice seeds through proteomic approach. Proteomics. 2011;11:2693–2713. doi: 10.1002/pmic.201000598. [DOI] [PubMed] [Google Scholar]
- Jugran A, Bhatt ID, Rawal RS. Characterization of agro-diversity by seed storage protein electrophoresis: Focus on rice germplasm from Uttarakhand Himalaya, India. Rice Sci. 2010;17:122–128. [Google Scholar]
- Kalli A, Hess S. Effect of mass spectrometric parameters on peptide and protein identification rates for shotgun proteomic experiments on an LTQ-orbitrap mass analyzer. Proteomics. 2012;12:21–31. doi: 10.1002/pmic.201100464. [DOI] [PubMed] [Google Scholar]
- Koller A, Washburn MP, Lange BM, Andon NL, Deciu C, Haynes PA, Hays L, Schieltz D, Ulaszek R, Wei J, et al. Proteomic survey of metabolic pathways in rice. Proc Natl Acad Sci USA. 2002;99:11969–11974. doi: 10.1073/pnas.172183199. [DOI] [PMC free article] [PubMed] [Google Scholar]
- Koornneef M, Bentsink L, Hilhorst H. Seed dormancy and germination. Curr Opin Plant Biol. 2002;5:33–36. doi: 10.1016/s1369-5266(01)00219-9. [DOI] [PubMed] [Google Scholar]
- Kyte J, Doolittle RF. A simple method for displaying the hydropathic character of a protein. J Mol Biol. 1982;157:105–132. doi: 10.1016/0022-2836(82)90515-0. [DOI] [PubMed] [Google Scholar]
- Li X, Bai H, Wang X, Li L, Cao Y, Wei J, Liu Y, Liu L, Gong X, Wu L, et al. Identification and validation of rice reference proteins for western blotting. J Exp Bot. 2011;62:4763–4772. doi: 10.1093/jxb/err084. [DOI] [PMC free article] [PubMed] [Google Scholar]
- Liu JX, Bennett J. Reversible and irreversible drought-induced changes in the anther proteome of rice (Oryza sativa L.) genotypes IR64 and Moroberekan. Mol Plant. 2011;4:59–69. doi: 10.1093/mp/ssq039. [DOI] [PubMed] [Google Scholar]
- Liu Q, Xue Q. Genome sequencing and identification of gene function in rice. Acta Genet Sin. 2006;33:669–677. doi: 10.1016/S0379-4172(06)60098-X. [DOI] [PubMed] [Google Scholar]
- Nwugo CC, Huerta AJ. The effect of silicon on the leaf proteome of rice (Oryza sativa L.) plants under cadmium-stress. J Proteome Res. 2011;10:518–528. doi: 10.1021/pr100716h. [DOI] [PubMed] [Google Scholar]
- Sasaki T, Burr B. International Rice Genome Sequencing Project: The effort to completely sequence the rice genome. Curr Opin Plant Biol. 2000;3:138–141. doi: 10.1016/s1369-5266(99)00047-3. [DOI] [PubMed] [Google Scholar]
- Shen S, Jing Y, Kuang T. Proteomics approach to identify wound-response related proteins from rice leaf sheath. Proteomics. 2003;3:527–535. doi: 10.1002/pmic.200390066. [DOI] [PubMed] [Google Scholar]
- Shewry PR, Halford NG. Cereal seed storage proteins: Structures, properties and role in grain utilization. J Exp Bot. 2002;53:947–958. doi: 10.1093/jexbot/53.370.947. [DOI] [PubMed] [Google Scholar]
- Torabi S, Wissuwa M, Heidari M, Naghavi MR, Gilany K, Hajirezaei MR, Omidi M, Yazdi-Samadi B, Ismail AM, Salekdeh GH. A comparative proteome approach to decipher the mechanism of rice adaptation to phosphorous deficiency. Proteomics. 2009;9:159–170. doi: 10.1002/pmic.200800350. [DOI] [PubMed] [Google Scholar]
- Vaughan D, Lu BR, Tomooka N. Was Asian rice (Oryza sativa) domesticated more than once? Rice. 2008;1:16–24. [Google Scholar]
- Wang Y, Kim S, Kim S, Agrawal G, Rakwal R, Kang K. Biotic stress-responsive rice proteome: An overview. J Plant Biol. 2011;54:219–226. [Google Scholar]
- Wilkins MR, Gasteiger E, Tonella L, Ou K, Tyler M, Sanchez JC, Gooley AA, Walsh BJ, Bairoch A, Appel RD, et al. Protein identification with N and C-terminal sequence tags in proteome projects. J Mol Biol. 1998;278:599–608. doi: 10.1006/jmbi.1998.1726. [DOI] [PubMed] [Google Scholar]
- Woo SH, Fukuda M, Islam N, Takaoka M, Kawasaki H, Hirano H. Efficient peptide mapping and its application to identify embryo proteins in rice proteome analysis. Electrophoresis. 2002;23:647–654. doi: 10.1002/1522-2683(200202)23:4<647::AID-ELPS647>3.0.CO;2-O. [DOI] [PubMed] [Google Scholar]
- Yang P, Liang Y, Shen S, Kuang T. Proteome analysis of rice uppermost internodes at the milky stage. Proteomics. 2006;6:3330–3338. doi: 10.1002/pmic.200500260. [DOI] [PubMed] [Google Scholar]
- Yang P, Chen H, Liang Y, Shen S. Proteomic analysis of de-etiolated rice seedlings upon exposure to light. Proteomics. 2007a;7:2459–2468. doi: 10.1002/pmic.200600215. [DOI] [PubMed] [Google Scholar]
- Yang P, Li X, Wang X, Chen H, Chen F, Shen S. Proteomic analysis of rice (Oryza sativa) seeds during germination. Proteomics. 2007b;7:3358–3368. doi: 10.1002/pmic.200700207. [DOI] [PubMed] [Google Scholar]
- Yang MF, Liu YJ, Liu Y, Chen H, Chen F, Shen SH. Proteomic analysis of oil mobilization in seed germination and postgermination development of Jatropha curcas. J Proteome Res. 2009;8:1441–1451. doi: 10.1021/pr800799s. [DOI] [PubMed] [Google Scholar]
Internet Resources
- MASCOT database, Matrix Science, London, UK, http://www.matrixscience.com (accessed on September 2, 2011).
- ExPASy, http://www.expasy.ch/tools/protparam.html (accessed on April 17, 2012).
- InterProscan, http://www.ebi.ac.uk/Tools/InterProScan (accessed on March 19, 2012).
- WEGO program for Gene Ontology classification, http://wego.genomics.org.cn (accessed on April 12, 2012).
- Gene Ontology, http://www.geneontology.org (accessed on April 12, 2012).
Associated Data
This section collects any data citations, data availability statements, or supplementary materials included in this article.
Supplementary Materials
Table S1 - The protein spots identified by MALDI-TOF-MS.
Table S2 - The unknown proteins identified by MALDI-TOF-MS.


