

Abstract
Purpose
Roux-en-Y gastric bypass surgery (RYGB) is an effective treatment for morbid obesity. Increased alcohol abuse after RYGB resulted in recommendations to exclude patients with alcohol abuse histories from RYGB. The purpose of our study was to examine the effects of a RYGB on ethanol intake in diet-induced obese rats (high-fat diet).
Methods
Animals underwent RYGB and were habituated along with their sham-operated obese controls and with lean rats to increasing concentrations of ethanol in a two-bottle choice paradigm.
Results
RYGB rats’ daily consumption of ethanol averaged 2 g/kg at 2% habituation and 3.8 g/kg at 4% habituation, twice as much as sham-operated obese controls and 50% more than normal-diet lean controls. Obese controls drank on average 1 g/kg of ethanol (2 and 4%), significantly less (50%) than lean controls. RYGB rats when given higher ethanol concentrations (6 and 8%) or no ethanol drank significantly more water than lean and obese controls (66 and 100% respectively) and their enhanced total fluid intake was associated with increased food intake, which was significantly higher than in lean (66% more calories; food + alcohol) and obese controls (44% more calories). The lower alcohol intake in the obese controls than in the lean rats suggests that obesity may interfere with alcohol’s rewarding effects and RYGB may remove this protective effect.
Conclusions
The overall enhancement of consummatory behaviors (both ethanol and water) suggests that RYGB may facilitate alcohol consumption, which in vulnerable individuals could lead to abuse and addiction.
Keywords: Alcohol, Ethanol Abuse, High Fat Diet, Roux-en-Y, Bariatric, Gastric Bypass
Introduction
Gastric bypass is an effective treatment for morbid obesity and related co-morbidities and the Roux-en-Y gastric bypass (RYGB) is the most frequently used procedure with over 200,000 surgeries performed nationally in 2009 [1]. Following RYGB, patients typically lose approximately 30% of total body weight or 60–70% of excess body weight [2]. Reductions in weight can be achieved more quickly and with longer term health benefits with RYGB than with other gastric procedures [3].
Surgical stapling of the stomach creates a small (1 – 2 oz) proximal gastric pouch, which is connected to the mid-jejunum, bypassing the distal stomach and proximal small intestine mechanically restricting food intake (See Figure 1). In addition, bypassing the proximal intestine appears to alter the regulation of appetite and satiety through changes in gut endocrine function. In addition to feelings of fullness after eating much smaller amounts [2], recent studies have identified postprandial changes in gut hormone secretion (i.e increased GLP-1 and PYY release) [4]. Many of these gut peptides influence appetite and satiety through their effects on the brain. A recent brain imaging study reported increases in striatal dopamine D2 receptors 6 weeks after RYGB [5]; though another study reported striatal D2 receptors decreases [6].
Figure 1.

Illustration of the rat Roux-en-Y Gastric Bypass Procedure. The stomach is reduced to a small pouch (dashed line) by stapling providing full separation between the gastric pouch and excluded stomach. The pouch then is connected directly to the distal trunk of previously divided jejunum (solid line, no fill). The larger portion of the stomach (dark grey) and the duodenum with the proximal segment of divided jejunum (light grey: bilio-pancreatic limb) is bypassed by food and reconnected to the Roux-Limb to form a common channel.
There have been many reported cases in humans of the emergence of problematic behaviors after gastric bypass, such as depression, assorted phobias, post-traumatic stress disorder, bulimia and anorexia and tobacco and other stimulant abuse [1, 7–8]. However these outcomes are hard to attribute to the RYGB procedure due to their high co-morbidity with obesity and their high prevalence in individuals seeking a RYGB [7].
Previous reports showed that some patients exhibited not just a greater vulnerability for drug abuse after RYGB [8] but also had difficulty with long-term coping. Indeed bariatric surgery has led to the emergence of a new eating disorder - Post Surgical Eating Avoidance Disorder (PSEAD)[9] characterized by intense fear of gaining back weight.
Particular concern has been raised by an increased risk for ethanol (EtOH) abuse following RYGB surgery. As a result ethanol abuse represents a relative contraindication for surgery in most bariatric surgery programs [10]. Though studies have shown that RYGB patients have higher and longer-lasting blood EtOH concentrations, and a shorter period of onset than non-surgical controls when consuming similar amounts of ethanol [11–12], the mechanisms underlying the enhanced alcohol consumption reported by some patients after surgery [7] is unclear. Moreover, the extent to which RYGB alters the rewarding effects of alcohol to our knowledge has not been investigated.
Here we assess the effects of RYGB on ethanol consumption in a rodent model of high fat diet-induced obesity. Experimental animals were compared to sham operated animals fed ad-libitum (Sham-HF), and also to a non-operated group, which was fed normal rat chow ad-libitum (Naïve-ND). We show that RYGB HF rats show markedly increased EtOH consumption relative to Sham-HF and Naive-ND rats, at lower ethanol levels (2% and 4% concentration) when habituated to increasing ethanol concentrations, and also after ethanol is reintroduced following a 2-week deprivation period. In contrast, obese control rats (Sham-HF) had reduced EtOH intake and preference when compared to the other groups at the high alcohol concentrations (6 and 8%), and when compared to the RYGB rats for all EtOH concentrations.
Materials and Methods
Animals
Forty-three adult male Sprague-Dawley rats (Charles River, Wilmington, MA), were used for this study. At 4 weeks of age the rats were put on either high fat (HF) or normal diet (ND), which was maintained throughout the entire study period. At 12 weeks of age (8 weeks on the special diet), the high fat diet-induced obese (HF-DIO) rats were divided in three groups to receive either RYGB (n=11, ‘RYGB’), or sham surgeries (n=23, ‘Sham-HF’). Of the sham-operated rats, 11 received high-fat food and water ad-libitum while 12 received unrestricted water but were pair-fed the previous daily average of HF diet consumed by the RYGB group. However, due to the fact that the RYGB group consumed more grams of food daily than the HF groups, these animals took in as much food as those who were fed ad-lib. Since there were no significant differences in bodyweight, food, EtOH or water intake between the two HF-DIO groups, we averaged the result from both and report them together as one group (Sham-HF). In parallel a group of rats (n=9) were given unlimited access to normal chow and water (Naive-ND) to serve as comparison for diet effects. The EtOH study was started two months after the surgeries at the age of twenty-one weeks. All experiments were conducted in conformity with the National Academy of Sciences Guide for Care and Use of Laboratory Animals (National Academy of Sciences NRC et al, 1996), and approved by the Penn State University College of Medicine and Brookhaven National Laboratory Institutional Animal Care and Use Committee protocols.
High-Fat Diet
At 4 weeks of age, the RYGB and Sham-HF surgery groups were introduced to a high fat (HF) diet (60% kcal from fat; D12492, Research Diets, Inc., New Jersey). We chose 60% high fat food rather than a lower concentration since its being highly used in the literature as a reliable model to induce obesity.. The naïve control group consumed normal rat chow (13.5% kcal from fat; Purina Mills, Missouri). Food intake was measured by weighing the animals’ food weekly.
Apparatus
Prior to the study, water was supplied from an inverted cylinder with a stainless steel sipper tube in the middle. From the bottle habituation phase onward water and EtOH were supplied in cylindrical polypropylene drinking tubes (150 ml), and fitted with a one-hole rubber stopper with a stainless steel drinking spout. EtOH solutions were made using 100% ethanol (Pharmco-AAPER) mixed v/v with distilled water.
Surgery
All surgical procedures (sham or RYGB) were performed at Pennsylvania State University College of Medicine. A detailed description of the surgical technique, surgical controls and perioperative care for RYGBP has been published [13]. The procedure is shown in Figure 1. Surgical controls received the same protocols except that only intestinal manipulation was performed without forming anastomoses.
Behavioral Procedures
See Figure 2a for timeline of experiment. Starting on Experiment Day 1, all rats were presented with a 24 hour continuous 2-bottle choice; one bottle with water and one with 2% v/v EtOH. After 4 days, the EtOH concentration was increased to 4% v/v for another 4 days, and then 6% for 2 weeks, and then 8% for 10 days. The gradual habituation method has been used in the past to differentiate EtOH intake among groups of rats [14–15]. After 10 days of 8%, the bottles containing EtOH were replaced with bottles containing water for 2 weeks of EtOH deprivation. After 2 weeks, 8% EtOH solutions were re-introduced to the home cages, for an EtOH reinstatement of 4 days, using a two-bottle choice between EtOH and water. Immediately following the first reinstatement the procedure was repeated, 2 weeks of deprivation followed by a second reinstatement of 4% EtOH. EtOH deprivation has been reported to cause increased EtOH intake in rats immediately after reinstatement [16–17]. After reinstatement the time for EtOH-deprived rats to return to EtOH baseline intake is four days [17]. Liquid intake of each bottle was monitored daily by weighing the bottles, and body weight and food intake were measured weekly. Bottles were swapped daily to control for place preference. Due to the length of ethanol exposure in this study and the stress induced by frequent blood sampling, blood alcohol concentration (BAC) was not practical, and our data consisted of ethanol intake (g/kg).
Figure 2.
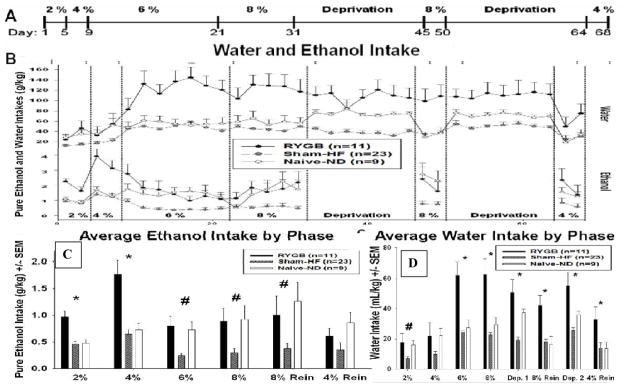
(a) Experimental Procedure timeline. (b) Mean (Summed Bi-Daily - the sum of two days; ± SEM) EtOH and water intake per kilogram of body weight for gastric bypass (RYGB), sham-operated animals fed a high-fat diet (Sham-HF) and naive-normal diet (Naïve-ND) during access to EtOH at varying concentrations. (c) Mean (± SEM) EtOH intake per kilogram of body weight for each phase of study for RYGB, Sham-HF and Naïve-ND animals during the EtOH drinking period at various concentrations. * p<0.05 as compared to Sham-HF and Naïve-ND, # p<0.05 as compared to Sham-HF (d) Mean (± SEM) water intake per kilogram of body weight for each phase of study for RYGB, Sham-HF and Naïve-ND animals during the study at various concentrations. * p<0.05 as compared to Sham-HF and Naïve-ND, # p<0.05 as compared to Sham-HF
Statistical Methods
Differences between the 3 experimental groups, RYGB, Sham-HF and Naïve-ND, respectively, were assessed by 2-way repeated measures ANOVA’s with Group as a between-subjects factor and Time as within-subjects factor, based on either daily (EtOH intake and preference, total fluid intake) or weekly measures (body weight and food intake). Graphs show bi-daily data for the purpose of condensing data points though daily data points were used for statistical analyses. Additional 2-way ANOVAs were used to analyze EtOH intake, preference and total fluid intake based on experimental phase and EtOH concentrations. To discern the statistical differences between differing concentrations of EtOH solutions, 2-way ANOVA’s were performed both within a given concentration level, and between levels using the average intake per group. To compute calories consumed the kilocalorie per gram ratio of each food (3.1 kcal/g normal chow, 5.24 kcal/g high fat chow) was multiplied by the grams of food eaten that week, and then we added the kilocalories from ethanol. When appropriate, pairwise comparisons were performed with the Holm-Sidak post-hoc test. A pre-determined p value of p <0.05 was considered significant.
Results
EtOH Intake
The intake of EtOH (g/kg/day) for all groups during EtOH habituation and reinstatement are shown in Figure 2b and 2c. Two-way repeated measures ANOVA’s revealed significant main effects of Group [F (2, 1674) = 12.610; p<0.001], Time [F (39, 1674) = 4.605; p<0.001] and Concentration [F (5, 247) = 4.585; p<0.001], with significant interaction between Group and Concentration [F (10, 247) = 2.544, p=0.007] and between group and time [F (78, 1674) = 1.917; p < 0.001].
Holm-Sidak pairwise comparisons show that during ethanol habituation, RYGB animals drank significantly more g/kg of EtOH than Sham-HF rats at all ethanol concentrations, and drank significantly more than Naïve-ND rats for the ethanol concentrations of 2% and 4% (Table 1). In turn, Naïve-ND animals drank significantly more EtOH than the Sham-HF group during the ethanol concentration of 6% (Table 1).
Table 1.
Pairwise comparisons between groups for EtOH intake normalized to body weight, water intake normalized to body weight and total fluid intake normalized to body weight.
| Habituation | Deprivation 1 | 8% Reinstatement | Deprivation 2 | 4% Reinstatement | ||||||||
|---|---|---|---|---|---|---|---|---|---|---|---|---|
| Ethanol Concentration: | Group Effects | 2% | 4% | 6% | 8% | |||||||
| EtOH Intake g/kg | RYGB vs HF | tP | 4.229 | tP | 5.391 | 4.955 | 3.77 | 2.515 | 2.082 | |||
| <0.001 | <0.001 | <0.001 | <0.001 | 0.016 | 0.044 | |||||||
| RYGB vs ND | tP | tP | 3.886 | 3.621 | ||||||||
| <0.001 | <0.001 | |||||||||||
| ND vs HF | tP | 2.935 | tP | 2.856 | 2.732 | |||||||
| 0.005 | 0.007 | 0.009 | ||||||||||
| H2O Intake mL/kg | RYGB vs HF | tP | tP | 2.302 | 5.622 | 6.083 | 6.126 | 4.394 | 3.847 | 2.091 | ||
| 0.026 | <0.001 | <0.001 | <0.001 | <0.001 | 0.001 | 0.05 | ||||||
| RYGB vs ND | tP | tP | 4.081 | 4.126 | 2.424 | 3.754 | 2.642 | 2.038 | ||||
| <0.001 | <0.001 | 0.02 | <0.001 | 0.016 | 0.032 | |||||||
| ND vs HF | tP | tP | 2.853 | |||||||||
| 0.007 | ||||||||||||
| Total Fluid Intake mL/kg | RYGB vs HF | tP | 7.083 | tP | 6.85 | 7.381 | 8.024 | 9.475 | 8.169 | 9.242 | 4.931 | 5.634 |
| <0.001 | <0.001 | <0.001 | <0.001 | <0.001 | <0.001 | <0.001 | <0.001 | <0.001 | ||||
| RYGB vs ND | tP | 5.131 | tP | 3.878 | 4.061 | 4.613 | 5.309 | 5.164 | 6.023 | 4.154 | 4.57 | |
| <0.001 | <0.001 | <0.001 | <0.001 | <0.001 | <0.001 | <0.001 | <0.001 | <0.001 | ||||
| ND vs HF | tP | tP | 2.521 | |||||||||
| 0.016 | ||||||||||||
During reinstatement, RYGB and Naïve-ND rats consumed more EtOH than Sham-HF animals during 8% reinstatement, with no significant differences between groups for 4% reinstatement (Table 1).
Body Weight
Figure 3a shows the changes in body weight during the study. As expected, RYGB rats weighed significantly less than Sham-HF and Naïve-ND. A Two-way repeated measure ANOVA revealed significant effects of Group [F (2, 1120) = 13.370; p<0.001] and Time [F (30, 1120) = 255.262; p<0.001] and a significant Group x Time interaction [F (60, 1120) = 38.824; p<0.001]. The largest differences were seen between RYGB and Sham-HF rats (t= 4.662; p<0.001). Sham-HF animals also significantly outweighed Naive-ND animals (t=3.181; p=0.003).
Figure 3.

(a) Mean weekly (± SEM) body weight in grams for each group of animals over 31 weeks. (b) Mean weekly (± SEM) food intake in grams for each group. (c) Mean weekly (± SEM) food intake in kilocalories for each group of animals over 31 weeks. (d) Mean weekly (± SEM) normalized food intake in kilocalories per kilogram of body weight for each group.
Food Intake
Figure 3b shows mean weekly food intake in grams. A Two-way repeated measures ANOVA showed significant Group [F (2, 766) = 14.457; p<0.001], and Time effects (study week) [F (19, 766) = 4.297; p<0.001] and a significant interaction between Group and Time [F (38,766) =2.002; p<0.001]. Pairwise comparisons report that Naive-ND animals ate significantly more grams of food than Sham-HF animals (t=4.266; p<0.001; Figure 3b). RYGB rats consumed significantly more high fat food than the Sham-HF group (t= 4.197; p<0.001; Figure 3b).
Next, a similar two-way ANOVA showed significant changes in weekly caloric intake from food and EtOH (Figure 3c) dependent on Group [F (2, 766) = 23.157; p<0.001], and Time (study week) [F (19, 766) = 7.935; p<0.001], with significant interactions between group and time [F (38,766) =2.604; p<0.001]. Similarly, a two-way ANOVA showed significant effects on caloric intake when normalized to bodyweight [main effects of Group {F (2, 758) = 31.743; p<0.001}; Time {F (19, 758) = 5.626; p<0.001} interaction between Group and Time {F (38, 758) = 10.975; p<0.001} Figure 3d]. Pairwise comparisons show that RYGB rats consumed around 240% more kilocalories/kg compared to both Sham-HF (t=3.744; P<0.001), and Naive-ND (t=6.203; p<0.001) while there was no difference between Sham-HF and Naïve-ND rats (Figure 3d).
Fluid Intake
Figure 4a shows the normalized total fluid intake in mL/kg for all animals. A Two-way repeated measures ANOVA showed significant main effects of Group [F (2, 2643) = 33.189; p<0.001], Time [F (67, 2643) = 2.192; p<0.001] and the interaction of Group x Time [F (134, 2643) =2.350; p<0.001] on total fluid intake (water and EtOH) when controlled for bodyweight (Figure 4, Table 1). Water intake (water bottle only), was shown to significantly change with Time [F (67, 2648) = 9.937; p<0.001] and Group x Time interaction [F (134, 2648) = 2.812; p<0.001; Figure 4a, Table 1) but not Group alone. Holm-Sidak post-hoc comparisons showed that RYGB rats drank significantly more water than Sham-HF and Naive-ND rats (100% and 66% respectively) beginning at 6% EtOH and significantly more total fluid than either control group throughout the entire study (Figure 4, Table 1).
Figure 4.
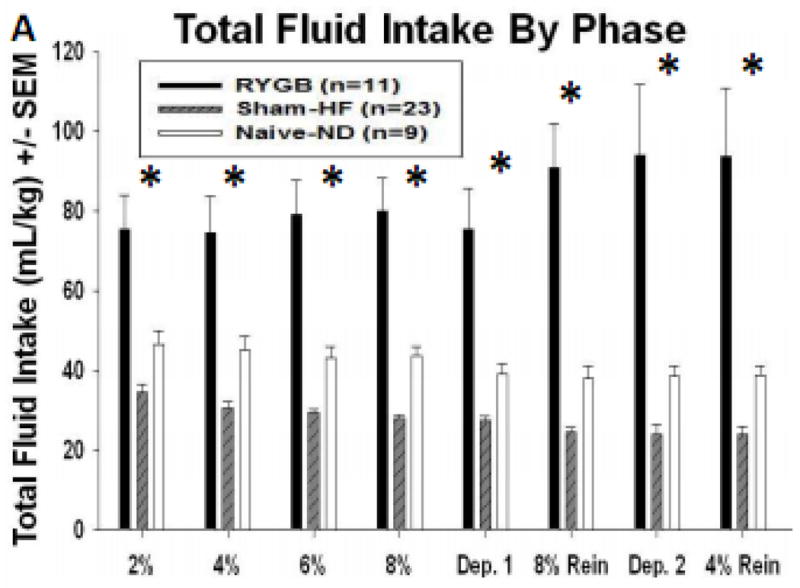
Mean (± SEM) total fluid intake per kilogram of bodyweight across each phase of study for RYGB, Sham-HF and Naïve-ND animals, * p<0.05 as compared to Sham-HF and Naïve-ND.
Linear regression analysis was run to determine the relationship between food intake (g/kg) and total fluid intake (ml/kg). There was a significant positive association between these two variables for the RYGB rats [F (1, 13) = 4.6726; r=0.5142; p=0.0499]; however, this association was not significant for the Sham-HF or Naïve-ND rats. Separate analysis for water versus EtOH and food intake did not reach significance for any of the experimental groups.
Discussion
RYGB rats drank significantly more EtOH (low and high dose) during habituation and reinstatement relative to Sham-HF animals and also drank significantly more EtOH (low dose) during habituation than Naïve-ND rats. Specifically, during habituation RYGB rats had 300–400% greater daily EtOH intake than Sham-HF rats and 50–100% greater ethanol intake than Naïve-ND. This effect remained apparent after normalizing for body weight (Figure 2b).
EtOH intake in RYGB rats when compared with Sham-HF rats was significantly higher throughout the 2%, 4%, 6% and 8% EtOH habituation, and during the 8% reinstatement. In contrast, EtOH intake in RYGB rats when compared with Naïve-ND rats was only significantly higher for the low EtOH concentrations (2 and 4%) and only during the habituation phase (Figures 2b and 2c; Table 1). Sham-HF rats showed the lowest EtOH intake both when compared to RYGB and Naïve-ND suggesting a protective effect of obesity vis-a-vis EtOH consumption. The fact that there were no differences in EtOH intake between RYGB and Naïve-ND during reinstatement (Figure 3d) suggests that RYGB may remove the protective effect that obesity has on alcohol intake. Note that here we excluded a protective effect of HF diet on alcohol intake since both the obese control (Sham-HF) and the RGYB rats were exposed to HF diets. Moreover studies on the effects of HF diets on EtOH intake have shown either increased intake [18] or varying effects [19] but no evidence of reductions in EtOH intake.
Here we also showed that RYGB rats consumed significantly more food and total calories (food + alcohol) than obese or lean controls (Figures 3b–d). This differs from prior findings on RYGB rats that showed markedly decreased caloric intake [20–21]. These discrepancies may reflect the fact that we exposed RYGB to HF diets whereas prior studies exposed obesity-prone animal strains to normal chow diets [21]. The consistency of the high fat diet differs from that of chow in that it is softer and contains more liquid allowing RYGB rats to consume larger volumes that from chow food. Also we calculated food intake as the difference between the weight of the food placed in the cage and the weight of the food removed on the following day. However this is not a precise measure since rats will frequently gnaw on food and significant amounts drop through the open bottom cage. It is also possible that the longer period elapsed from surgery in our study (26 weeks) than in prior ones (3–15 weeks) allowed the gastrointestinal systems of our RYGB animals to adapt allowing them to feed more frequently [21]. In fact 20% of patients have been reported to regain and have ‘food urges’ about one year after their RYGB procedure [22–23].
Excessive malabsorption of vitamins and micronutrients occurs with RYGB procedures, which also severely hinder the absorption of dietary fat [24]. Thus the excessive food consumption in the RYGB rats may have reflected an attempt to compensate for their decreased absorption of fat and other nutrients. Fecal fat analysis may be used in the future to test this hypothesis.
It has to be noted that anatomic reasons (i.e. the rat stomach contains a thin walled rumen which cannot be surgically divided), the operation in rats is not as restrictive as in humans and the pouch-size greatly varies across laboratories (for a review, see [25]). Furthermore, RYGB procedures differ by surgeon, and in our study a 30 cm portion of the bilio-pancreatic limb was bypassed as opposed to 10–16 cm portion used in studies reporting less food intake [20–21, 25]. Greater limb bypass means less nutrient absorption, which may contribute to an increased drive for food intake due to the likely decrease in nutrient absorption. Stylopoulous and Xu both report weight stabilization after the initial weight loss from the RYGB procedure, which suggests in our model as well as theirs, that the experimental animals maintain weight homeostasis through caloric consumption.
It is interesting to note that for the RYGB rats only, food intake was positively associated with increases in total fluid intake, which suggests that their total fluid intake may be driven in part by the increased food consumption requiring the associated intake of fluids. However, the correlation was not significant when assessed for water or EtOH alone, which may reflect the fact that the relevant variable may have been total liquid intake. Ethanol intake was not significantly correlated with water intake for the RYGB or HF groups.
The highest EtOH intake in the RYGB animals was seen for the low concentrations (2 and 4%) (Figures 2b and 2c), which could reflect enhanced sensitivity to the rewarding effects of low EtOH concentrations. This could reflect the faster absorption of EtOH [12], the reduced metabolism [26] of EtOH following RYGB surgery and/or the lower body weight and hence greater brain bioavailability of EtOH [20].
The RYGB rats also consumed more 8% EtOH during reinstatement relative to Sham-HF rats, but did not differ from Naive-ND rats. We did not observe a rebound in EtOH intake following 2-week EtOH deprivation in any of the groups, which differs from other reports [16]. The reasons for these differences are unclear and may reflect differences in doses and regimes of EtOH exposures. Also the short time period used for habituation may have precluded us from observing a rebound [16].
Interestingly, RYGB animals did not differ on their preference of EtOH over water from the other groups) and their water intake was also significantly higher than that of the other groups when exposed to high EtOH concentrations (6 and 8%) or when not given ethanol (Table 1, Figure 2b). RYGB rats demonstrated a 66% increase in water intake compared to Naïve-ND rats and up to a 100% increase compared to Sham-HF rats. The generalized increase of total fluid consumption (EtOH and water) explains why preference measured by EtOH over total fluid intake did not differ between RYGB and the other cohorts.
The increased EtOH consumption in the RYGB rats over the Sham-HF rats could reflect differences in EtOH metabolism, bioavailability and/or changes in alcohol’s pharmacokinetics [12]. Alcohol metabolism is disrupted after RYGB surgery and the disruption increases with the time passed following the procedure [26]. In contrast, the absorption of ethanol increases drastically, leading to an increased sensitivity [12], which could explain the drop-off of ethanol intake in the RYGB group at the 6% and 8% EtOH concentrations, and the high levels of drinking at 2% and 4%. Thus the combination of high sensitivity to low dose ethanol with increased drinking of all solutions (water and EtOH) could explain why the RYGB animals did not show a preference for EtOH over water even when they were consuming markedly more than the control groups.
Ethanol consumption could also reflect metabolic changes triggered by the surgery. For example, increased sensitivity to ghrelin following surgery may have contributed, since ghrelin increases ethanol consumption and ghrelin antagonists block the rewarding effects of alcohol in rodents [27]. Resistance to ghrelin in diet induced obese rodents [28] could explain the lower alcohol consumption in the Sham-HF animals. As of now the findings on the effects of bariatric surgery in ghrelin concentration have been inconsistent; one study showed decreases [29], others showed no changes and one showed increases [30]; and to our knowledge there are no reported studies on the effects of bariatric surgery on ghrelin sensitivity. Similarly changes in leptin concentration and sensitivity following RYGB [31] may have contributed since leptin also modulates reward centers of the brain [32]. However since we did not measure ghrelin nor leptin we can not test this hypothesis.
Ethanol consumption occurs both for its nutrient (calories) and pharmacological effects (increasing dopamine and endogenous opiates among others) [16]. The fact that RYGB rats also showed increased food consumption suggests that the enhanced EtOH intake may be influenced in part by EtOH’s caloric content. Interestingly gastric bypass in humans has been shown to increase the expression of dopamine D2 receptors in the ventral striatum and caudate nucleus by one study [5] though another study showed the opposite effect [6]. This is significant since the ventral striatum is involved with alcohol’s pharmacological effects [33]. Thus changes in brain dopamine neurotransmission following gastric bypass could also contribute to enhanced ethanol intake. The caloric effect of a 2% or 4% solution (the EtOH concentrations at which the RYGB group was shown to have increased consumption) is minor compared to the caloric intake from high fat food, but our study suggests that these solutions may be consumed more by RYGB subjects, presumably due to enhanced ethanol absorption [12]; hindered metabolism [26] following a RYGB and a negative energy balance relative to the control groups.
In summary, here we show that gastric bypass surgery significantly increased alcohol consumption of low EtOH concentrations and increased water intake (at high EtOH concentrations), which provides some support for the clinical reports that bariatric surgery is associated with an increased risk for alcohol abuse. We also document a protective effect of HF-induced obesity on alcohol intake. Though we postulate that metabolic adaptations with obesity (ie ghrelin and leptin resistance) may underlie the protective effects of obesity toward consumption of large quantities of EtOH and their reversal following surgery may underlie the risk for alcohol abuse, further studies are needed to test this and other metabolic factors that could affect caloric and fluid intakes.
Acknowledgments
This work was supported by the NIAAA (AA 11034 & AA07574, AA07611) DK080899 (AH). We thank the SULI program for partial support of Mike Subrize. We also thank Nikhil K. Acharya, Robert Bellezza and Michael Miller for their help with the care of the animals.
Footnotes
Conflict of Interest:
Panayotis K. Thanos, Ph.D, Mike Subrize, B.S., Foteini Delis, Ph.D, Robert N. Cooney M.D., Derek Culnan, M.D., Mingjie Sun, Ph.D., Gene-Jack Wang, M.D., Nora D. Volkow, M.D. and Andras Hajnal, M.D., Ph.D. do not have any conflict of interest to disclose. This work was supported by the NIAAA (AA 11034 & AA07574, AA07611) DK080899 (AH).
References
- 1.Andrés M, et al. Roux-en-Y gastric bypass: major complications. Abdominal Imaging. 2007;32(5):613–618. doi: 10.1007/s00261-006-9086-z. [DOI] [PubMed] [Google Scholar]
- 2.Sugerman H, et al. Gastric bypass for treating severe obesity. Am J Clin Nutr. 1992;55(2):560S–566. doi: 10.1093/ajcn/55.2.560s. [DOI] [PubMed] [Google Scholar]
- 3.Marcus MD, Kalarchian MA, Courcoulas AP. Psychiatric Evaluation and Follow-Up of Bariatric Surgery Patients. Am J Psychiatry. 2009;166(3):285–291. doi: 10.1176/appi.ajp.2008.08091327. [DOI] [PubMed] [Google Scholar]
- 4.Ochner CN, et al. The neurohormonal regulation of energy intake in relation to bariatric surgery for obesity. Physiology & Behavior. 2010;100(5):549–559. doi: 10.1016/j.physbeh.2010.04.032. [DOI] [PMC free article] [PubMed] [Google Scholar]
- 5.Steele K, et al. Alterations of Central Dopamine Receptors Before and After Gastric Bypass Surgery. Obesity Surgery. 2010;20(3):369–374. doi: 10.1007/s11695-009-0015-4. [DOI] [PubMed] [Google Scholar]
- 6.Dunn JP, et al. Decreased dopamine type 2 receptor availability after bariatric surgery: Preliminary findings. Brain Res. 2010;1350:123–130. doi: 10.1016/j.brainres.2010.03.064. [DOI] [PMC free article] [PubMed] [Google Scholar]
- 7.Ertelt TW, et al. Alcohol abuse and dependence before and after bariatric surgery: a review of the literature and report of a new data set. Surgery for Obesity and Related Diseases. 2010;4(5):647–650. doi: 10.1016/j.soard.2008.01.004. [DOI] [PubMed] [Google Scholar]
- 8.Dutta S, et al. Methamphetamine Use Following Bariatric Surgery in an Adolescent. Obesity Surgery. 2006;16(6):780–782. doi: 10.1381/096089206777346646. [DOI] [PubMed] [Google Scholar]
- 9.Segal A, Kinoshita Kussunoki D, Aparecida Larino M. Post-Surgical Refusal to Eat: Anorexia Nervosa, Bulimia Nervosa or a New Eating Disorder? A Case Series. Obesity Surgery. 2004;14(3):353–360. doi: 10.1381/096089204322917882. [DOI] [PubMed] [Google Scholar]
- 10.Mottin C, et al. Histological Behavior of Hepatic Steatosis in Morbidly Obese Patients after Weight Loss Induced by Bariatric Surgery. Obesity Surgery. 2005;15(6):788–793. doi: 10.1381/0960892054222830. [DOI] [PubMed] [Google Scholar]
- 11.Klockhoff H, Naslund I, Jones AW. Faster absorption of ethanol and higher peak concentration in women after gastric bypass surgery. British Journal of Clinical Pharmacology. 2002;54:587–591. doi: 10.1046/j.1365-2125.2002.01698.x. [DOI] [PMC free article] [PubMed] [Google Scholar]
- 12.Hagedorn JC, et al. Does gastric bypass alter alcohol metabolism? Surgery for Obesity and Related Diseases. 2007;3(5):543–548. doi: 10.1016/j.soard.2007.07.003. [DOI] [PubMed] [Google Scholar]
- 13.Hajnal A, et al. Gastric bypass surgery alters behavioral and neural taste functions for sweet taste in obese rats. Am J Physiol Gastrointest Liver Physiol. 2010;299(4):G967–79. doi: 10.1152/ajpgi.00070.2010. [DOI] [PMC free article] [PubMed] [Google Scholar]
- 14.Gustafsson L, Ploj K, Nylander I. Effects of maternal separation on voluntary ethanol intake and brain peptide systems in female Wistar rats. Pharmacology Biochemistry and Behavior. 2005;81(3):506–516. doi: 10.1016/j.pbb.2005.03.016. [DOI] [PubMed] [Google Scholar]
- 15.Ploj K, Roman E, Nylander I. Long-term effects of maternal separation on ethanol intake and brain opioid and dopamine receptors in male wistar rats. Neuroscience. 2003;121(3):787–799. doi: 10.1016/s0306-4522(03)00499-8. [DOI] [PubMed] [Google Scholar]
- 16.Spanagel R, Hölter SM. Long-term alcohol self-administration with repeated alcohol deprivation phases: an animal model of alcoholism? Alcohol and Alcoholism. 1999;34(2):231–243. doi: 10.1093/alcalc/34.2.231. [DOI] [PubMed] [Google Scholar]
- 17.Siegmund S, et al. Influence of Age at Drinking Onset on Long-Term Ethanol Self-Administration With Deprivation and Stress Phases. Alcoholism: Clinical and Experimental Research. 2005;29(7):1139–1145. doi: 10.1097/01.alc.0000171928.40418.46. [DOI] [PubMed] [Google Scholar]
- 18.Carrillo CA, et al. A high-fat meal or injection of lipids stimulates ethanol intake. Alcohol. 2004;34(2–3):197–202. doi: 10.1016/j.alcohol.2004.08.009. [DOI] [PubMed] [Google Scholar]
- 19.Prasad A, Abadie JM, Prasad C. Can dietary macronutrient preference profile serve as a predictor of voluntary alcohol consumption? Alcohol. 1993;10(6):485–489. doi: 10.1016/0741-8329(93)90070-5. [DOI] [PubMed] [Google Scholar]
- 20.Stylopoulos N, Hoppin AG, Kaplan LM. Roux-en-Y Gastric Bypass Enhances Energy Expenditure and Extends Lifespan in Diet-induced Obese Rats. Obesity. 2009;17(10):1839–1847. doi: 10.1038/oby.2009.207. [DOI] [PMC free article] [PubMed] [Google Scholar]
- 21.Xu Y, et al. Gastric Bypass Model in the Obese Rat to Study Metabolic Mechanisms of Weight Loss. Journal of Surgical Research. 2002;107(1):56–63. doi: 10.1006/jsre.2002.6508. [DOI] [PubMed] [Google Scholar]
- 22.Odom J, et al. Behavioral predictors of weight regain after bariatric surgery. Obes Surg. 2010;20(3):349–56. doi: 10.1007/s11695-009-9895-6. [DOI] [PubMed] [Google Scholar]
- 23.Kalarchian M, et al. Binge Eating Among Gastric Bypass Patients at Long-term Follow-up. Obesity Surgery. 2002;12(2):270–275. doi: 10.1381/096089202762552494. [DOI] [PubMed] [Google Scholar]
- 24.Kumar R, et al. Fat malabsorption and increased intestinal oxalate absorption are common after roux-en-Y gastric bypass surgery. Surgery. 2011;149(5):654–661. doi: 10.1016/j.surg.2010.11.015. [DOI] [PMC free article] [PubMed] [Google Scholar]
- 25.Seyfried F, le Roux CW, Bueter M. Lessons learned from gastric bypass operations in rats. Obes Facts. 2011;4(Suppl 1):3–12. doi: 10.1159/000327301. [DOI] [PMC free article] [PubMed] [Google Scholar]
- 26.Woodard GA, et al. Impaired Alcohol Metabolism after Gastric Bypass Surgery: A Case-Crossover Trial. Journal of the American College of Surgeons. 2011;212(2):209–214. doi: 10.1016/j.jamcollsurg.2010.09.020. [DOI] [PubMed] [Google Scholar]
- 27.Jerlhag E, et al. Requirement of central ghrelin signaling for alcohol reward. Proceedings of the National Academy of Sciences. 2009;106(27):11318–11323. doi: 10.1073/pnas.0812809106. [DOI] [PMC free article] [PubMed] [Google Scholar]
- 28.Briggs DI, et al. Diet-Induced Obesity Causes Ghrelin Resistance in Arcuate NPY/AgRP Neurons. Endocrinology. 2010;151(10):4745–4755. doi: 10.1210/en.2010-0556. [DOI] [PubMed] [Google Scholar]
- 29.Cummings DE, et al. Plasma Ghrelin Levels after Diet-Induced Weight Loss or Gastric Bypass Surgery. New England Journal of Medicine. 2002;346(21):1623–1630. doi: 10.1056/NEJMoa012908. [DOI] [PubMed] [Google Scholar]
- 30.Pournaras DJ, le Roux CW. Ghrelin and Metabolic Surgery. International Journal of Peptides. 2010;2010:5. doi: 10.1155/2010/217267. [DOI] [PMC free article] [PubMed] [Google Scholar]
- 31.Faraj M, et al. Plasma Acylation-Stimulating Protein, Adiponectin, Leptin, and Ghrelin before and after Weight Loss Induced by Gastric Bypass Surgery in Morbidly Obese Subjects. Journal of Clinical Endocrinology & Metabolism. 2003;88(4):1594–1602. doi: 10.1210/jc.2002-021309. [DOI] [PubMed] [Google Scholar]
- 32.Volkow ND, Wang GJ, Baler RD. Reward, dopamine and the control of food intake: implications for obesity. Trends Cogn Sci. 2011;15(1):37–46. doi: 10.1016/j.tics.2010.11.001. [DOI] [PMC free article] [PubMed] [Google Scholar]
- 33.Boileau I, et al. Alcohol promotes dopamine release in the human nucleus accumbens. Synapse. 2003;49(4):226–231. doi: 10.1002/syn.10226. [DOI] [PubMed] [Google Scholar]