

Abstract
OBJECTIVES:
Obesity-associated carcinogenesis is postulated to be mediated through the proliferative actions of insulin and the insulin-like growth factor (IGF) family. The aim of this study was to determine whether the insulin/IGF-1 pathway is involved in the sequential progression from metaplastic Barrett's esophagus (BE) to dysplasia to esophageal adenocarcinoma (EAC).
METHODS:
Fasting serum levels of insulin, glucose, IGF-1, insulin growth factor binding protein-1 (IGFBP1), and IGFBP3 were measured in 44 non-dysplastic, 9 low-grade dysplasia (LGD), 12 high-grade dysplasia (HGD), and 10 EAC subjects. Immunohistochemistry was performed on paraffin-embedded tissue derived from BE cases using rabbit monoclonal antibodies to p-mammalian target of rapamycin (mTOR) and p-AKT, mouse monoclonal antibody to Ki-67, and rabbit polyclonal antibody to p-insulin receptor substrate 1 (IRS1).
RESULTS:
Nineteen of 44 (43.2%) BE, 5/9 (55%) LGD, 8/12 (66.7%) HGD and EAC 7/10 (70%) cases showed strong staining for p-IRS1. A significantly higher proportion of HGD/EAC subjects showed p-IRS1 staining when compared with BE/LGD subjects, 63.6% vs. 41.5%, P<0.05. p-IRS1 immunostaining was moderately correlated with strong immunostaining of the downstream mediators p-AKT and p-mTOR (Spearman correlation coefficient=0.167 and 0.27 for p-IRS1/p-AKT and for p-IRS1/p-mTOR, respectively) and the proliferation marker Ki-67 (Spearman correlation coefficient=0.20, P=0.09). However, systemic levels of insulin, IGF-1, or IGF-2 were not associated with tissue immunostaining of p-IRS1.
CONCLUSIONS:
Activation of the insulin/IGF-1 pathway in BE may be associated with cellular proliferation and appears to have a role in the progression from metaplasia to cancer. The activation of the insulin/IGF-1 pathway at the tissue level is likely complex and does not have a simple association with systemic measures of insulin or IGF-1.
INTRODUCTION
The epidemiology of esophageal cancer has shifted dramatically over the past three decades.1 The incidence of esophageal adenocarcinoma (EAC) has risen dramatically in recent years, whereas the incidence of esophageal squamous cell carcinoma has declined.2, 3 This shift in relative incidence of the two histological subtypes of esophageal cancer has been partly attributed to the obesity epidemic and the metabolic changes that accompany accumulation of excess body weight. Obesity is accompanied by high serum levels of insulin, insulin resistance, altered levels of adipokines as well as proinflammatory mediators.4 High levels of insulin can disrupt the delicate balance of proliferation and apoptosis and promote tumorigenesis. Hyperinsulinemia may be the mechanistic link between excess body weight and obesity-driven carcinogenesis in multiple organs, including esophagus.5, 6, 7
The proliferative actions of insulin may be mediated through the phosphatidyl inositol 3-kinase (PI 3-K) pathway. Insulin and insulin growth factor-1 (IGF-1) bind to the IGF-1 receptor (IGF-1R). Ligand binding to the extracellular α subunit causes conformational changes in the IGF-1R, which activate the tyrosine kinase domain of the intracellular β subunit. Activation of the tyrosine kinases leads to rapid phosphorylation of insulin receptor substrate (IRS) 1 through 4 as well as many other signaling molecules. IRS proteins then mediate the metabolic and anti-apoptotic effects of insulin signaling through the activation of PI 3-K, protein kinase B (AKT) and mammalian target of rapamycin (mTOR).5, 8 Studies have shown activation of the PI 3-K/Akt pathway in a number of obesity-driven cancers such as breast,9, 10 pancreas,11, 12 lung,13 colorectum,14, 15 liver,16 and gallbladder.17
To our knowledge, only limited number of studies have explored the activation of the PI 3-K pathway in Barrett's esophagus (BE) based on human tissue samples.18 Further, it was of interest to compare activation of this pathway across the spectrum of esophageal carcinogenesis. We wanted to assess the PI 3-K pathway activation by means of immunohistochemistry of biopsy samples derived from normal squamous esophageal tissue, areas of intestinal metaplasia, that is, BE, low-grade dysplasia (LGD) and high-grade dysplasia (HGD), or EAC. We hypothesized that tissues in the latter spectrum of esophageal carcinogenesis would be more likely to show intense staining of the mediators of the PI 3-K pathway such as p-IRS, mTOR, and AKT.
METHODS
Study population
Patients with BE and EAC were approached about participation in the study at the time of their endoscopy, which was performed as a part of routine medical follow-up. Basic demographic and anthropometric characteristics were recorded at the time of recruitment. Multiple tissue biopsies were obtained during endoscopy using standard Seattle protocol for surveillance of intestinal metaplasia.19 Biopsies were submitted to pathology for processing. All diagnoses were reviewed by an expert gastrointestinal pathologist (J.W.) to assure correct diagnosis including identification of BE, LGD, HGD, and adenocarcinoma.
Measurement of IGF proteins
Blood samples were drawn in the fasting state and analyzed for serum insulin, IGFs, and their binding proteins. Serum concentrations of IGF-1, IGF binding protein (IGFBP)-1, and IGFBP-3 were measured by an enzymatically amplified two-step immunoassay available from Diagnostic Systems Laboratories (Webster, TX). Serum insulin concentration was measured by radioimmunoassay method using Siemens analyzer (Siemens Medical Solutions Diagnostics, Los Angeles, CA). IGF-1 measurement included an extraction step in which IGF-1 was separated from its serum-binding proteins. In addition to kit controls, aliquots of in house serum controls were used to determine assay performance for all serum markers. Serum concentrations of IGF-1, IGF-2, IGFBP-1, and IGFBP-3 were measured by enzymatically amplified two-step immunoassay available from Diagnostic Systems Laboratories.
Immunohistochemistry (IHC) staining
Formalin-fixed paraffin-embedded tissues were cut at 5 μm and mounted on charged slides. Tissues were deparaffinized in xylene, rehydrated through a series of graded ethanols, and rinsed in deionized water. Antigen retrieval was carried out in citrate buffer at 98 °C in a steamer for 20 min. Endogenous peroxidase activity was blocked in tissues where horseradish peroxidase reagents were used. Serum-free protein block was used for all tissues to inhibit nonspecific background staining. Primary antibodies were applied and tissues allowed to incubate for 60 min at room temperature. Antibodies used in this experiment, their supplier, and dilution specifications are summarized in Table 1. Bound antibodies were detected using BioCare Medical's polymer detection systems (Biocare Medical, Concord, CA). Rabbit primaries (pMTOR, pIRS1, and pAKT) were detected using an alkaline phosphatase-conjugated secondary for 20 min and visualized with a Fast Red chromogen. The Ki-67 mouse primary was detected using a horseradish peroxidase-conjugated secondary for 20 min and visualized with the 3, 3′-diaminobenzidine chromogen. Both chromogens were from Biocare Medical. Finally, slides were counterstained with hematoxylin. One pathologist (J.W.) reviewed and graded all the IHC stains. He was blinded to the patient's body mass index (BMI) and results of serologic studies. The slides were also coded so that the pathologist was also unaware of the IHC results from each of the individual immunostains corresponding to an individual patient. Staining was compared between specialized intestinal epithelium and adjacent squamous or fundic epithelium in biopsies. It was classified as strong or weak by the pathologist based on a composite assessment of the percentage of the visualized field as well as the intensity of immunohistochemical reaction specifically in Barrett's epithelium. Staining was characterized as strong when >50% Barrett's epithelium had intensely positive staining.
Table 1. Antibodies and conditions used for immunohistochemical staining.
| Antibody | Source | Dilution | Incubation time/temperature | Automated antigen detection |
|---|---|---|---|---|
| p-IRS (Tyr632) | Santa Cruz Biotechnology | 1:50 | 60 Min/room temperature | MACH3-AP (Biocare Medical) |
| p-AKT | Cell Signalling | 1:25 | 60 Min/room temperature | MACH3-AP (Biocare Medical) |
| p-mTOR | Cell Signalling | 1:50 | 60 Min/room temperature | MACH3-AP (Biocare Medical) |
| p-ki-67 | DAKO Cytomation/Clone: MIB-1/Isotype:IgG1κ | 1:100 | 30 Min/room temperature | MACH4-Universal Detection Kit (Biocare Medical) |
Abbreviations: AKT, protein kinase B; IRS, insulin receptor substrate; mTOR, mammalian target of rapamycin.
Statistical considerations
Simple descriptive statistics were performed to help define the study population and to describe the frequencies of risk factors among cases with BE or esophageal cancer. Differences in the distribution of baseline characteristics between the case subjects and controls were compared using the Wilcoxon rank sum test (for continuous data) or the Pearson χ2 test (for categorical data). Pearson spearman correlation coefficient was used to explore strength of association between IHC grading and serum levels of insulin, IGF-1, and its binding proteins. All statistical analyses were performed in Statistical Analysis Systems software package 9.1 (Cary, NC) or R statistical software (Vienna, Austria). Study was approved by the local Institutional Review Board for Human Investigation.
RESULTS
Our study group consisted of 75 patients. Sixty-five patients had BE, the remainder were diagnosed with EAC. Dysplasia was seen in 21 (32.3%) of 65 BE cases. In all, 44 out of the 65 cases (67.7%) had long segment BE, short segment BE was seen in the rest. The mean age of the study participants was 64.7±11.8 years. Study subjects were predominantly male (80%). Majority of study subjects (94.7%) were Caucasian, reflecting known demographics of BE.
Mean BMI of the study participants was 30.46±s.d. 5.51 kg/m2. There were no significant differences in mean BMI of subjects with long vs. short segment BE (30.4 vs. 30.6 kg/m2). Mean BMI of cases with EAC was 29.7 kg/m2, which was not significantly different from cases with BE, P=0.7. Mean waist to hip ratio did not significantly differ between BE cases and those with ECA (1.02±s.d. 0.22 vs. 1.01±s.d. 0.04, P=0.86).
Mean serum insulin levels were not significantly different between BE cases and those with ECA (12.1±s.d. 9.51 vs. 9.3±s.d. 6.5 μIU/ml (P=0.37), respectively). Mean IGF-1 of Barrett's cases was higher than in those with ECA (191.5±s.d. 80.9 vs. 150.9±s.d. 69.7 ng/ml), this difference showed a trend toward statistical significance (P=0.14). Mean IGFBP-3 was lower in patients with ECA (3076±s.d. 886.4 vs. 2789±s.d. 580.6 ng/ml), however, this difference was not statistically significant (P=0.33). Mean levels of insulin, IGF-1, and IGFBP-3 did not differ in BE cases with and without dysplasia (Figure 1).
Figure 1.
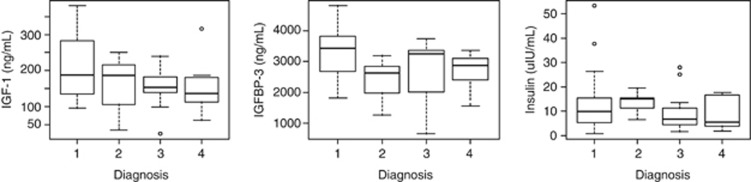
Serum levels of insulin growth factor-1 (IGF-1; left panel), insulin growth factor binding protein-3 (IGFBP-3; middle panel), and insulin (right panel) across spectrum of esophageal metaplasia. Diagnosis codes: 1=no dysplasia, 2=low-grade dysplasia, 3=high-grade dysplasia, 4=esophageal adenocarcinoma.
IHC results
Optimized IHC protocol was applied to 75 paraffin-embedded sections of esophageal tissue. A total of 75 esophageal tissue sections from 75 patients were submitted for IHC analysis. Staining intensity in the areas of special intestinal metaplasia and esophageal carcinoma was compared relative with surrounding normal esophageal tissue. Figure 2 shows staining pattern for each protein of interest. Staining for Ki-67 was predominantly nuclear, whereas phosphorylated mTOR, AKT, and IRS-1 antibodies displayed predominantly cytoplasmic staining pattern. Staining intensity was ranked as strong/intense vs. weak. Of the 65 BE cases analyzed in this study, 29 (44.6%) were considered to have intense staining for pIRS-1. Nine cases did not show any staining with the pIRS-1 antibody and the remainder of samples showed weak staining pattern. Strongly intense staining of p-mTOR was also observed in 27 (44.3%) of 65 cases. Eight cases did not show any staining for p-mTOR. Most cases stained only weakly for p-AKT (34/65, 52.3%). Ki-67 was explored as a marker of proliferation; 36/63 (54.0%) of cases showed an intense reaction with this antibody. Two cases did not show any immunohistochemical reaction with Ki-67 antibody. High serum levels of IGF-1, IGFBP-1, and IGFBP-3 did not correlate with intense staining of pIRS-1 (P trend >0.20 for all tested correlations). Subjects in the highest quartiles of serum insulin were more likely to show strongly intense staining for p-mTOR (P trend=0.13). Homeostatic model assessment-insulin resistance did not show any correlation with intensity of pIRS-1 staining (partial spearman coefficient=0.13, P=0.25). Intense staining of AKT correlated moderately with that of mTOR. Intense staining of pIRS-1 correlated weakly with intense staining of p-mTOR, p-AKT, and p-Ki-67. Partial Spearman coefficients and respective P values for all explored associations are listed in Table 2. Esophageal specimens with dysplasia and carcinoma were more likely to show intense staining for pIRS-1 than tissue derived from areas of intestinal metaplasia (Table 3).
Figure 2.

Transmitted light micrographs of tissue derived from Barrett's esophagus (BE). Upper panel shows staining of tissues derived from BE, which were graded ‘strong' for the expression of the indicated antibody, indicating that >50% of the visualized field had positive immunoreactivity. The lower panel shows BE that was minimally reactive for the relevant antibody. AKT, protein kinase B; IRS, insulin receptor substrate; mTOR, mammalian target of rapamycin.
Table 2. Correlation of staining of various antibodies with other proteins in the PI 3-K kinase pathway.
| pIRS | AKT | mTOR | Ki67 | |
|---|---|---|---|---|
| pIRS | — | 0.167a (0.16)b | 0.27 (0.02) | 0.20 (0.09) |
| AKT | — | 0.61 (<0.001) | 0.374 (0.002) | |
| mTOR | — | 0.246 (0.04) | ||
| Ki-67 | — |
Abbreviations: AKT, protein kinase B; BE, Barrett's esophagus; EAC, esophageal adenocarcinoma; IRS, insulin receptor substrate; mTOR, mammalian target of rapamycin; PI 3-K, phosphatidyl inositol 3-kinase.
Partial Spearman rank correlation is presented for BE and EAC cases.
Values in parentheses represent P values for statistical tests when the correlation test was not equal to 0. All statistical tests were two sided.
Table 3. Staining intensity of pIRS in relation to presence or absence of dysplasia or cancer.
| No pIRS staining | Weak pIRS staining | Strong pIRS staining | Total | P value (trend)a | |
|---|---|---|---|---|---|
| No dysplasia | 5 (11.4%) | 20 (45.5%) | 19 (43.2%) | 44 | — |
| Dyslasia (low or high grade) | 4 (19.1%) | 7 (33.3%) | 10 (47.6%) | 21 | 0.86 |
| Adenocarcinoma | 1 (10%) | 2 (20%) | 7 (70%) | 10 | 0.14 |
Abbreviations: BE, Barrett's esophagus; IRS, insulin receptor substrate.
Comparison of dysplastic BE and adenocarcinoma vs. BE without dysplasia.
DISCUSSION
The results of this study support activation of the insulin/IGF-1 axis in a proportion of cases of non-dysplastic BE, dysplastic BE, and EAC. We demonstrated intense staining with the phosphorylation of IRS-1, a specific indicator for activation of the insulin and IGF-1Rs, in 44% of BE, 47% of dysplastic BE, and 70% of EACs. Furthermore, the presence of phosphorylated IRS-1 showed weak-to-moderate correlation with the downstream mediators of the insulin/IGF-1 axis, phosphorylated AKT, and mTOR. Activation/phosphorylation of these molecules was closely correlated with cell proliferation as assessed by Ki-67. As increased cell proliferation is believed to contribute to carcinogenesis, this study suggests that this pathway may possibly have a role in the progression from metaplasia to dysplasia to carcinoma in BE.
Systemic measurements of insulin, IGF-1, and its binding proteins did not show any correlation with tissue phosphorylation of IRS-1 assessed by immunohistochemical staining. This may be due to the fact that pIRS-1 may also be activated by signaling molecules other than insulin and IGF-1, including the IGF-1R.19, 20, 21 Further, pIRS-1 may also cause activation of alternate proliferative pathways implicated in carcinogenesis, including the extracellular signal-regulated kinase mitogen-activated protein kinase pathway. The lack of correlation is not totally surprising given that insulin and IGFs are under complex physiologic control mechanisms, which closely regulate circulating and tissue levels of these hormones. The development of IGF knockout models and identification of patients with IGF-1 gene defects have provided evidence on the important role of circulating and locally produced IGF-1 in growth and development.22, 23, 24 Data on relative contribution of endocrine and paracrine/autocrine regulation of IGF-1 in esophageal carcinogenesis is sparse25 but is emerging for cancers of other body sites.26 It is possible that the systemic levels of insulin, IGF-1, and its growth factor family are altered at the tissue level by locally derived paracrine factors, which then determine how the signal is transmitted intracellularly. Systemic levels of insulin and IGF-1 may correlate positively or negatively with tissue derived mRNA levels for pIRS. Cancer cell lines may also have increased affinity to IGF-1 stimulation than normal, non-cancerous, tissue. This has been observed in prostate tissue where IGF-1 stimulation led to 10-fold upregulation of IGF-1R expression.27
We opted to use IHC assays in this mainly exploratory study because of their specific ability to identify phosphorylated proteins in BE and its associated lesions. A potential limitation of this study is that tissue mRNA expression or protein activation by western blot analysis was not measured. Quantative PCR analysis performed on laser captured BE epithelium could provide further support for this insulin/IGF-1 hypothesis in future experiments but will not be able to uniquely determine phosphorylation status.
Initial studies were performed with antibodies to phosphorylated IGF receptors. However, we found that these antibodies also cross-reacted with other growth factor receptors such as PDFGR when assessed by western blots (data not shown). The phosphorylated IRS-1 antibodies provided the best specificity and allowed us to assay the state of both the IGF-1R and IR, as both receptors phosphorylate IRS-1 on binding of substrate. However, this study cannot determine whether the insulin receptor, the IGF-1R, or both are active in Barrett's epithelium and EAC.
Further support for a potential role of the insulin/IGF-1 axis in esophageal carcinogenesis comes from a recent Australian case–control study demonstrating the association of diabetes mellitus and EAC.28 This study found that the risk of adenocarcinoma was increased 1.5 times in diabetics compared with population controls, although the risk was attenuated after adjusting for BMI. In addition, specific IGF-1 polymorphisms have been found to be associated with the reflux–metaplasia–dysplasia–cancer progression in another population-based study from Ireland.29 A more recent study also found evidence for activation of the IGF-1R in human adenocarcinomas and demonstrated that adenocarcinoma cell lines proliferate in response to IGF-1.25 Our study indicates that activation of this axis is already present at the precursor stage of BE. Future studies will have to determine whether subjects with BE who have more active cellular proliferation in response to activation of the insulin/IGF-1 pathways are at increased risk for progression to malignancy.
Finally, the size of this study was small, which could have prevented us from detecting some of the meaningful correlations. Several of the correlations observed in this study were above the P value of 0.05 and thus statistically insignificant, yet still smaller than a P value of 0.15, which would be indicative of a potentially significant trend. One possible approach to solve this problem would be to increase the study sample size and retest the null hypothesis of insulin–IGF-1 pathway involvement in esophageal carcinogenesis. Increasing the study sample size could, however, also increase the chance of achieving a false-positive result.
In summary, our study provides evidence that the insulin/IGF pathway is activated in a proportion of BE and a major proportion of EACs. In conjunction with our prior study that showed increased systemic levels of insulin and IGF-1 in subjects with BE,6 we propose that this pathway may partly mediate obesity-associated carcinogenesis in EAC. Increasing evidence indicates that this is an important pathway for further research. The effects of interventions that promote weight loss and medications that decrease insulin or IGF-1 need to be studied to determine whether they may prevent the progression from BE to cancer.
Study Highlights
Guarantor of the article: A. Chak, MD.
Specific author contributions: Dr K.B. Greer collected data and performed statistical analyses. A. Kresak supervised tissue preparation and immunohistochemical staining. Dr J. Willis reviewed and interpreted all tissue sections. Dr A. Chak was responsible for study concept and analysis. All authors participated in the preparation of the manuscript.
Study support: The study was supported by grants R21 CA135692 and U54 CA163060.
Potential competing interests: None.
References
- Pohl H, Welch HG. The role of overdiagnosis and reclassification in the marked increase of esophageal adenocarcinoma incidence. J Natl Cancer Inst. 2005;97:142–146. doi: 10.1093/jnci/dji024. [DOI] [PubMed] [Google Scholar]
- Wei JT, Shaheen N. The changing epidemiology of esophageal adenocarcinoma. Semin Gastrointest Dis. 2003;14:112–127. [PubMed] [Google Scholar]
- Sampliner RE. Epidemiology, pathophysiology, and treatment of Barrett's esophagus: reducing mortality from esophageal adenocarcinoma. Med Clin North Am. 2005;89:293–312. doi: 10.1016/j.mcna.2004.08.008. [DOI] [PubMed] [Google Scholar]
- Ryan AM, Duong M, Healy L, et al. Obesity, metabolic syndrome and esophageal adenocarcinoma: epidemiology, etiology and new targets. Cancer Epidemiol. 2011;35:309–319. doi: 10.1016/j.canep.2011.03.001. [DOI] [PubMed] [Google Scholar]
- Arcidiacono B, Iiritano S, Nocera A, et al. Insulin resistance and cancer risk: an overview of the pathogenetic mechanisms. Exp Diabetes Res. 2012;2012:789174. doi: 10.1155/2012/789174. [DOI] [PMC free article] [PubMed] [Google Scholar]
- Greer KB, Thompson CL, Brenner L, et al. Association of insulin and insulin-like growth factors with Barrett's oesophagus. Gut. 2012;61:665–672. doi: 10.1136/gutjnl-2011-300641. [DOI] [PMC free article] [PubMed] [Google Scholar]
- Roddam AW, Allen NE, Appleby P, et al. Insulin-like growth factors, their binding proteins, and prostate cancer risk: analysis of individual patient data from 12 prospective studies. Ann Intern Med. 2008;149:461–471. W83–8. doi: 10.7326/0003-4819-149-7-200810070-00006. [DOI] [PMC free article] [PubMed] [Google Scholar]
- Pollak M. Insulin and insulin-like growth factor signalling in neoplasia. Nat Rev Cancer. 2008;8:915–928. doi: 10.1038/nrc2536. [DOI] [PubMed] [Google Scholar]
- Bhargava R, Beriwal S, McManus K, et al. Insulin-like growth factor receptor-1 (IGF-1R) expression in normal breast, proliferative breast lesions, and breast carcinoma. Appl Immunohistochem Mol Morphol. 2011;19:218–225. doi: 10.1097/PAI.0b013e3181ffc58c. [DOI] [PubMed] [Google Scholar]
- Mireuta M, Darnel A, Pollak M. IGFBP-2 expression in MCF-7 cells is regulated by the PI3K/AKT/mTOR pathway through Sp1-induced increase in transcription. Growth Factors. 2010;28:243–255. doi: 10.3109/08977191003745472. [DOI] [PubMed] [Google Scholar]
- Roy SK, Srivastava RK, Shankar S. Inhibition of PI3K/AKT and MAPK/ERK pathways causes activation of FOXO transcription factor, leading to cell cycle arrest and apoptosis in pancreatic cancer. J Mol Signal. 2010;5:10. doi: 10.1186/1750-2187-5-10. [DOI] [PMC free article] [PubMed] [Google Scholar]
- Xu Z, Zhang Y, Jiang J, et al. Epidermal growth factor induces HCCR expression via PI3K/Akt/mTOR signaling in PANC-1 pancreatic cancer cells. BMC Cancer. 2010;10:161. doi: 10.1186/1471-2407-10-161. [DOI] [PMC free article] [PubMed] [Google Scholar]
- Marinov M, Fischer B, Arcaro A. Targeting mTOR signaling in lung cancer. Crit Rev Oncol Hematol. 2007;63:172–182. doi: 10.1016/j.critrevonc.2007.04.002. [DOI] [PubMed] [Google Scholar]
- Chen J, Katsifis A, Hu C, et al. Insulin decreases therapeutic efficacy in colon cancer cell line HT29 via the activation of the PI3K/Akt pathway. Curr Drug Discov Technol. 2011;8:119–125. doi: 10.2174/157016311795563820. [DOI] [PubMed] [Google Scholar]
- Chen J, Huang XF. The signal pathways in azoxymethane-induced colon cancer and preventive implications. Cancer Biol Ther. 2009;8:1313–1317. doi: 10.4161/cbt.8.14.8983. [DOI] [PubMed] [Google Scholar]
- Li QL, Gu FM, Wang Z, et al. Activation of PI3K/AKT and MAPK pathway through a PDGFRbeta-dependent feedback loop is involved in rapamycin resistance in hepatocellular carcinoma. PLoS One. 2012;7:e33379. doi: 10.1371/journal.pone.0033379. [DOI] [PMC free article] [PubMed] [Google Scholar]
- Li Q, Yang Z. Expression of phospho-ERK1/2 and PI3-K in benign and malignant gallbladder lesions and its clinical and pathological correlations. J Exp Clin Cancer Res. 2009;28:65. doi: 10.1186/1756-9966-28-65. [DOI] [PMC free article] [PubMed] [Google Scholar]
- Phillips WA, Russell SE, Ciavarella ML, et al. Mutation analysis of PIK3CA and PIK3CB in esophageal cancer and Barrett's esophagus. Int J Cancer. 2006;118:2644–2646. doi: 10.1002/ijc.21706. [DOI] [PubMed] [Google Scholar]
- Tartare-Deckert S, Sawka-Verhelle D, Murdaca J, et al. Evidence for a differential interaction of SHC and the insulin receptor substrate-1 (IRS-1) with the insulin-like growth factor-I (IGF-I) receptor in the yeast two-hybrid system. J Biol Chem. 1995;270:23456–23460. doi: 10.1074/jbc.270.40.23456. [DOI] [PubMed] [Google Scholar]
- Dey BR, Frick K, Lopaczynski W, et al. Evidence for the direct interaction of the insulin-like growth factor I receptor with IRS-1, Shc, and Grb10. Mol Endocrinol. 1996;10:631–641. doi: 10.1210/mend.10.6.8776723. [DOI] [PubMed] [Google Scholar]
- Mañes S, Mira E, Gómez-Mouton C, et al. Concerted activity of tyrosine phosphatase SHP-2 and focal adhesion kinase in regulation of cell motility. Mol Cell Biol. 1999;19:3125–3135. doi: 10.1128/mcb.19.4.3125. [DOI] [PMC free article] [PubMed] [Google Scholar]
- Levine DS, Blount PL, Rudolph RE, et al. Safety of a systematic endoscopic biopsy protocol in patients with Barrett's esophagus. Am J Gastroenterol. 2000;95:1152–1157. doi: 10.1111/j.1572-0241.2000.02002.x. [DOI] [PubMed] [Google Scholar]
- Domene HM, Bengolea SV, Martínez AS, et al. Deficiency of the circulating insulin-like growth factor system associated with inactivation of the acid-labile subunit gene. N Engl J Med. 2004;350:570–577. doi: 10.1056/NEJMoa013100. [DOI] [PubMed] [Google Scholar]
- Hwa V, Haeusler G, Pratt KL, et al. Total absence of functional acid labile subunit, resulting in severe insulin-like growth factor deficiency and moderate growth failure. J Clin Endocrinol Metab. 2006;91:1826–1831. doi: 10.1210/jc.2005-2842. [DOI] [PubMed] [Google Scholar]
- Doyle SL, Donohoe CL, Finn SP, et al. IGF-1 and its receptor in esophageal cancer: association with adenocarcinoma and visceral obesity. Am J Gastroenterol. 2012;107:196–204. doi: 10.1038/ajg.2011.417. [DOI] [PubMed] [Google Scholar]
- Doepfner KT, Spertini O, Arcaro A. Autocrine insulin-like growth factor-I signaling promotes growth and survival of human acute myeloid leukemia cells via the phosphoinositide 3-kinase/Akt pathway. Leukemia. 2007;21:1921–1930. doi: 10.1038/sj.leu.2404813. [DOI] [PubMed] [Google Scholar]
- Kurek R, Tunn UW, Eckart O, et al. The significance of serum levels of insulin-like growth factor-1 in patients with prostate cancer. BJU Int. 2000;85:125–129. doi: 10.1046/j.1464-410x.2000.00350.x. [DOI] [PubMed] [Google Scholar]
- Neale RE, Doecke JD, Pandeya N, et al. Does type 2 diabetes influence the risk of oesophageal adenocarcinoma. Br J Cancer. 2009;100:795–798. doi: 10.1038/sj.bjc.6604908. [DOI] [PMC free article] [PubMed] [Google Scholar]
- McElholm AR, McKnight AJ, Patterson CC, et al. A population-based study of IGF axis polymorphisms and the esophageal inflammation, metaplasia, adenocarcinoma sequence Gastroenterology 2010139204–212.e3. [DOI] [PubMed] [Google Scholar]