Abstract
Public health emergencies such as H1N1 and SARS pandemics have demonstrated and validated the necessity of a strong and cohesive laboratory response system that is able to respond to threats in an efficient and timely manner. Individual laboratories, through connection with other laboratories or networks, are able to enhance their capacity for preparedness and response to emergencies. Efficient networks often establish standards and maintain best practices within member laboratories. The Global Laboratory Directory Mapping tool (GLaDMap) supports the efforts of laboratory networks to improve their connectivity by providing a simple and efficient tool to profile laboratories by geographic location, function or expertise. The purpose of this paper is to evaluate the effectiveness of the GLaDMap search tool and the completeness of the descriptive content of networks and laboratories that are currently contained within the GLaDMap database. We determined the extent of information volunteered and how the system is being used. Although the system aims to attract an array of users from around the globe, our analysis reveals minimal participation and information sharing and that the low profile participation rate limits the tool’s functionality. The Global Laboratory Directory platform has addressed barriers to participation by adding optional functionality such as restricted access to laboratory profiles to protect private information and by implementing additional functional applications complementary to GLaDMap.
Keywords: laboratory, informatics, web-based, mapping, networks
Background
One essential function of public health laboratories is to identify etiologic agents of disease in an accurate and timely manner. International Health Regulations 2005 [1] were established to facilitate the reporting and dissemination of public health emergencies of global concerns through the World Health Organization (WHO). However, the practicality and potential of these laboratories in the detection and monitoring of threats over a wide geographic range is limited by unclear case definitions, communication barriers, inadequate laboratory capacity, economic and political challenges as well as differing priorities of local authorities in meeting IHR recommendations. Establishing and sustaining global, regional, and local laboratory networks serves to alleviate numerous technical challenges by sharing resources to complement individual laboratories’ capabilities and capacities.
Laboratory networking is the key to establishing and maintaining operational standards, and for advancing technologies for disease detection and confirmation. Networks do this by facilitating member laboratories’ standardization of testing and reporting procedures, and through provision of reagents, equipment, training, reference materials, quality control indicators, and other forms of support [2,3]. Networking or collaboration between and among laboratories over time builds trust and affords rapid and accurate information sharing during an outbreak. Networking enables the sharing of information about the magnitude of outbreaks and the responsible strains that are circulating in particular regions, leading to faster response and more targeted and effective control of the threat, while still respecting inter-jurisdictional policies.
Currently 10% of research funding goes towards challenges faced by 90% of the population [4] and is referred to as the 10/90 Gap. Health security in developing countries is impeded by the poor capacity for locally or nationally available research and by limited access to the relevant research occurring abroad [4,5]. Developing countries also face “digital” and “knowledge” divides due to inadequate access to the same resources and knowledge available to developed countries. Networking and international collaborations could bridge this gap through long-term partnerships between local and global institutions to provide comparable expertise to local institutions and access to up-to-date information.
The Global Laboratory Directory (GLaD) concept was developed in response to the International Health Regulations (IHR) 2005 revision, which called for the strengthening of core capacities and enhanced international collaboration to mitigate the spread of diseases. GLaD is a collaboration among the World Health Organization, the National Microbiology Laboratory (Public Health Agency of Canada), and the Centers for Disease Control and Prevention (USA). GLaD strives to connect laboratory networks and their member laboratories to a global peer network. GLaD acts as a social networking support system for laboratories world wide to facilitate enhanced communication, capabilities, and capacities in order to increase emergency preparedness and response.
The Global Laboratory Directory concept is comprised of three components; GLaDResource, GLaDSupport, and GLaDMap [6]. In this paper, we focus on GLaDMap, developed by the Public Agency of Canada. Its database currently holds laboratory profiles of some of the networks and national reference laboratories.
GLaDMap Overview
The GLaDMap component provides an intuitive, multi-faceted search engine and visual display of the interactive relationships among networks and their member laboratories. GLaDMaP uses a visualization tool that displays information provided by the network and its member laboratories. It enables users to: (1) find laboratories or networks that are dedicated to a specific objective or function, (2) connect with those located in geographical locations of interest, and (3) search for providers of specific type(s) of services and expertise/experts.
GLaDMap consists of three fundamental hierarchical information units: 1) Laboratory, 2) Institution and 3) Network. A laboratory is defined as a place (room, building or facility) set apart for a group of scientists to conduct applied investigations in science (e.g. bacteriology, virology, toxicology, parasitology) or production of reagents for such investigations (animal facility, media preparation) and analysis and interpretation of results (e.g. bioinformatics, biostatistics, mathematical modeling) from undertaking the investigations. A laboratory can be complex and multi-faceted or very simple (e.g, set up for basic sample collection as its sole function). A laboratory is the most basic information unit within the GLaDMap system. Users can define a laboratory’s relationship with their networks and/or institutions.
The second information unit within GLaDMap is an institution, which is defined as an organization established to provide public services. It houses one or more laboratory units that are the official workspaces of scientists and principal investigator(s) where they perform scientific work. An institution is a legal entity that has an official designation that gives them the mandate or authority to house the laboratory units. Any number of laboratory units may or may not be co-located within the same institution.
The third information unit within the GLaDMap system is a network, which is defined as an interconnected entity (usually championed by a “leader” or “manager”) and linked by common interest (a community of practice). Members develop a working relationship for professional benefit and visibility. Networks are often established to achieve common goals that are accomplished more easily together than by one or two entities on their own. Networks may have formal or informal organizational and administrative structures and may also collaborate together to form networking alliances through formal or informal agreements. For example, the Canadian Public Health Laboratory Network (CPHLN) and the Association for Public Health Laboratories (APHL) in the United States share a memorandum of understanding.
Methodology
To determine the status of network-related information available on GLaDMap, each network’s public website was accessed in order to locate a listing of member laboratories [8–20]. The public listing was then compared to the laboratories listed in GLaDMap to determine if information gaps existed. In a number of cases, the website provided a total number of laboratories but did not list them individually. In these cases, if the number of laboratories on the website exceeded the number in GLaDMap, it was concluded that gaps existed; and if there were fewer laboratories publicly listed than available on GLaDMap, it was deemed inconclusive since there was no way to compare the individual laboratories. All network websites were accessed between May 23, 2011 and May 31, 2011.
The remainder of the analysis was completed using data collected on June 7, 2011. This included data regarding profile completion of each laboratory, search function data for each laboratory, search keywords and the originating IP address of each search.
Laboratory profile completion was analyzed to determine how many of the laboratories listed in GLaD had completed their profiles. This was done by organizing laboratory profiles by network and defining all the profiles that had more than half of the optional fields filled in as being considered completed. To determine the correlation between profile completion and profile search function access, data regarding the number of times each laboratory appeared in the search results (“found”) and the number of times each profile was accessed from the search results (“clicked”) was used. The profile completion rates were determined for the most commonly “found” and “clicked” profiles and were compared to the overall “found” and “clicked” rates in order to determine if any relationship existed.
The GLaDMap search function allows a user to perform searches by network, country, WHO region, laboratory name, contact name, affiliated institution, or test. To determine the most commonly used search field, the search keywords from all queries run between October 2009 and April 2011 were sorted into each of the previous categories. If the context of the search keyword was ambiguous, it was categorized as “other”. The number of searches for each category was summed to determine the most commonly used search fields.
It was also important to determine the origin of the search terms in order to understand who is using the system. To determine the geographic location of GLaDMap users, IP address information for each search query was used. The location of the IP address associated with each individual search term was identified using the website IP-Lookup.net, and the number of searches per country was organized by WHO region.
To determine whether different geographic regions used GLaDMap differently, search keywords from each WHO region were again categorized by field (network, country, WHO region, laboratory name, contact name, affiliated institution, or test) and the number of searches by each field was summed for each WHO Region. The African and Eastern Mediterranean regions were omitted from the results due to insufficient data.
Results and Discussion
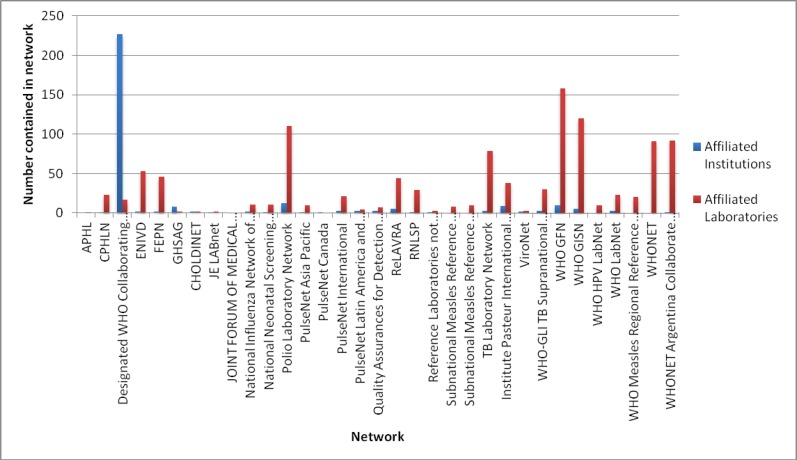
GLaDMap, at the time of analysis, contained 33 networks and 1,075 laboratories. The networks varied greatly in size, with each network containing between 0 and 200 member laboratories and affiliated institutions (Figure 1) entered into the current database. The networks with 0 members are the result of networks that registered, but did not provide a membership list.
Figure 1:
Affiliated Laboratories and Institutions per Network
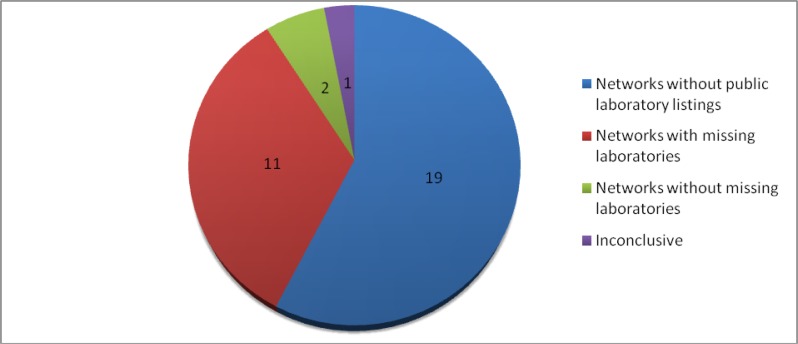
When comparing the laboratory listings available in GLaDMap to the publicly available laboratory listings for each network, significant gaps were identified. Of the 33 networks in GLaDMap, public laboratory listings or information about the total number of member laboratories were available for 14 networks. Of these 14 networks, 11 contained laboratories not listed in GLaDMap, 2 contained no missing listings, and 1 was inconclusive (Figure 2).
Figure 2:
Laboratory Gaps in GLaDMap Networks
Laboratory profile completion is an extremely important aspect of GLaDMap since it increases the number of search terms that will include the laboratory in the search results. One of the most useful functions of GLaDMap is the ability for users to efficiently locate laboratories based on a specific function, but this ability hinges on the completeness of their profiles. Overall, the completion rate of all the laboratories in GLaDMap was 9.8%.
Furthermore, only 10% of all laboratory profiles have ever been accessed through the search results. Within these 10%, the profile completion rate is 39.7% indicating that completed profiles are more likely to be found and accessed using the search function.
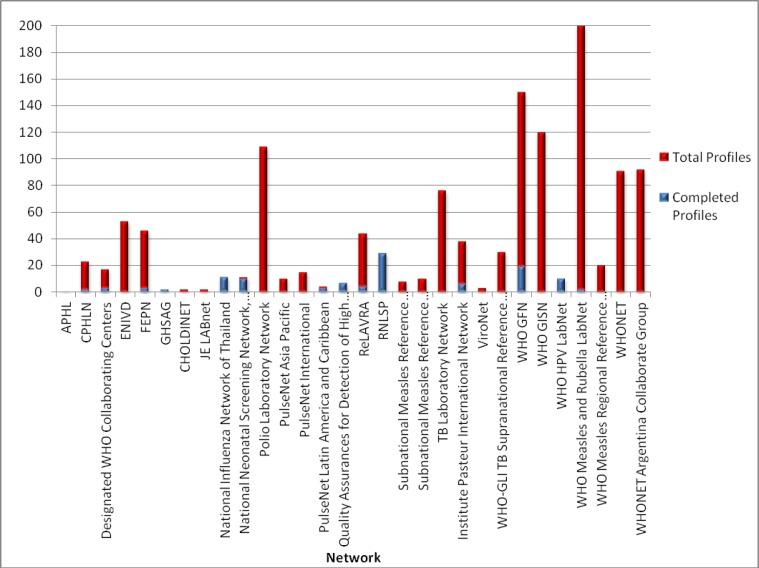
Figure 3 shows laboratory profile submission rates by network. This figure shows that of the 33 networks, only 5 are 100% complete, and 3 more are at least 50% complete. The majority of network profiles are incomplete, and therefore are not searchable by function.
Figure 3:
Laboratory Profiles by Network- Complete and Total
Notably, Thailand has two regional networks listed in GLaDMap with complete or nearly complete laboratory profiles. Similarly, the largest network with a complete set of profiles is Red Nacional de Laboratorios de Salud Pública (RNLSP), a network of 29 local public health laboratories in Mexico. National public health networks may have higher profile completion rates because they are smaller in size with a more central governance structure compared to some of the larger international networks. The 10-member WHO Human Papilloma Virus (HPV) Network profile is also complete.
Search function usage statistics were analyzed to gather demographic information about who is using the system and how they are using it. Search function data including keywords and IP addresses were analyzed to determine the origin of GLaDMap searches and users’ preferred fields and search terms.
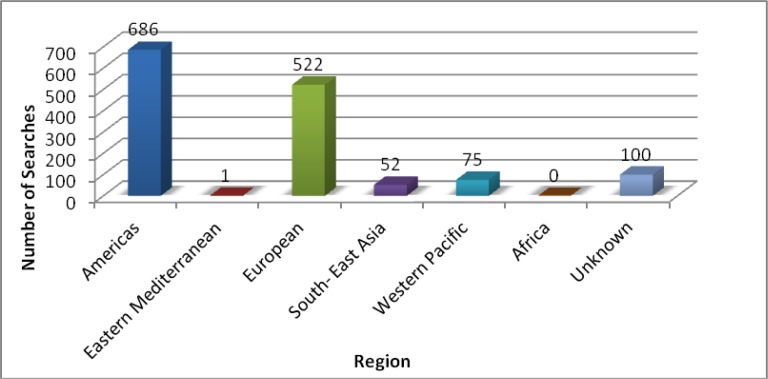
There have been 1463 searches originating from 42 countries. The top 3 countries using GLaDMap are Switzerland, Canada and the United States. It is apparent that the European and American WHO Regions are by far the greatest users of the system, mostly due to the heavy use from Canada, Switzerland and the United States (Figure 4).
Figure 4:
GLaDMap Searches by WHO Region
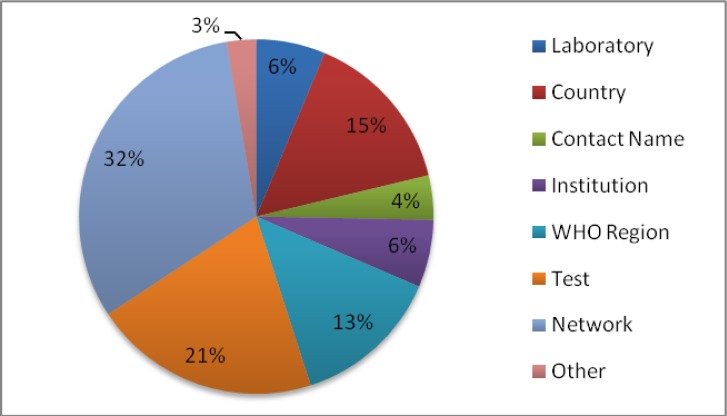
Analysis of search field usage was also conducted in order to determine how the search function was being employed (Figure 5). Using 2565 search terms it was determined that the most common search was by network name, followed by test type, country, WHO region, laboratory name, and institution. The large number of test type searches is significant, because, as mentioned previously, only those labs with completed profiles will appear in the search results for this field.
Figure 5:
Global Search Field Usage (n=2565)
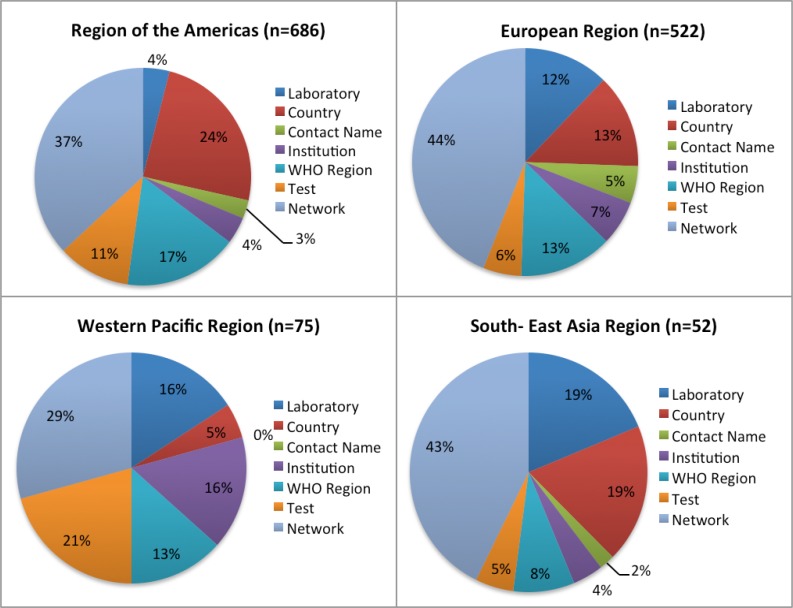
Search field usage was also examined for each WHO region (Figure 6). For all the regions, network was the most commonly used search term. Use of the other fields varied across the regions. Sample sizes for the South- East Asian and Western Pacific Regions were significantly smaller than the American and European regions, thus results from these regions may be less accurate.
Figure 6:
Search Field Usage by WHO Region
Limitations
One of the limitations currently facing GLaDMap is the large number of incomplete profiles. The ability to search for labs by the test that they perform is a key function expected of the system. For GLaDMap to be a useful tool for networking and surveillance a greater degree of participation is required from the individual laboratories; they will need to take the time to fill out their profiles. Low profile completion rate may be due to many factors, such as: (i) different laboratories have varying level of comfort in offering information to a new social network; (ii) some fields are not applicable to them; (iii) members need further clarification of utility of information; (iv) it takes time to buy in, but they expect to volunteer more in the future; (v) potential duplication of data entry; (vi) institutions may have policies on posting information on a public site, so individual laboratory units may have difficulty in completing profiles.
Until the recent past, there were no security settings to protect profile information within the application. GLaDMap now includes a feature that allows profiles to be either publicly available or made secure. Some laboratories had expressed privacy concerns; securing the profiles may foster an increase in the completed profiles.
Another limitation is incomplete networks within the system. That is, networks with missing laboratories. Reasons for these may include: (i) some networks are complex and large so it will take time for a network manager to contact members who may have different priorities; (ii) uncertainty by individual laboratories on the objectives and intent of the GLaDMAP project; (iii) individual laboratories require approval from authorities; (iv) language barriers; and (v) unclear of ownership of the web database and its long term support.
Furthermore, more than half of the national public health laboratories in the world are not associated with networks. In order to achieve this, a catergory “does not belong to network” was created under networks for a quick search. It is important to capture them into the application so that they become visible and to have an opportunity to be invited for collaboration or networking.
Conclusion
The Global Laboratory Directory provides a platform for laboratory networks to unite experts and exchange knowledge in order to collectively work towards global health security. Providing support for laboratory networks plays an important and direct role in the eradication of disease, as increased regional or global collaboration facilitates faster response and more effective control of global health threats.
From the search usage statistics, it is apparent that the system is primarily being used by Switzerland, Canada, and the US, countries that are home to GLaD’s partners at the WHO, PHAC, and CDC, respectively, indicating that the creators of the system are the ones who are using it the most. GLaDMap would be of particular use to laboratories situated in middle to low-income countries, where it can be used to interact with laboratories around the globe in order to build capacity and strengthen response.
Additional support tools that provide users with the capability to share resources and interact with other users around the globe could be useful. We hope that the opportunity to partake in the global scientific community will attract users to contribute and participate in the Global Laboratory Directory.
Acknowledgments
The authors like to thank all who have participated in the pilots and provided information for the profiles on GLaDMap application.
References
- 1.Baker MG, Fidler DP. Global public health surveillance under new international health regulations. Emerging Infectious Diseases. 2006;12:1058–65. doi: 10.3201/eid1207.051497. [DOI] [PMC free article] [PubMed] [Google Scholar]
- 2.Hull BP, Dowdle WR. Poliovirus surveillance: building the poliovirus laboratory network. J Infect Dis. 1997;175(Suppl):S113–6. doi: 10.1093/infdis/175.supplement_1.s113. [DOI] [PubMed] [Google Scholar]
- 3.Featherstone D, Brown D, Sanders R. Development of the global measles laboratory network. J Infect Dis. 2003;187(Suppl 1):S264–9. doi: 10.1086/368054. [DOI] [PubMed] [Google Scholar]
- 4.Al-Tuwaijri S, Currat Louis J, Davey S, de Francisco A, Ghaffar A, Jupp S, Mauroux C. The 10/90 Report for Health Research 2003–2004. Switzerland: Global Forum for Health Research; 2004. [Google Scholar]
- 5.Harris E. Building scientific capacity in developing countries. EMBO Reports. 2004;5:7–11. doi: 10.1038/sj.embor.7400058. [DOI] [PMC free article] [PubMed] [Google Scholar]
- 6.Mukhi SN, Ng LK, Kuschak TI, Chu M. Knowledge Integration to Support Networking for Laboratory Preparedness and Response to Emerging Pathogens, New Research on Knowledge Management Technology. In: Hou Huei-Tse., editor. InTech; Available from: http://www.intechopen.com/articles/show/title/knowledge-integration-to-support-networking-for-laboratory-preparedness-and-response-to-emerging-pat. [Google Scholar]
- 7.Wertheim HFL, Puthavathana P, Nghiem NM, van Doorn HR, Nguyen TV, et al. Laboratory Capacity Building in Asia for Infectious Disease Research: Experiences from the South East Asia Infectious Disease Clinical Research Network (SEAICRN) PLoS Medicine. 2010;7 doi: 10.1371/journal.pmed.1000231. [DOI] [PMC free article] [PubMed] [Google Scholar]
- 8.Association of Public Health Laboratories APHL Member Laboratory Listing [Online] 2010. Available: http://www.aphl.org/AboutAPHL/memberlabs/Pages/default.aspx.
- 9.Canadian Public Health Laboratory Network CPHLN Member Organizations Listing [Online] 2010. Available: http://www.cphln.ca/organizations_eng.html.
- 10.World Health Organization Regional Office for the Western Pacific Japanese Encephalitis Laboratory Network [Online] 2011. Available: http://www.wpro.who.int/health_topics/laboratory/JELab.htm.
- 11.Thai National Influenza Center Thai NIC, DMSc Laboratory Listing [Online] 2011. Available: http://www.thainihnic.org/LabNetwork.asp.
- 12.The Global Polio Eradication Initiative The Global Polio Laboratory Network. 2010. [Online]. Available: http://www.polioeradication.org/Dataandmonitoring/Surveillance/GlobalPolioLaboratoryNetwork.aspx.
- 13.PulseNet International PulseNet Asia Pacific [Online] 2010. Available: http://www.pulsenetinternational.org/networks/Pages/asiapacific.aspx.
- 14.PulseNet International PulseNet Canada [Online] 2010. Available: http://www.pulsenetinternational.org/networks/Pages/canada.aspx.
- 15.PulseNet International PulseNet Latin America and Caribbean [Online] 2010. Available: http://www.pulsenetinternational.org/networks/Pages/latinamerica.aspx.
- 16.PulseNet Association of Public Health Laboratories APHL Member Laboratory Listing [Online] 2010. Available: http://www.aphl.org/AboutAPHL/memberlabs/Pages/default.aspx.
- 17.Pasteur International The Institut Pasteur International Network [Online] 2010. Available: http://www.pasteur-international.org/ip/easysite/pasteur-international-en/institut-pasteur-international-network/the-network.
- 18.World Health Organization National Influenza Centers [Online] 2011. Available: http://www.who.int/csr/disease/influenza/centres/en/index.html.
- 19.WHONet WHONet Community [Online] 2011. Available: http://www.whonet.org/dnn/WHONETCommunity/tabid/63/language/en-US/Default.aspx.
- 20.WHONet Argentina [Online] 2011. Available: http://www.whonet.org/dnn/WHONETCommunity/Argentina/tabid/62/language/en-US/Default.aspx.


