Abstract
Background
It seemed that visual functions might have some effects on the performance of baseball players. We measured static, kinetic, and dynamic visual acuity (SVA, KVA, and DVA, respectively) of Japanese professional baseball players to ascertain whether there would be any difference in SVA, KVA, and DVA among player groups stratified according to their performance level.
Methods
The subjects were 102 male professional baseball players with a mean age of 26 years who were members of a Japanese professional baseball club from 2000 to 2009. They were stratified into three groups according to their performance level: A (players who were on the roster of the top-level team all the time throughout the study period), B (players who were on the roster of the top-level team sometimes but not all the time), and C (players who were never on the roster of the top-level team). They were interviewed for the use of corrective visual aids, and examined for SVA, KVA, and DVA. The measurements of these parameters were compared among groups A, B, and C. We also investigated and analyzed the association of KVA or DVA with player position (pitchers or fielders) and with hand dominance for batting. KVA was compared between the pitchers and the fielders because they each require different playing skills. DVA was compared between the right-handed and the left-handed batters.
Results
There was no statistically significant difference among groups A, B, and C. There was a statistically significant difference in KVA between the pitchers and the fielders (t-test; P < 0.05) There was no statistically significant difference in DVA between the right-handed and the left-handed batters.
Conclusions
There was no significant difference in the examined visual functions among player groups with different performance levels.
Keywords: static visual acuity, kinetic visual acuity, dynamic visual acuity, Japanese professional baseball players
Introduction
Baseball is a popular sport that involves various player-dependent factors, including player positions, batter’s box preference (right or left), and hand predominance. This suggests that baseball players are suitable subjects for studying the effects of visual function on playing performance.
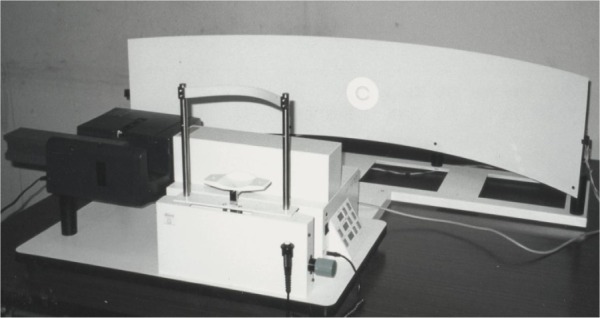
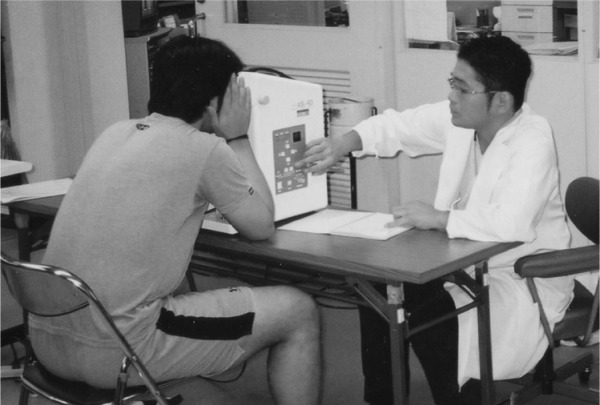
Two methods are available to measure the ability to visually discern a moving object. One is dynamic visual acuity (DVA, Figure 1) measurement, in which the subject discerns a horizontally moving object.1,2 This method has been used in Western countries as well as Japan. The other is kinetic visual acuity (KVA, Figure 2) measurement, using an object moving from a distant point towards the subject.3 This parameter was originally developed and used in Japan. These two parameters seem to be appropriate for evaluating the visual functions of baseball players who continue to pursue a moving ball during play. The details will be described in the Methods section. Visual acuity in the general meaning will be expressed as static visual acuity (SVA) to distinguish it from KVA and DVA.
Figure 1.

Dynamic visual acuity (KOWA Co. Ltd., HI-10).
Note: The largest number of revolutions per minute (rpm) at which the subject can correctly identify the target (the gap in the Landolt ring) moving from left to right or from right to left on a screen situated at a fixed distance in front of the subject.
Figure 2.

Kinetic visual acuity (KOWA Co. Ltd., AS-4).
Note: Decimal visual acuity converted from the measured size of the Landolt ring correctly seen by the subject as it lineally approaches the subject from a distance at a speed of 30 km/hr.K. Hoshina, one of the authors (corresponding author), is measuring KVA of a player.
Abbreviation: KVA, kinetic visual acuity.
Winograd4 reported that college baseball players were superior in both visual efficiency and stereopsis to the general public, including students not belonging to baseball teams. Rouse et al5 also showed that college baseball players had better DVA than nonathletic college students. In the latter half of the 1980s, ophthalmological studies in professional baseball players began to appear. In a study conducted in 1988 among American major league baseball players, the authors found that dynamic depth perception (stereoacuity) of the fielders was better than that of the pitchers.6 In 1996, Laby et al7 studied professional baseball players for 4 years who belonged to the Los Angeles Dodgers. They reported that visual acuity, contrast sensitivity, and distance stereoacuity were better in professional baseball players than in the general public. Moreover, there were some differences between the major and the minor league players.
Uchida et al reported that Japanese college baseball players were superior in DVA to the general public when they were allowed to move their eyes (free-eye-movement conditions) but not when they were required to fixate on a fixation target (fixation conditions).8 In their unique studies, Maeda and Tsuruhara9,10 continuously trained Japanese nonprofessional baseball players to watch a ball moving at ultrahigh speed, and reported that there were improvements in their batting results and kinetic visual acuity.
Prior to beginning the present study, we formulated the following hypothesis: the higher the performance level is, the better SVA, KVA, and DVA the player would have.11,12 In addition, taking the nature of baseball into consideration, we also investigated and analyzed the association of KVA or DVA with player position (pitchers or fielders) and with hand dominance for batting.
We designed and carried out the present study to determine the visual functions of Japanese professional baseball players by measuring SVA, KVA, and DVA for 10 years.
Subjects and methods
Subjects
A total of 102 male professional baseball players with a mean age of 26 (range 19–40) years were enlisted. They were members of a Japanese professional baseball club from 2000 to 2009. Of these, 49 were pitchers and 53 fielders, and 65 were right-handed batters and 37 were left-handed. They were stratified into three groups according to their performance level: A (players who were on the roster of the top-level team all the time throughout the study period), B (players who were on the roster of the toplevel team sometimes but not all the time), and C (players who were never on the roster of the top-level team) (Table 1).
Table 1.
Stratification of players according to their performance level (Groups A, B, and C)
| No. of Players | Mean age | Age distribution | Pitchers | Fielders | Players without corrective visual aids | CL wearers | |
|---|---|---|---|---|---|---|---|
| group A | 28 | 29 | 19–40 | 15 | 13 | 16 | 12 |
| Group B | 34 | 26 | 19–37 | 15 | 19 | 27 | 7 |
| group C | 40 | 23 | 19–38 | 19 | 21 | 30 | 10 |
| Total | 102 | 26 | 19–40 | 49 | 53 | 73 | 29 |
Notes: Group A, players who had been on the roster of the top-level team all the time; group B, players who had been on the roster of the top-level team sometimes but not all the time; group C, players who had never been on the roster of the top-level team.
Abbreviation: CL, contact lens.
Methods
The subjects were interviewed for their use of corrective visual aids during practice and games. Their SVA and KVA were measured using a kinetic visual acuity meter AS-4 (Kowa, Tokyo, Japan. Figure 2). For measuring DVA, a dynamic vision analyzer HI-10 (Kowa, Figure 1) was used.
Measurements were carried out in the order of AS-4 then HI-10, each of which was measured by one and the same examiner. SVA was measured binocularly. KVA and DVA were measured repeatedly until each subject correctly responded three times. The mean value of the three measurements of each parameter was calculated.
KVA was measured by using AS-4 as follows. The subjects were instructed to look through the measuring window. They would detect the Landolt ring in a bright white circular shape. The Landolt ring moved towards the subjects from a 50 m distance at a rate of 30 km/hour. The subjects were asked to immediately respond by pressing a switch when they identified the direction of the ring gap. The smaller the ring size was on identification, the better the KVA was. The results were expressed as decimal visual acuity.
When DVA was measured using HI-10, the subjects were instructed to place their chins on the chin rest and follow the Landolt ring moving from left to right, or from right to left, on the screen 0.8 m distant from the subjects, without moving their heads. They were asked to respond immediately by pressing a switch when they identified the direction of the ring gap. The results were expressed as the fastest-moving velocity of the Landolt ring or fastest revolution velocity (rpm) of the mirror projecting the ring on the screen at which the subjects could identify the ring gap. The size of the Landolt ring corresponded to logarithmic visual acuity 1.
This study was approved by the institutional review board of the Hoshina Eye Clinic and adhered to the tenets of the Declaration of Helsinki.
Analyses
The data were analyzed in terms of the following three items: (1) distribution of SVA and appropriateness of contact lens (CL) correction; (2) comparison of SVA, KVA, and DVA among the three player groups of different performance levels (groups A, B, and C) using analysis of variance (ANOVA); and (3) comparison of KVA between pitchers and fielders and comparison of DVA between right-handed and left-handed batters using t-tests.
Statistical analyses
The data was entered in Microsoft (Albuquerque, NM, USA) Excel 2010 and analyzed using SPSS 17 (IBM, Armonk, NY, USA). The t-test, ÷2-test, and ANOVA were used to compare the results. P-values of less than 0.05 were considered significant.
Results
Of the subjects, 72 (71.6%) were players who used no corrective visual aids, and 30 (28.4%) were CL wearers. None of the players had received refractive surgery.
Analysis 1
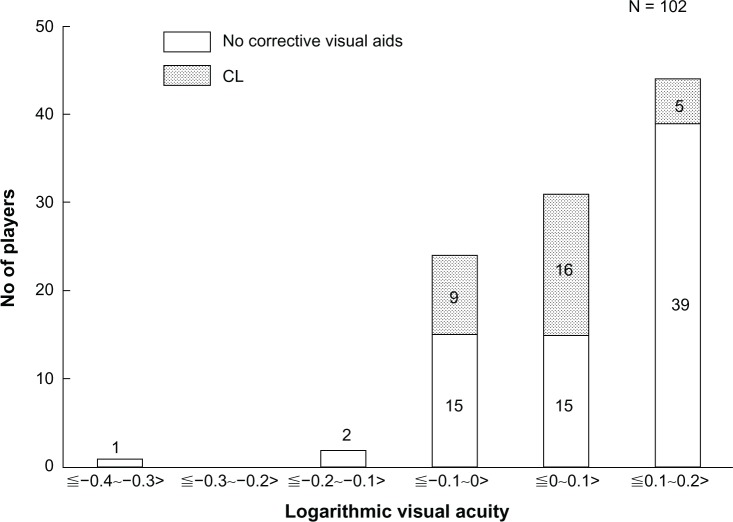
A total of 99 subjects (97%) had an SVA of −0.1 or better. A large number of those having relatively good SVA (0 or better) were correcting their visual acuity by wearing CLs, but none of the three persons whose SVAs were low (less than −0.1) used corrective visual aids (Figure 3).
Figure 3.
Dstribution of Eva and appropriateness of CL correction.
Notes: CL correction seemed to be generally appropriate.
Abbreviations: SVA, static visual acuity;CL, contact lens.
Analysis 2
SVA of group A tended to be higher than that of group C, without statistical significance. KVA and DVA were comparable among the three groups. As a result, no statistically significant difference was found in any of these three parameters among groups A, B, and C (ANOVA) (Table 2).
Table 2.
Comparison of Eva, KVA, and DVA among player groups at different performance levels
| All | Group A | Group B | Group C | |||||
|---|---|---|---|---|---|---|---|---|
| Comparison of SVA (logarithmic visual acuity) | ||||||||
| n | 102 | 28 | 34 | 40 | ||||
| Mean | 0.089 | 0.106 | 0.097 | 0.064 | ||||
| SD | 0.009 | 0.013 | 0.018 | 0.015 | ||||
|
| ||||||||
| Comparison of KVA (logarithmic visual acuity) | ||||||||
| n | 102 | 28 | 34 | 40 | ||||
| Mean | −0.053 | 0.066 | −0.041 | −0.054 | ||||
| SD | 0.019 | 0.034 | 0.038 | 0.029 | ||||
|
| ||||||||
| Comparison of DVA (grades per second) | ||||||||
| Direction | Left → right | Right → left | Left → right | Right → left | Left → right | Right → left | Left → right | Right → left |
| n | 102 | 102 | 28 | 28 | 34 | 34 | 40 | 40 |
| Mean | 268.2 | 267.6 | 268.8 | 268.8 | 268.2 | 264.6 | 267.6 | 268.8 |
| SD | 0.316 | 0.35 | 0.595 | 0.321 | 0.441 | 0.689 | 0.591 | 0.573 |
Note: There was no statistically significant difference among groups A, B and C
Abbreviations: SVA, static visual acuity; KVA, kinetic visual acuity; DVA, dynamic visual acuity; SD, standard deviation.
Analysis 3
Mean KVA was higher in the fielders (−0.080) than in the pitchers (−0.158). This difference was statistically significant (t-test; P < 0.05). DVA of the right-handed and the left-handed batters was comparable and not significantly different whether the target moved from left to right or from right to left (Table 3).
Table 3.
Comparison of KVA between pitchers and fielders (logarithmic visual acuity)
Notes: *Statistically significant difference between the pitchers and the fielders; t-test (P < 0.05).
Abbreviations: KVA, kinetic visual acuity; SD, standard deviation.
DVA of our subjects ranged from 216° to 300°/second with the target moving from left to right, and 168° to 300°/second with the target moving from right to left. (Table 2)
Discussion
SVA showed no statistically significant difference among the performance level-stratified groups A, B, and C. KVA showed a statistically significant difference between the pitchers and the fielders. Compared to pitchers, fielders need to watch things more keenly during fielding and batting. This seemed to be the reason the fielders had better KVA than the pitchers. Interestingly, Solomon et al6 also reported that fielders had better stereoacuity than pitchers. The mean KVA values obtained in the present study were comparable to those reported previously.13 Regrettably, KVA data have not yet been accumulated sufficiently. It would be helpful to collect and accumulate KVA data of not only professional baseball players but also of male adolescents and adults in general to comparatively study their KVA.
DVA has been considered to reflect effective eye movements,14,15 but this measuring system tended to produce some varied results. DVA of our subjects ranged from 216° to 300°/ second with the target moving from left to right, and 168° to 300°/second with the target moving from right to left. While measuring DVA, we had an impression that players whose DVA was less than 240°/second could not synchronize their eye movements to target movements well. The DVA measurements seemed to become stable after the subject learned the “trick” of pursuing the target. When we pictured a batter facing a pitcher, we expected that right-handed batters would show better DVA results in the left-to-right direction, and left-handed batters in the right-to-left direction. However, the results were not significantly different between the right-handed and left-handed batters.
The presence of “practice effects” is suspected in the KVA and DVA measurements.16 In future, KVA and DVA should be measured after a unified amount of learning practice. Moreover, these parameters may not sufficiently reflect the visual function of baseball players in play. It would be ideal if KVA and DVA could be evaluated in a way that matched the characteristic aspects of the sport. In the present study, we did not detect significant differences in KVA or DVA among the player groups of different performance levels, though such differences were previously reported.11,12 Visual advantages specific to high-performance players, if any, may be associated with the expert perception17 derived from brain plasticity.18 Assessment of this aspect would also be needed for studying visual functions of professional baseball players.
Footnotes
Disclosure
The authors report no conflicts of interest in this work.
References
- 1.Ludvigh E. The visibility of moving objects. Science. 1948;108:63–64. doi: 10.1126/science.108.2794.63. [DOI] [PubMed] [Google Scholar]
- 2.Miller JW, Ludvigh E. The effect of relative motion on visual acuity. Surv Ophthal. 1962;7:83–116. [PubMed] [Google Scholar]
- 3.Suzumura A. [Studies on dynamic visual acuity.] Nihon Ganka Gakkai Zasshi. 1961;65:1736–1750. [Japanese.] [Google Scholar]
- 4.Winograd S. The relationship of timing and vision to baseball performance. Res Q. 1942;13:481–493. [Google Scholar]
- 5.Rouse MW, Deland P, Christian R, Hawley J. A comparison study of dynamic visual acuity between athletes and nonathletes. J Am Optom Assoc. 1988;59:946–950. [PubMed] [Google Scholar]
- 6.Solomon H, Zinn WJ, Vacroux A. Dynamic stereoacuity: a test for hitting a baseball? J Am Optom Assoc. 1988;59:522–526. [PubMed] [Google Scholar]
- 7.Laby DM, Rosenbaum AL, Kirschen DG, et al. The visual function of professional baseball players. Am J Ophthalmol. 1996;122:476–485. doi: 10.1016/s0002-9394(14)72106-3. [DOI] [PubMed] [Google Scholar]
- 8.Uchida U, Kudoh D, Murakami A, Honda M, Kitazawa S. Origins of superior dynamic visual acuity in baseball players: superior eye movements or superior image processing. PloS One. 2012;7:e31530. doi: 10.1371/journal.pone.0031530. [DOI] [PMC free article] [PubMed] [Google Scholar]
- 9.Maeda A, Tsuruhara T. [Effect of batting practice by using high-speed pitched balls on kinetic visual acuity of baseball players.] Train Sci. 1998;10:35–40. [Japanese.] [Google Scholar]
- 10.Maeda A, Tsuruhara T. [Effect of batting practice by using high-speed pitched balls during 1 year on kinetic visual acuity and batting performance in elite amateur baseball players.] Train Sci. 1999;10:173–178. [Japanese.] [Google Scholar]
- 11.Stine CD, Arterburn MR, Stern NS. Vision and sports: a review of the literature. J Am Optom Assoc. 1982;53:627–633. [PubMed] [Google Scholar]
- 12.Morris GS, Kreighbaum E. Dynamic visual acuity of varsity women volleyball and basketball players. Res Q. 1977;48:480–483. [PubMed] [Google Scholar]
- 13.Suzumura A. The trial production of a kinetic vision tester (TYPE AS-4A) and its application. Annu Rep Res Inst Environ Med Nagoya Univ. 1968;16:77–89. [PubMed] [Google Scholar]
- 14.Barmack NH. Dynamic visual acuity as an index of eye movement control. Vision Res. 1970;10:1377–1391. doi: 10.1016/0042-6989(70)90089-1. [DOI] [PubMed] [Google Scholar]
- 15.Brown B. Dynamic visual acuity, eye movements and peripheral acuity for moving targets. Vision Res. 1972;12:305–321. doi: 10.1016/0042-6989(72)90120-4. [DOI] [PubMed] [Google Scholar]
- 16.Wood JM, Abernethy B. An assessment of the efficacy of sports vision training programs. Optom Vis Sci. 1997;74:646–659. doi: 10.1097/00006324-199708000-00026. [DOI] [PubMed] [Google Scholar]
- 17.Abernethy B. Expertise, visual search, and information pick-up in squash. Perception. 1990;19:63–67. doi: 10.1068/p190063. [DOI] [PubMed] [Google Scholar]
- 18.Sekiyama K, Miyauchi S, Imaruoka T, Egusa H, Tashiro T. Body image as a visuomotor transformation device revealed in adaptation to reversed vision. Nature. 2000;407:374–377. doi: 10.1038/35030096. [DOI] [PubMed] [Google Scholar]


