

Abstract
Time-of-flight (TOF) and point spread function (PSF) modeling have been shown to improve PET reconstructions, but the impact on physicians in the clinical setting has not been thoroughly investigated. A lesion detection and localization study was performed using simulated lesions in real patient images. Four reconstruction schemes were considered: ordinary Poisson OSEM (OP) alone and combined with TOF, PSF, and TOF+PSF. The images were presented to physicians experienced in reading PET images, and the performance of each was quantified using localization receiver operating characteristic (LROC). Numerical observers (non-prewhitening and Hotelling) were used to identify optimal reconstruction parameters, and observer SNR was compared to the performance of the physicians. The numerical models showed good agreement with human performance, and best performance was achieved by both when using TOF+PSF. These findings suggest a large potential benefit of TOF+PSF for oncology PET studies, especially in the detection of small, low-intensity, focal disease in larger patients.
1. Introduction
The idea to use time-of-flight (TOF) information from coincident photon detections to improve PET image quality has been explored before (Tomitani and Tanaka 1980; Budinger 1983), and it has recently been revived due to advances in PET scanner technology (Conti, Bendriem et al. 2005). Additionally, the spatially-variant point spread response (PSF) of a PET system can be incorporated into the system model (Panin, Kehren et al. 2006; Tong, Alessio et al. 2009; Daube-Witherspoon, Matej et al. 2011; Walker, Asselin et al. 2011).
The clinical benefit of TOF and PSF in PET reconstructions is of major interest. In oncology, lesion detectability is important in the early diagnosis and staging of patients. Positive patient prognoses are strongly dependent on early detection, so the ability to detect small, low-intensity lesions is critically important.
Incorporation of these reconstruction models has great potential to improve image quality in oncological studies (Kadrmas, Casey et al. 2009; Armstrong, Williams et al. 2011). Recent work has reported improvement from TOF due to the faster iterative convergence (Karp, Surti et al. 2008; Lois, Jakoby et al. 2010), and from PSF due to more uniform spatial resolution which enhances small foci of uptake, especially at large radial distances (Casey 2007; Tong, Alessio et al. 2010). Little work has been done, however, to objectively assess the impact of these benefits for lesion detection in clinical whole-body 18F-FDG oncological studies (Surti, Scheuermann et al. 2011). This is partly because of the complications in translating realistic tasks into the experimental setting and the difficulty in performing a study on sufficient patient numbers to ensure statistical power (El Fakhri, Surti et al. 2011).
This work aims to assess the added utility of both TOF and PSF reconstructions in the detection of lesions of varying contrast placed at different anatomical locations. The hypothesis is that the enhancement of the visibility of small foci when employing the combination of both models is superior to that when using either independently or neither (Kadrmas, Casey et al. 2009), and that these effects are amplified for weaker signals and in larger patients (Surti and Karp 2009).
A rigorous evaluation methodology was developed to quantify the benefit of these new reconstruction models in a real lesion detection task using both human and mathematical observers. Three physicians (2 board-certified nuclear medicine physicians and 1 radiologist certified in nuclear medicine) were recruited for the study. The use of actual patient data accounted for the wide range of realistic subject volumes and physiological variability that exist in the clinical setting; the addition of known signals provided a gold standard for the detection task.
Additionally, the performances of eight mathematical observer models will be evaluated in a localization task and compared to those of the physicians. Nonprewhitening and Hotelling (with internal noise) schemes are used, each with 4 channel configurations.
2. Materials and Methods
2.1. Patient Population
Ninety-six patients underwent routine clinical PET/CT scans at the University of Tennessee Medical Center after 90-min uptake of 370 MBq of 18F-FDG according to standard clinical protocol (Lois, Jakoby et al. 2010). Of these patients, 40 were selected for analyses by the numerical observers, including the population of 33 disease-free bed positions from 23 patients (BMI 20.2–46.7, mean 30.9, std. dev. 6.34), used for the human observer study.
2.2. PET Acquisition
All patients were scanned on a Biograph PET/CT, a TOF-capable, fully 3D PET scanner together with a 6-slice Sensation spiral CT (Siemens Molecular Imaging). The PET system comprised 4 rings of lutetium oxyorthosilicate (LSO) crystal detectors. The 60 cm transverse field-of-view (FOV) was defined by a coincident acceptance window of 4.1 ns, with an energy threshold of 435–650 keV. The acceptance window was divided into 312 ps timing bins for the TOF measurements. The energy and timing resolution were measured with an 18F line source resulting in 11.7% (FWHM) and <550 ps (FWHM), respectively. The average spatial resolution (FWHM), measured at 1 cm and 10 cm from the center of the transverse field-of-view, was 4.4 mm and 5.2 mm transaxially, and 4.4 mm and 5.8 mm axially. (Jakoby, Bercier et al. 2008)
Patients underwent a whole-body (WB) PET/CT consisting of 4 to 7 bed positions, each scanned for 2 to 4 min, and PET data were acquired in listmode and reconstructed. The volumes were reviewed, and locations of possible lesion sites were recorded. Forty locations were chosen including different anatomical regions of interest (e.g., lungs, soft tissues, bones). This process intended to simulate focal uptake consistent with pathology, such as solitary nodules or small metastatic deposits.
To model the artificial lesions, a 1-cm inner-diameter 18F-filled sphere was separately scanned in air at each of the 40 predetermined locations. This was accomplished by mounting the sphere on a grid, shown in Figure 1, with over 600 threaded holes and adjusting the horizontal bed position to match the z-coordinate of the location.
Figure 1.
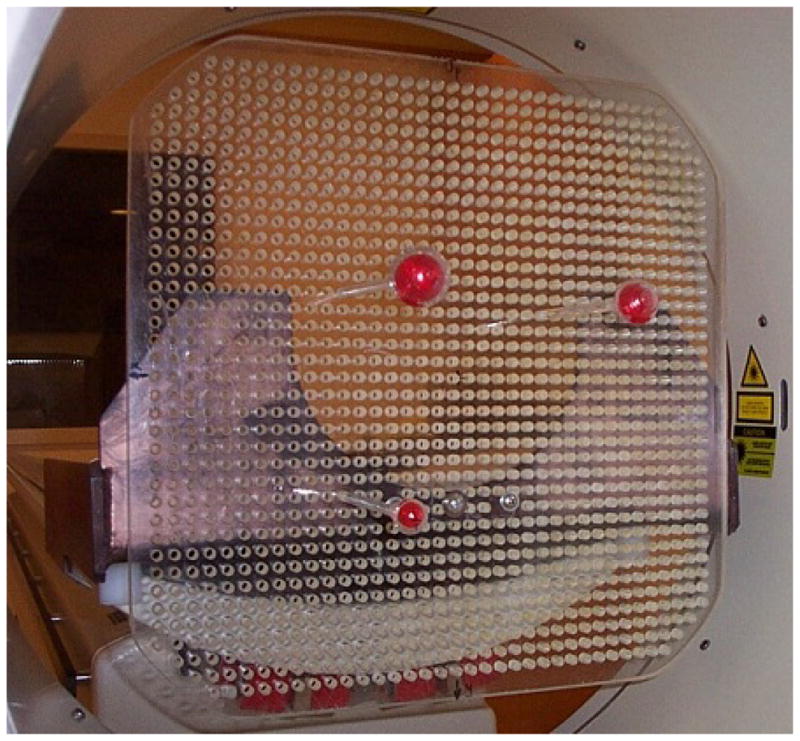
Grid used to mount artificial “lesions” in the PET field of view
This allowed exact placement of the lesion at any desired location in the PET scanner. The positions of the spheres were noted for use by the numerical observer. Both patient and sphere data were acquired in 3D mode. Randoms were estimated using the delayed-window subtraction method, and smoothed prior to subtraction from the total prompts. We assumed that the scatter associated with the sphere acquired in air was negligible compared to the scatter associated with the patient. The 40 locations were scanned separately for 3 minutes each, and listmode data stored. Lesions could have been added to the patient data using simulations, but to ensure realistic situations, we chose to acquire the “lesion” data on the scanner to avoid errors associated with normalization and incomplete modeling of the scanner components.
2.3. Lesion Addition
Acquisition data were collected in listmode so both conventional and TOF sinograms could be formed. The patient and sphere data were binned into 3D sinograms, with dimensions: 336 radial bins, 336 azimuthal bins and 559 3D planes (109 direct planes and 450 oblique planes grouped in 6 segments). The prompt and random events were contained within separate sinograms. The TOF data from the tomograph were subdivided into 15 time bins, each 312 ps wide; the conventional sinograms ignored the TOF measurements, combining all time bins into one. For each lesion-present image, a “lesion” sinogram from one sphere (neglecting randoms) was forward attenuated by dividing it by the patient attenuation sinogram, calculated from the CT transmission data. The attenuated lesion sinogram was then added to that of the patient. Lesion contrast defined as
ranged from 1.09 to 9.21 (mean 1.84) across the four reconstructions.
2.4. Mathematical Observer Models
The channelized Hotelling (CH) observer with sparse difference-of-Gaussian (S-DOG) channel configuration (three radially symmetric channel profiles, seen below), has shown good agreement with human performance (Yao and Barrett 1992; Barrett, Yao et al. 1993; Gifford, King et al. 2000; Abbey and Barrett 2001). A channelized non pre-whitening (CNPW) scheme with a dense difference-of-Gaussian (D-DOG) channel configuration (ten channel profiles) has also been used (Gifford, Kinahan et al. 2007; Kadrmas, Casey et al. 2009); this work includes both models.
The discriminant function of the CNPW observer is defined by the difference in (channelized) class means. It requires no knowledge of higher order statistics and is often used with small sample distributions. In the CH model, the intraclass scatter matrices are also used to maximize the class separability. This scheme is similar to Fisher linear discriminant analysis, except that the full ensemble statistics are not known, but rather approximated from the sample distributions.
The CH observer is the ideal linear discriminant and its performance often disagrees with that of a human, due in part to internal noise within the human observer. This noise is presumed to be on the order of the variance within each frequency channel, and is accounted for in the classification task, by doubling the magnitudes of the diagonal elements of the (channelized) prewhitening matrix (Abbey and Barrett 2001; Gifford, King et al. 2005). This “handicapped” ideal discriminant function necessarily yields a lower value of J (class separation) and has shown better agreement with human performance. In this study, the CH observer is implemented with internal noise to more closely match human performance.
2.5. Imaging Conditions
The mathematical observer SNR measured the (binary) class separability and was used to quantify reconstruction performance for various lesion contrasts (in the liver), patient scan times, and patient BMI. Lesion contrast was varied by adjusting the signal activity within each patient; 20K, 40K, and 60K counts were extracted from the sphere listmode data and added to the data from 25 patients with 3-minute clinical scans, yielding mean contrast values of, 1.14±0.03, 1.30±0.07, 1.47±0.11, respectively. The effect of TOF and PSF on patient scan time has been investigated before (Kadrmas, Oktay et al. 2012) and similar analyses were performed here; one, two, and three-minute scan time realizations were extracted from the patient data sets. To evaluate the influence of patient size on performance, the original 40 patients were grouped by BMI. Patients with BMI below 27 and above 29.5 were pooled into low and high BMI classes, respectively, producing two separate groups of 18 patients. For all conditions, the mean gains in observer SNR were evaluated over 10 iterations of the reconstruction algorithms.
2.6. Reconstructions
This work considered iterative reconstruction methods, as these are the current standard for clinical imaging. The ordinary Poisson (OP) OSEM (Michel, Sibomana et al. 1998) was the baseline reconstruction. This reconstruction treats the data as a discrete number of Poisson variables and iterates towards the maximum value of the likelihood function. In this scheme, the Poisson statistics are preserved.
For the images used in the observer study, the image processing schemes were optimized on the basis of performance of a model observer in detecting the presence of a 1 cm spherical signal in a random, noisy background. Single-bed PET data were taken from 40 patients, both with and without a lesion added in the liver, and reconstructed with each of the 4 algorithms (OP, PSF, TOF, and TOF+PSF), from 1–10 iterations, using 12 subsets, with 14 azimuthal angles per subset. According to clinical protocol of the institution, the sinograms were rebinned radially and angularly to 168 × 168; the final image matrix was also 168 × 168, with a pixel size of 4.073 mm, and a slice thickness of 2.027 mm. These images were then post-processed both without smoothing and with Gaussian kernels ranging in size from 4–10 mm (FWHM), in 1 mm increments, for a total of 25,600 images
The numerical observer was the 2D D-DOG CNPW (Gifford, Kinahan et al. 2007) in which a 15 × 15 pixel sub-image, centered on the lesion site, was processed through ten frequency-selective channels. The maximum SNR of the observer test statistic μ, with variance σ2, defined by
was used to determine both the optimal iteration number and smoothing kernel size to be used for each reconstruction. The subscripts denote each of the two classes, lesion-present and lesion-absent.
Based on the observer results, the reconstruction parameters were chosen as follows: OP-OSEM: 4 iterations and 6 mm filter; PSF: 5 iterations and 4 mm filter; TOF: 2 iterations and 6 mm filter; PSF+TOF: 2 iterations and no filter. The optimal reconstruction parameters vary among patients of a given population, and observer SNR was chosen to generalize these for all patients. These findings agree with those of Kadrmas et. al, where the same numerical observer was used to evaluate localization performance, instead of SNR, of lesions in an anthropomorphic phantom (Kadrmas, Casey et al. 2009). TOF reconstruction required fewer iterations, and reconstruction incorporating PSF modeling required less smoothing to achieve maximum SNR. Figure 4 shows coronal slices of the 4 reconstructions, including the simulated lesion.
Figure 4.
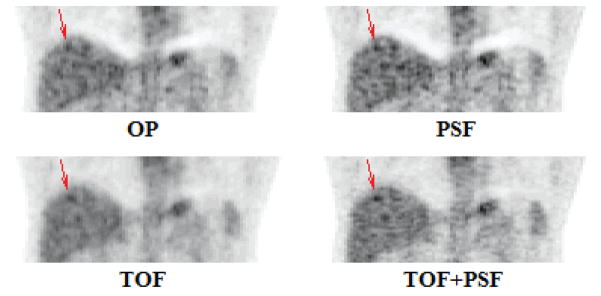
Coronal views of the four reconstruction techniques, processed with the optimal parameters, as determined by observer SNR.
2.7. Observer Studies
An experiment was designed to survey human performance in a realistic lesion detection task. A population of 33 disease-free patient bed positions was selected for the detection study. Lesion data were statistically added to these image volumes at various sites for a total of 88 lesion-present data sets. These data sets, along with the 33 lesion-absent ones, were reconstructed with the four algorithms for a study total of 484 images. In each reconstruction set, the number of lesions located at various anatomical sites was 40 in the liver, 24 in the lung cavity, 5 in the lung wall, 7 in other soft tissue regions, and 12 in the vertebrae.
A 3D image viewer was developed for this study which allowed an observer to navigate through the image volume in all orthogonal views, as well as adjust the image zoom, grayscale contrast, and color scheme. The 484 images were presented in random order to the readers, and they were instructed to examine each image, and select the most likely location of the 1-cm diameter spherical lesion, within a localization radius of 1cm. The reader had no knowledge about the presence (or absence) of the lesion and was given a 5-point scale by which to rate the confidence in their decision.
The confidence-rated decision data were used to characterize performance and construct receiver operating characteristic (ROC) curves. This approach quantifies observer performance, in a binary task, over all values of the discrimination threshold. The ROC curve plots the rate of true positives versus the rate of false positives. Localization (LROC) analysis plots the rate of correct localization versus the rate of false positives. If the data are assumed to be normally distributed, observer SNR can be calculated directly from the ROC curve.
For the analyses, an iterative, maximum-likelihood algorithm (Swensson 1996) was used to fit the corresponding probability density functions to the data from the observer tasks. This method, as well as the implementation of the localization observer, assumed the following: (1) the signal detection and localization by an observer correspond to the most likely location of the lesion in each image, (2) correct localization only occurs if the signal location is most suspicious, (3) the presence or absence of a lesion in an image has no effect on the observer’s decision process, and (4) the distribution of the observer’s decisions is normally distributed. These assumptions, and the consequences of their violation, are discussed further by Swensson (Swensson 1996). The physicians were encouraged to take periodic breaks within the task to minimize fatigue or strain that could affect their decision criteria.
The ROC and LROC performance of the human observers was compared to that of different 3D mathematical models. In this scheme, the model observers generated a template from a training set of images, which it then used to compute a decision statistic at every voxel in a predefined region of each test image. The test statistic is the numerical analog of the human perceptual measurement and is used to construct performance curves. Numerical observers were evaluated in a localization task of the lesions in the liver. For each patient used in the study, the CT transmission data were used to extract this region from the PET volumes, and the segmented regions were stored for use in the localization task. This method was applied to the lungs as well, but was unsuccessful because tissue density is less correlated with tracer uptake in this region.
In this work, eight different numerical observers were evaluated: the non-prewhitenings and Hotelling observers, each with 4 different frequency filters, using radially symmetric, difference-of-Gaussian (DOG) channels (Giffo Equation rd, King et al. 2000; Abbey and Barrett 2001; Gifford, Kinahan et al. 2007) defined by
where i is the channel number. The set of σi is defined according to
As in previous works, a dense (10-channel) DOG configuration was defined by the parameters Q= 1.67, α = 1.4, and σ0=0.005, and a sparse (3-channel) DOG configuration was defined using Q= 2 and α= 2 This study used 3 different frequency ranges for the sparse channels set by σ0.= 0.010, 0.015, and 0.020. These configurations were found to show similar performance to the human observers in the localization task.
For the human observer study, a set of images was generated solely for training purposes. The data from 16 lesions were added to 4 bed positions from 3 patients, not used in the detection task. These data sets were then reconstructed with all four reconstruction algorithms, for a total of 64 images. In the training exercise, each observer had knowledge of the locations of the lesions; this information was also used to train the numerical observers. A single template for each numerical observer was calculated using the total population of training images.
The detection task of the numerical observer computed a test statistic at every voxel within the search area; the voxel that returned the highest statistic was recorded as the most likely location of the lesion. If the observer did not correctly locate the lesion (false positive), the decision contributed to both the target and non-target distributions. If the observer did correctly locate the lesion, the decision contributed to the target distribution, and the location that returned the next highest statistic pooled with the non-target distribution. The numerical test statistic data were collected and binned into 5 categories, to match the format of the human decisions.
3. Results
The mean performance of the 3 human observers is seen in Figure 5 for all lesions in all anatomical locations.
Figure 5.
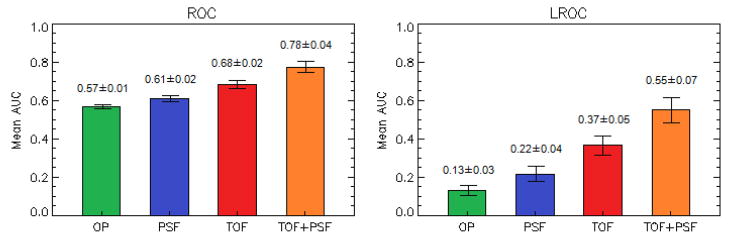
Performance of 3 human observers in the detection and localization task of all lesions, in all anatomical locations.
The results from the human study (AUCROC; AUCLROC), averaged over the 3 observers, were: OP (0.57±0.01; 0.13±0.03), PSF (0.61±0.02; 0.22±0.04), TOF (0.68±0.02; 0.37±0.05), and TOF+PSF (0.78±0.04; 0.55±0.07). The overall probabilities of correct localization were OP (0.17±0.03), PSF (0.27±0.03), TOF (0.41±0.08), and TOF+PSF (0.60±0.13).
There were significant differences in the observer performances corresponding to different anatomical regions. Figure 6 shows the LROC data for lesions located in the liver and lungs. The difference is attributed to lower background activity and noise in the lungs, increasing lesion SNR in this region. The performance of the human observers was compared to that of each of the numerical observers, in the same localization task of lesions in the liver. The LROC curve of each is seen in Figure 7.
Figure 6.

Comparison of physician performance in localization of liver and lung lesions.
Figure 7.

Comparison of the numerical observer models in localization of liver lesions.
The filter selection of the numerical observer had a greater impact on the performance than the whitening operation. As seen in Figure 8, good agreement was found between the mean performance of human and mathematical observers in the localization task of lesions in the liver.
Figure 8.
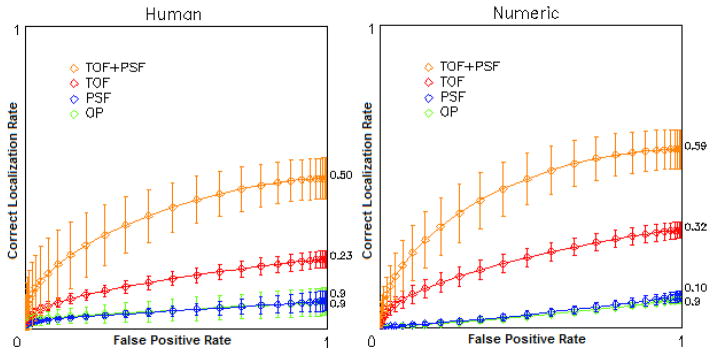
LROC curves showing mean localization performance of liver lesions for 3 human observers (left) and 8 numerical models (right)
The 8 numerical observers were used to evaluate the relative benefit of TOF+ PSF in the clinical data for different patient sizes, lesion contrasts, and scan times. Figure 9 shows the observer SNR for different lesion intensity and scan time. Each reconstruction set was processed with the number of iterations found to maximize observer SNR (Figure 3).
Figure 9.

Plots showing mean improvement in observer SNR of PSF, TOF, and TOF+PSF compared to OP, for various lesion contrasts and acquisition times.
Figure 3.

Plots of observer SNR; maximum SNR defined the optimal processing parameters
The data in Figure 9a are from the 3-minutes scans and Figure 9b shows the data using lesions with 60K counts. The greatest improvement is clearly seen in the faintest lesions and in the shortest scans. Figure 10 shows the gain in observer performance for patients with low and high BMI.
Figure 10.

Mean observer SNR improvement for different patient sizes.
TOF showed more improvement than PSF. For all iterations of each respective algorithm, the gain of PSF, TOF, and TOF+PSF was higher for the larger subjects.
4. Discussion
A lesion detection study has been developed to assess the benefits of PET reconstructions incorporating PSF and TOF. The use of real patient images with simulated lesions depicts an actual clinical task, that is, the detection and localization of small lesions with focal uptake in the liver, lungs, or other tissues. Numerical observer models were used to optimize experimental parameters as well as predict human performance. The assistance of 3 board-certified physicians provided validation of our numerical models.
The images presented to the physicians included a range of lesion contrast, and many were very low intensity, making the detection task challenging; AROC was close to 0.5 for the baseline OP reconstruction (essentially the same as a flipping a coin). This enhanced the gains in performance between the different reconstructions and emphasized the clinical benefits for the detection of small metastatic lesions that are “just visible”. The performance of the physicians demonstrated that TOF+PSF reconstruction yielded superior performance over PSF or TOF alone, supporting the results found by the mathematical observers for the same localization task.
Mathematical observer models are conditioned under the presumption that each element of the sample is part of the same random process. This assumption is rarely satisfied for real clinical imaging applications, where the amount of available training information is often insufficient to outweigh the randomness within the data. In this case, the ensemble cannot be completely characterized, i.e. a full-rank covariance matrix cannot be constructed. This is overcome through the use of limited, sub-images containing the important features and frequency-selective filtering. Both methods reduce the dimensionality of the problem and require prior information about the signal location.
Contradictory results have been reported on the ability of a human observer to whiten data in signal detection tasks. (Myers, Barrett et al. 1985; Rolland and Barrett 1992) The Hotelling observers in this study had internal noise added to the whitening operation to account for human error, and we found good agreement in these performances and those of the CNPW observers. The frequency selection of the channelized filter had more influence on observer performance than the whitening operation.
Noise in the PET data had a large impact on the reconstruction process, as seen in Figure 10. In iterative reconstruction, noise in the data obstructs the convergence of the algorithm and then causes it to diverge. After too many iterations, the signal contrast has already converged, and SNR decreases because image noise increases. This effect is accelerated when using TOF. For large patients, with very noisy data, the accelerated rate of TOF provided the largest SNR gain at the earliest iterations. In smaller patients, with less noisy data, the baseline reconstruction performed relatively better at the first iteration, and the maximum gain associated with TOF peaked later. Further, the convergence rate was delayed by incorporation of the PSF model. In small patients, resolution modeling offered little benefit and actually degraded observer performance in this task.
The analyses by our models showed that both TOF and PSF offer greater overall benefit for low-intensity lesions, shorter acquisition times, and in larger patients, consistent with the findings of previous groups (Armstrong, Williams et al. 2011; El Fakhri, Surti et al. 2011) The resolution modeling of the PSF algorithm produces higher contrast values for small signals, which can increase numerical observer SNR in certain tasks, provided the algorithm has sufficiently converged; at lower iterations however, the PSF reconstruction may yield suboptimal performance. The noise reduction across the FOV from the TOF information leads to better performance in localization tasks, for human and mathematical observers. In every case, the reconstruction with the combination of both PSF and TOF outperformed all other reconstructions.
Figure 2.

Channel profiles for an S-DOG configuration
Acknowledgments
The authors wish to thank the three physicians who assisted with this study, Drs. Yitong Fu, Karen Wells and Yong Bradley, of the University of Tennessee Medical Center, Knoxville, TN, and also Harold Rothfuss, Jim Hamill, and Judson Jones of Siemens Medical Solutions, Knoxville, TN for many helpful discussions. The assistance of Nathalie Abi Hatem and Jinsong Oyang in selecting possible lesion locations is also acknowledged. One of the authors [GEF] acknowledges support, in part, from the National Institutes of Health grant R01HL110241 and R01CA165221.
Contributor Information
Joshua Schaefferkoetter, Email: jschaefferkoetter@utmck.edu.
Georges El Fakhri, Email: elfakhri@pet.mgh.harvard.edu.
References
- Abbey C, Barrett H. Human-and model-observer performance in ramp-spectrum noise: effects of regularization and object variability. JOSA A. 2001;18(3):473–488. doi: 10.1364/josaa.18.000473. [DOI] [PMC free article] [PubMed] [Google Scholar]
- Armstrong IS, Williams HA, et al. Accuracy and variability of quantitative measurements using PET with time-of-flight information and resolution modelling. Nuclear Science Symposium and Medical Imaging Conference (NSS/MIC); IEEE. 2011.2011. pp. 4167–4170. [Google Scholar]
- Barrett H, Yao J, et al. Model observers for assessment of image quality. Proceedings of the National Academy of Sciences of the United States of America. 1993;90(21):9758–9765. doi: 10.1073/pnas.90.21.9758. [DOI] [PMC free article] [PubMed] [Google Scholar]
- Budinger T. Time-of-flight positron emission tomography: status relative to conventional PET. Journal of Nuclear Medicine. 1983;24(1):73–78. [PubMed] [Google Scholar]
- Casey M. Point spread function reconstruction in PET. Siemens Medical Solution; Knoxville, USA: 2007. http://www.medical.siemens.com/siemens/it_IT/gg_nm_FBAs/files/whtpap/wp_07_btruep_psf_reconstruction.pdf. [Google Scholar]
- Conti M, Bendriem B, et al. First experimental results of time-of-flight reconstruction on an LSO PET scanner. Physics in Medicine and Biology. 2005;50:4507–4526. doi: 10.1088/0031-9155/50/19/006. [DOI] [PubMed] [Google Scholar]
- Daube-Witherspoon ME, Matej S, et al. Impact of resolution modeling on accuracy and precision of lesion contrast measurements. Nuclear Science Symposium and Medical Imaging Conference (NSS/MIC); IEEE. 2011.2011. pp. 4373–4377. [Google Scholar]
- El Fakhri G, Surti S, et al. Improvement in lesion detection with whole-body oncologic time-of-flight PET. Journal of Nuclear Medicine. 2011;52(3):347–353. doi: 10.2967/jnumed.110.080382. [DOI] [PMC free article] [PubMed] [Google Scholar]
- Gifford H, Kinahan P, et al. Evaluation of multiclass model observers in PET LROC studies. IEEE transactions on nuclear science. 2007;54(1 Part 1):116–123. doi: 10.1109/TNS.2006.889163. [DOI] [PMC free article] [PubMed] [Google Scholar]
- Gifford H, King M, et al. Channelized Hotelling and human observer correlation for lesion detection in hepatic SPECT imaging. Journal of Nuclear Medicine. 2000;41(3):514–521. [PubMed] [Google Scholar]
- Gifford H, King M, et al. A comparison of human and model observers in multislice LROC studies. IEEE transactions on medical imaging. 2005;24(2):160–169. doi: 10.1109/tmi.2004.839362. [DOI] [PubMed] [Google Scholar]
- Jakoby B, Bercier Y, et al. Performance investigation of a time-of-flight PET/CT scanner. Nuclear Science Symposium Conference Record; IEEE. 2008.2008. pp. 3738–3743. NSS’08. [Google Scholar]
- Kadrmas DJ, Casey ME, et al. Impact of Time-of-Flight on PET Tumor Detection. Journal of Nuclear Medicine. 2009;50(8):1315–1323. doi: 10.2967/jnumed.109.063016. [DOI] [PMC free article] [PubMed] [Google Scholar]
- Kadrmas DJ, Oktay MB, et al. Effect of Scan Time on Oncologic Lesion Detection in Whole-Body PET. Nuclear Science, IEEE Transactions on. 2012;59(5):1940–1947. doi: 10.1109/TNS.2012.2197414. [DOI] [PMC free article] [PubMed] [Google Scholar]
- Karp JS, Surti S, et al. Benefit of Time-of-Flight in PET: Experimental and Clinical Results. Journal of Nuclear Medicine. 2008;49(3):462–470. doi: 10.2967/jnumed.107.044834. [DOI] [PMC free article] [PubMed] [Google Scholar]
- Lois C, Jakoby BW, et al. An Assessment of the Impact of Incorporating Time-of-Flight Information into Clinical PET/CT Imaging. Journal of Nuclear Medicine. 2010;51(2):237–245. doi: 10.2967/jnumed.109.068098. [DOI] [PMC free article] [PubMed] [Google Scholar]
- Michel C, Sibomana M, et al. Preserving Poisson characteristics of PET data with weighted OSEM reconstruction. Nuclear Science Symposium Conference Record; IEEE. 1998.1998. pp. 1323–1329. [Google Scholar]
- Myers K, Barrett H, et al. Effect of noise correlation on detectability of disk signals in medical imaging. Journal of the Optical Society of America A. 1985;2(10):1752–1759. doi: 10.1364/josaa.2.001752. [DOI] [PubMed] [Google Scholar]
- Panin VY, Kehren F, et al. Fully 3-D PET reconstruction with system matrix derived from point source measurements. Medical Imaging, IEEE Transactions on. 2006;25(7):907–921. doi: 10.1109/tmi.2006.876171. [DOI] [PubMed] [Google Scholar]
- Rolland J, Barrett H. Effect of random background inhomogeneity on observer detection performance. Journal of the Optical Society of America A. 1992;9(5):649–658. doi: 10.1364/josaa.9.000649. [DOI] [PubMed] [Google Scholar]
- Surti S, Karp JS. Experimental evaluation of a simple lesion detection task with time-of-flight PET. Physics in Medicine and Biology. 2009;54(2):373–384. doi: 10.1088/0031-9155/54/2/013. [DOI] [PMC free article] [PubMed] [Google Scholar]
- Surti S, Scheuermann J, et al. Impact of Time-of-Flight PET on Whole-Body Oncologic Studies: A Human Observer Lesion Detection and Localization Study. Journal of Nuclear Medicine. 2011;52(5):712–719. doi: 10.2967/jnumed.110.086678. [DOI] [PMC free article] [PubMed] [Google Scholar]
- Swensson R. Unified measurement of observer performance in detecting and localizing target objects on images. Medical Physics. 1996;23:1709–1725. doi: 10.1118/1.597758. [DOI] [PubMed] [Google Scholar]
- Tomitani T, Tanaka E. Noise Characteristics of Positron CT Using Time of Flight. Third Symposium on Physical and Technical Aspects of Transmission and Emission Computed Tomography; 1980. pp. 92–93. [Google Scholar]
- Tong S, Alessio A, et al. Noise and signal properties in PSF-based fully 3D PET image reconstruction: an experimental evaluation. Physics in Medicine and Biology. 2010;55:1453–1473. doi: 10.1088/0031-9155/55/5/013. [DOI] [PMC free article] [PubMed] [Google Scholar]
- Tong S, Alessio AM, et al. Evaluation of noise properties in PSF-based PET image reconstruction. Nuclear Science Symposium Conference Record (NSS/MIC); IEEE. 2009; 2009. pp. 3042–3047. [DOI] [PMC free article] [PubMed] [Google Scholar]
- Walker MD, Asselin M, et al. Bias in iterative reconstruction of low-statistics PET data: benefits of a resolution model. Physics in medicine and biology. 2011;56(4):931–949. doi: 10.1088/0031-9155/56/4/004. [DOI] [PubMed] [Google Scholar]
- Yao J, Barrett H. Predicting human performance by a channelized Hotelling observer model. International Society for Optics and Photonics. 1992:161–168. [Google Scholar]