

Abstract
Myosin powers contraction in heart and skeletal muscle and is a leading target for mutations implicated in inheritable muscle diseases. During contraction, myosin transduces ATP free energy into the work of muscle shortening against resisting force. Muscle shortening involves relative sliding of myosin and actin filaments.
Skeletal actin filaments were fluorescence labeled with a streptavidin conjugate quantum dot (Qdot) binding biotin-phalloidin on actin. Single Qdot’s were imaged in time with total internal reflection fluorescence microscopy then spatially localized to 1-3 nanometers using a super-resolution algorithm as they translated with actin over a surface coated with skeletal heavy meromyosin (sHMM) or full length β-cardiac myosin (MYH7). Average Qdot-actin velocity matches measurements with rhodamine-phalloidin labeled actin. The sHMM Qdot-actin velocity histogram contains low velocity events corresponding to actin translation in quantized steps of ~5 nm. The MYH7 velocity histogram has quantized steps at 3 and 8 nm in addition to 5 nm, and, larger compliance than sHMM depending on MYH7 surface concentration.
Low duty cycle skeletal and cardiac myosin present challenges for a single molecule assay because actomyosin dissociates quickly and the freely moving element diffuses away. The in vitro motility assay has modestly more actomyosin interactions and methylcellulose inhibited diffusion to sustain the complex while preserving a subset of encounters that do not overlap in time on a single actin filament. A single myosin step is isolated in time and space then characterized using super-resolution. The approach provides quick, quantitative, and inexpensive step-size measurement for low duty cycle muscle myosin.
INTRODUCTION
Myosin is a molecular motor powering the contraction of heart and skeletal muscle. It is frequently implicated in inheritable muscle diseases including hypertrophic and dilated cardiomyopathy (HCM and DCM) (1) and skeletal muscle myopathies (2). Characterizing myosin functionality and its alteration by disease implicated mutation is a high priority because it elucidates the molecular basis for disease to identify the targets for smarter therapy. During contraction, myosin transduces chemical free energy in the form of ATP in the cell into the work of translating its force producing partner actin against the force resisting muscle shortening. Transduction and actin translation are principal myosin functionalities affected by disease. We are concerned here with actin translation quantitation.
Muscle myosin is a linear molecule with a globular head domain at the N-terminus containing the ATP and actin binding sites and a long tail that spontaneously associates into a two headed dimer (both heads at one end). Head domain folding is assisted by two light chains, essential and regulatory, that bind to a long single α-helix in the head called the lever-arm. Dimers form the rod-like myosin thick filament with excluded head domains that project outward towards adjacent actin thin filaments in a muscle fiber. Actin and myosin filaments slide relatively during contraction due to impulsive force by myosin that occurs while they are tightly bound to each other. Within the myosin head or subfragment 1 (S1), ATP hydrolysis drives rotary movement of the lever-arm converting rotation into the linear translation of actin (3, 4). The lever-arm is stabilized by the two bound light chains and they affect lever-arm stiffness (5). Single ATPase cycle linear translation distance or step-size, h, derives from the lever-arm length and its shear stiffness. It is a crucial single molecule parameter characterizing myosin functionality. The skeletal myosin crystal structure (3) and its homology modeled analog for cardiac myosin (6) indicate identical lever-arm length for these isoforms implying their identical step-size.
The in vitro motility assay measures actin gliding velocity over a planar array of myosin immobilized on a surface. In its basic implementation, fluorescent labeled actin filaments glide over myosin to model unloaded contraction producing maximum velocity actin movement. Myosin translates actin only while the two molecules are tightly bound. The myosin duty cycle is the ratio of time spent strongly actin bound, ton, divided by the time to complete the ATPase cycle, τ. Muscle myosin has a low duty cycle, given by ton/τ, to enable rapid actin translation in a muscle fiber containing densely packed arrays of myosin motors interacting with translating actin filaments (7, 8). For low duty cycle myosin, actin sliding velocity in the motility assay depends on the myosin surface density because myosin is usually not actin bound so that many actomyosin interactions produce a longer actin translation between images of the fluorescent actin. Conventional microscope spatial resolution of ~520 nm suggests >100 actomyosin interactions must occur between collected images for detection if h = 5.2 nm. The high number of actomyosin interactions required normally prohibits direct detection of h in the motility assay.
Sparse fluorescent probes individually imaged are localized to higher precision than diffraction limited resolution by fitting the point spread function (PSF) to the measured photon distribution (9, 10). The analysis substitutes the distribution center for the point object position with precision determined by the signal-to-noise ratio (SNR) rather than the diffraction limited PSF width (11, 12). This super-resolution imaging has localized point objects with < 1 nanometer accuracy (13). Low duty cycle skeletal and cardiac myosins present challenges for a sparse single molecule assay because actomyosin dissociates quickly and the freely moving element diffuses away. We introduce here super-resolution particle tracking of quantum dot (Qdot) labeled actin in the standard in vitro motility assay. The in vitro motility assay has modestly more actomyosin interactions than a single molecule encounter while actin diffusion is inhibited by addition of methylcellulose to the motility buffer. The net effect sustains the actomyosin complex while preserving a subset of encounters that do not overlap in time on a single actin filament. A single myosin step is isolated in time and space then characterized using super resolution.
We immobilized rabbit skeletal heavy meromyosin (sHMM) on the planar substrate in the in vitro motility assay. Rapid sHMM motility limited camera exposure time to 10 ms to ensure actin is rarely actively translated by myosin during an exposure. This also determines practical limits for photon counts per pixel providing a spatial resolution of ~3 nm for the actin attached Qdot under the most favorable conditions. At modest myosin surface density and actin filament length, quantized particle velocities corresponded to a unitary myosin step-size of ~5 nm for the low duty cycle motor. We also immobilized full-length porcine β-cardiac myosin (MYH7) on the planar substrate in the in vitro motility assay. Its slower ATPase kinetics permitted a 30 ms exposure time providing a spatial resolution minimum of ~1 nm for the actin attached Qdot under the most favorable conditions. For MYH7 we observed several unitary steps, one as expected at ~5 nm and two less probable steps of 3 and 8 nm. The relative frequencies of the 3 and 5 nm steps are very different making it unlikely that they are simply sub-steps of the longer 8 nm unitary step. Step-sizes in MYH7 shortened measurably at higher myosin surface concentration suggesting myosin compliance changes as myosin crowds the surface.
Quantitating in vitro motility velocity with super-resolution microscopy opens the way for rapid, quantitative, and inexpensive step-size measurement in low duty cycle muscle myosins implicated in inheritable muscle diseases.
METHODS
Chemicals
Quantum dot 585 streptavidin conjugate (Qdot), rhodamine-phalloidin, biotin-XX-phalloidin and phalloidin were obtained from Life Technologies (Grand Island, NY). Glucose oxidase was purchased from MP Biomedicals (Santa Ana, CA). Biotin free bovine serum albumin (BSA, cat # A3059), catalase, and methylcellulose (m0262, MW 41 kD) were from Sigma-Aldrich (St. Louis, MO). Bradford assay was purchased from Bio-Rad (Hercules, CA). Other chemicals were purchased from Sigma-Aldrich or Affymetrix (Cleveland, OH).
sHMM preparation
Rabbit skeletal myosin was prepared from the leg and back muscles by the method of Tonomura et al. (14). HMM was obtained by chymotryptic digestion of myosin (15).
MYH7 preparation
Porcine β-cardiac myosin (MYH7) was prepared from heart ventriculum as preciously described for bovine cardiac myosin with some modifications (16). MYH7 was extracted from minced, washed ventriculum for 10 min at 4 °C with “Guba-Straub” solution (0.3 M KCl, 5 mM ATP, 1 mM DTT, 5 mM MgCl2, 1 mM EGTA in 50 mM potassium phosphate buffer, pH 6.5). After the solubilized myosin was separated from the tissue by centrifugation, three cycles of precipitation were performed to eliminate contaminating soluble proteins. Then the pellet was dissolved in a high salt wash (0.6 M KCl, 5 mM ATP, 1mM DTT, 5 mM MgCl2, 1 mM EGTA, 0.001 mg/ml Leupeptin in 50 mM Tris-HCl pH 8.0) followed by ultracentrifugation (250,000×g, 2 h). The upper 2/3 rds of the supernatant was collected and dialyzed overnight in storage buffer (0.6 M KCl, 2 mM DTT, 0.001 mg/ml Leupeptin in 50 mM Tris-HCl pH 7.4) followed by ultracentrifugation (250,000×g, 3 h) to remove remaining actin or actomyosin impurities. MYH7 was stored in sealed tubes at −20°C in 50% glycerol (vol/vol).
Urea gel electrophoresis and mass spectrometry analysis of our porcine cardiac myosin did not detect any phosphorylated regulatory light chain (RLC) in the myosin (17). The myosin has less than 5% actin impurity judged from analyzing the SYPRO Ruby stained SDS/PAGE.
Actin preparation and labeling
G-actin was obtained from rabbit skeletal muscle acetone powder by using the method described by Pardee and Spudich (18) then stored immediately under argon gas in liquid nitrogen. Before actin was used, the frozen G-actin was thawed and spun in an airfuge (Beckman Coulter, Indianapolis, IN) at 160,000×g for 90 min to remove denatured actin. We compared motilities of skeletal HMM using actin obtained with and without liquid nitrogen storage and average velocities were the same within error. Rhodamine labeling of actin filaments was performed with rhodamine-phalloidin and actin in a 1.2:1 molar ratio as described previously (19). Biotin-XX-phalloidin plus rhodamine-phalloidin labeling of actin filaments was performed like rhodamine-phalloidin labeling but with the biotin-XX-phalloidin to rhodamine-phalloidin molar ratio of 1:9 while total phalloidin derivatives to actin molar ratio remained 1.2:1. We tested biotin-XX-phalloidin to rhodamine-phalloidin molar ratios of 1:1, 1:4, 1:9, 1:19, 1:49, 1:99, and 1:199 to optimize conditions favoring one Qdot per actin filament with most filaments Qdot labeled and found 1:9 was optimum. Phalloidin derivatives were incubated with actin overnight on ice. Qdot streptavidin conjugation to the biotin-XX-phalloidin labeled actin was done in the flow cell (see below).
sHMM in vitro motility
sHMM dead-heads were removed prior to use by mixing sHMM with phalloidin labeled actin, adding 2 mM ATP, raising KCl concentration to 100 mM and then spinning down the mixture at 160,000×g for 20 mins (20). 4 nM Qdots were prepared in Qdot solution (6% BSA in C buffer) just prior to the motility measurement using Qdot stock spun down at 5000×g and 1 μL of supernatant added to 250 μL Qdot solution.
Motility assays using rhodamine-phalloidin labeled actin filaments were performed as described by Kron et al. (19). We developed a protocol for the Qdot + rhodamine-phalloidin labeled actin motility assay from Månsson et al. (21) with substantial changes. Each sHMM sample was diluted in C-buffer (25 mM KCl, 25 mM imidazole pH7.4, 5 mM MgCl2, 0.1 mM EGTA, 10 mM DTT, 0.1 mM PMSF) to 0.057, 0.114, 0.171, or 0.285 μM (assuming sHMM molecular weight of 350kD), 15 μL of which was infused into a flow cell made from the nitrocellulose coated glass coverslip and incubated for 2 min. After sHMM incubation, the flow cell was washed with 30 μL of 1 mg/ml BSA solution (BSA in C-buffer), incubated with 15 μL of 25 mg/ml BSA solution for 2 min, and then washed again with 30 μL of 1 mg/ml BSA solution. We did a second dead-head removal for sHMM immobilized in the flow cell by, 1 min incubation with 30 μL of C buffer, 2 min incubation with 30 μL of 2 μM phalloidin labeled actin in C-buffer, 1 min incubation with 30 μL of 1 mM ATP in C-buffer, and 1 min incubation with 30 μL of C-buffer. After that, 30 μL of 4 nM biotin-XX-phalloidin plus rhodamine-phalloidin labeled actin in C-buffer was infused for 30 sec incubation. Then, 30 μL of 4 nM Qdots in Qdot solution was infused for 60 sec incubation. It was followed by 30 μL volume of 1 μM biotin in C-buffer to block free biotin binding sites on streptavidin. After 1 min incubation, the flow cell was washed with 30 μL C-buffer and mounted on the microscope stage. Once the sample was in focus, the standard motility buffer (25 mM KCl, 25 mM imidazole pH7.4, 5 mM MgCl2, 0.1 mM EGTA, 20 mM DTT, 0.1 mM PMSF, 0.7% methylcellulose with viscosity 12 cP at 20 °C, 2 mM ATP, 3 mg/ml glucose, 0.018 mg/ml catalase, and 0.1 mg/ml glucose oxidase) was infused to initiate motility. All the motility assays were performed at 21°C.
MYH7 in vitro motility
In vitro motility assays for MYH7 using rhodamine-phalloidin labeled actin were performed as previously described by Pant et al. (22) and Greenberg et al. (23). The assay using Qdot labeled actin was similar to that for sHMM. MYH7 in 50% glycerol (200 μg myosin) was suspended in 12 vol of 10 mM DTT in ice cold water and precipitated for 1 h on ice then centrifuged at 16,000×g for 30 min at 4°C. The pellet was resuspended in 200 μl M-buffer (0.3 M KCl, 1 mM EGTA, 5 mM MgCl2, 10 mM DTT in 25 mM imidazole pH7.4). The myosin was mixed with 1 mM ATP and 1.1 μM actin in M-buffer and centrifuged in an Airfuge (100,000×g for 30 min) to remove dead-heads. Myosin concentration was determined using the Bradford assay then the sample was diluted to the desired concentration. 15 μL of the myosin sample was infused into a flow cell made from the nitrocellulose coated glass coverslip and incubated for 1 min. After incubation, the flow cell was washed with 30 μL of 1 mg/ml BSA solution (BSA in M-buffer), incubated with 15 μL of 25 mg/ml BSA solution for 2 min, and then washed again with 30 μL of 1 mg/ml BSA solution, followed by 90 μL of low-salt-buffer (25 mM KCl, 1 mM EGTA, 5 mM MgCl2, 10 mM DTT in 25 mM imidazole pH7.4). After 1 min incubation, we did a second dead-head removal by, 2 min incubation with 30 μL of 1 μM phalloidin labeled actin in low-salt-buffer, 1 min incubation with 30 μL of 1 mM ATP in low-salt-buffer, and 1 min incubation with 30 μL of low-salt-buffer. After that, 30 μL of 8 nM biotin-XX-phalloidin plus rhodamine-phalloidin labeled actin in low-salt-buffer was infused for 30 sec incubation. Then, 30 μL of 5 nM Qdots in Qdot solution was infused for 60 sec incubation. It was followed by 30 μL of 1 μM biotin in low-salt-buffer. After 1 min incubation, the flow cell was washed with 30 μL of low-salt-buffer and mounted on the microscope stage. Once the sample was in focus, the cardiac motility buffer (25 mM KCl, 25 mM imidazole pH7.4, 5 mM MgCl2, 1 mM EGTA, 20 mM DTT, 0.7% methylcellulose, 2 mM ATP, 3 mg/ml glucose, 0.018 mg/ml catalase, and 0.1 mg/ml glucose oxidase) was infused to initiate motility.
Microscopy
Quantitative actin motility assays using Qdots always used the Qdot+rhodamine-phalloidin labeled actin to allow evaluation of actin filament length and integrity. In vitro motility of rhodamine-phalloidin or Qdot+rhodamine-phalloidin labeled actin was observed with through-the-objective total internal reflection fluorescence (TIRF) (24) on an Olympus IX71 inverted microscope using a 150X, 1.45 NA objective. TIRF illumination is evanescent and confined to the flow cell surface containing sHMM or MYH7 with ~100 nm penetration depth into the bulk phase. Images were acquired with an Andor EMCCD camera (iXon3 897 with 16 × 16 μm pixels and 16 bit dynamic range) at 20 frames per second and 10 msec exposures (sHMM) or 5 frames per second and 30 msec exposures (MYH7) using the software supplied by the manufacturer (SOLIS). Intensity values were converted to photons using the conversion formula in SOLIS as appropriate for our camera and the images output in TIFF format for reading into ImageJ. Argon ion laser (Coherent Innova 90C) intensity was ~30 mW at 488 nm.
The total Qdot labeled actin filaments observed decreased after infusion of motility buffer to ~40% of its initial value in ~5 min probably due to detachment from the surface and movement out of the evanescent illumination. This is sooner than the rhodamine labeled actin filaments but long enough for completion of motility measurements.
Standard in vitro motility data was acquired from rhodamine-phalloidin or Qdot+rhodamine-phalloidin labeled actin moving over sHMM or MYH7 using manual filament tracking with the ImageJ plugin, MTrackJ (25).
Super-resolution measurements
We processed photon converted images for super-resolution using the QuickPALM ImageJ plugin super-resolution fitting algorithm in 2 dimensions (26). The software identified and localized point objects that qualified for super-resolution fitting according to user specifications including minimum SNR (> 25 isolating Qdots) and maximum full width at half maximum (FWHM) of 5 pixels (107 nm/pixel in object space for the 150X objective). QuickPALM analysis produced a table (SRTable) listing each qualifying particle, particle position in pixels, position standard deviation, and frame identifier. Using the SRTable, QuickPALM rendered the super-resolved particle data as single pixels per particle in the frame sequence of the original data. Two rendering types were used where each subsequential frame contained (i) no previously observed particle positions and (ii) all previously observed particle positions. The latter shows Qdot pathways that are useful during the manual particle tracking described below.
Type 2 rendered frames were read into ImageJ and analyzed with MTrackJ (25). Single pixel resolution (107 nm) of the rendered images is much less than super-resolution (<10 nm). Manual tracking was needed only to link the super-resolved particle positions into a track connecting time-ordered frames. Manual tracking with MTrackJ provided a file identifying the approximate position (within a 3 pixel radius) of the super resolved particle. A separate Mathematica program, SRTrack, linked the actual super resolved particle coordinate to the track then updated the SRTable with the frame-to-frame tracking linked list. SRTrack eliminated any incorrectly identified MTrackJ particles that did not have a super-resolved equivalent. The latter removed the effect of Qdot blinking.
In any motility assay a few Qdots did not visibly move due to apparent immobilization on the glass surface. These particles were tracked at super-resolution using the Type 1 rendered images. Type 1 rendered images were treated similarly to Type 2 but used to analyze and quantitate thermal/mechanical fluctuations. These fluctuations were smaller than one pixel but were quantifiable at super-resolution. Stage drift was not detected in the velocity histograms used for data analysis probably because velocity data corresponded to the difference of Qdot positions between sequential frames.
Data fitting
Measured Qdot velocities were plotted in histograms with velocity in units of h/Δt = 1, for h the apparent step size parameter and Δt the frame capture time interval. Histogram intervals were 0.167 to 0.2 over the 0-4 velocity domain (20-25 intervals). The sHMM data separated into peaks by inspection corresponding approximately to 5 nm steps. Step-size parameter h was then scanned over a 4 nm interval in small uniform steps (0.01 nm) with a median of 5 nm. The best step-size was selected by minimizing the difference between peaks in the histogram and integer multiples of the initial peak near unit velocity. The MYH7 data separated into peaks by inspection although the pattern was more complex than that for sHMM. The lowest velocity peak was bimodal corresponding to two steps, the longer and prevalent step near 5 nm and the shorter minor step near 3 nm. Step size was then scanned over a 4 nm interval in small uniform steps (0.01 nm) with a median of 4 nm. The best median step-size was selected by minimizing the difference between peaks in the histogram and integer multiples of the prevalent step alone and in combination with the minor steps. We interpreted the prevalent step near 5 nm as unitary because of its anticipated correspondence with the unitary skeletal step. The sHMM did not indicate the minor step hence we attributed it to an unexpected difference between skeletal and cardiac isoforms, a consequence of full length myosin in MYH7, or both possibilities. Our interpretation of the origin of the short step implies a third unitary step occurs at 8 nm as discussed in RESULTS.
System optimization
Machine setting for measuring step-size with super-resolution in vitro motility optimize the contrary requirements for point resolution and separating unitary actomyosin interactions in time. One method to do this is outlined below.
Measure the ensemble average velocity using the super-resolution microscope and Qdot labeled actin. The frame rate shows visible actin translation between frames. Estimate motility velocity with standard resolution spot tracking. Optimize fluorescence collection efficiency to obtain maximal photons for lowest excitation light. Raise excitation level to the maximum consistent with probe photobleaching rate and experiment duration. Qdots do not apparently photobleach however we needed to visualize both the Qdot and rhodamine label on the actin. This limits excitation level.
Analyze the standard motility data with QuickPALM. The program estimates and removes background light, computes standard deviation for two spatial dimension, (sx, sy), and signal intensity in photons, N = γ te, for te the camera exposure time and γ the proportionality factor depending on excitation and detection characteristics. Assuming x and y dimensions are equivalent, compute point resolution, Δx, (in pixels) using (11).
Step size (h) measurement require Δx ◻ h/2 implying . Time between successive frames Δt > te for every camera. The cross-bridge produces actin translation during actin attached time, ton, that is 2-20 ms for the skeletal and cardiac isoforms. The cross-bridge should not attach to actin during te to avoid a movement artifact. The probability that te and ton overlap is te×ton/(Δt)2 for the lowest velocity events where resolution is most demanding. Overlap happens in this context ≤ 2% of the time in our conditions.
Isolating single cross-bridge interactions with actin during motility is most likely when Δt is small because it reduces probability that two or more interactions will occur between successive frames. System optimization finds the smallest Δt consistent with the above.
If Δx ~ h/2 cannot be satisfied then raise excitation level. Visualizing both the Qdot and rhodamine label on the actin is not an absolute requirement and does not need to be done continuously throughout the assay. For instance, check actin filament length with rhodamine emission before the motility assay at a lowered exciting light level.
RESULTS
In vitro motility
Figure 1 panel A shows the ensemble average sHMM motility velocity vs bulk concentration of sHMM for the rhodamine-phalloidin (open circles) and Qdot+rhodamine-phalloidin (closed circles) labeled actin. We used MTrackJ to do the manual tracking and average velocity calculation. Each filament was tracked for >20 μm. The sliding velocity of actin filaments at each sHMM concentration was measured by averaging the speeds of 25-40 filaments from 2-3 slides. Error bars show standard deviation. The difference between the velocities of rhodamine-phalloidin and Qdot+rhodamine-phalloidin labeled actin filaments was less than one standard deviation for sHMM bulk concentrations ≥ 0.114 μM. Average motility velocity increases with increasing bulk sHMM concentration (and presumably with increasing sHMM surface density) as expected for a low duty cycle motor. The divergence of velocities for rhodamine-phalloidin and Qdot+rhodamine-phalloidin labeled actin at the lowest surface density suggests the Qdot imposes a force resisting movement for the static filament that is dispelled when the filament begins to move. Figure 1 panel B shows the data equivalent to that in panel A for MYH7. MYH7 has maximum velocity ~1/7 th that of sHMM. The difference between the velocities of rhodamine-phalloidin and Qdot+rhodamine-phalloidin labeled actin filaments was less than one standard deviation for MYH7 bulk concentrations ≥ 0.08 μM again implying the Qdot imposes a force resisting movement for the static filament that is dispelled when the filament begins to move. There is a small systematic reduction in velocity of ~ 0.04 μm/s at all MYH7 bulk concentrations measured apparently imposed by the Qdot suggesting a residual resisting force for the dynamic filament.
Figure 1.

Ensemble average in vitro motility velocity vs bulk concentration of myosin for the rhodamine-phalloidin (open circles) and Qdot+rhodamine-phalloidin (closed circles) labeled actin. Error bars show standard deviation. (A) sHMM and (B) MYH7.
Figure 2 shows a single frame of Qdot+rhodamine-phalloidin labeled actin filaments moving over surface bound sHMM in a motility assay with biotin-XX-phalloidin to rhodamine-phalloidin in a molar ratio 1:9. Qdot intensity dominates the intensity scale in the figure but the 16 bit dynamic range of the camera also captures a substantial intensity range for the rhodamine emission. The inset shows rhodamine labeled actin filaments moving over surface bound sHMM in a motility assay with rhodamine-phalloidin and phalloidin in a molar ratio of 1:9. Rhodamine labeling is heterogeneous along the filament at this labeling density. Movies of Qdot+rhodamine-phalloidin actin moving over sHMM and MYH7 are available in Supporting Information.
Figure 2.

Qdot+rhodamine-phalloidin labeled actin filaments bound to sHMM in the motility assay. The inset shows rhodamine labeled actin filaments in the motility assay with rhodamine-phalloidin to phalloidin in a molar ratio 1:9. Rhodamine labeling is heterogeneous along the filament at this labeling density
Effect of methylcellulose
Addition of 0.7% methyl cellulose to the motility buffer was required to prevent actin filaments from diffusing away from myosin coated surface while myosin density is low. It was shown previously that 0.5%–1.0% methyl cellulose in motility buffer increases the solution viscosity and retards the actin filament’s lateral Brownian motion without significantly affecting the sliding velocity over sHMM (19, 27). We found no difference in rhodamine-phalloidin actin velocity over MYH7 for 0.5% and 0.7% methylcellulose (data not shown, from 0.1-0.2 μM bulk concentration MYH7).
Super-resolution particle tracking of sHMM
Figure 3 shows the Type 2 rendering of an inverted-intensity super-resolved Qdot track in an in vitro motility assay. sHMM surface density, σ, derives from 0.114 μM bulk concentration. Each black square represents a 107 × 107 nm pixel containing the Qdot. Circles connected by a line are the MTrackJ manually created track. Super-resolved Qdot displacement among sequential frames is frequently within one rendered pixel implying the rendered image will appear unchanged for two or more sequential frames. In this case, the MTrackJ user clicks on the same pixel over the frames with the unchanged image. This circumstance is indicated in Figure 3 with nearly concentric circles falling onto one pixel. MTrackJ writes the file identifying frame and circle position that is then linked to the actual super-resolved particle using these identifiers as described in METHODS.
Figure 3.

The high contrast, intensity-inverted, Qdot track in an in vitro motility assay of sHMM. The QuickPALM super-resolved single particles are rendered at one pixel resolution and all previously recorded frames are plotted in the image (Type 2 rendering). Circles connected by a line are the MTrackJ manually created track. The circle is placed manually within a few pixels of the super-resolved particle position. The track is then associated to the correct super-resolved particle using another computer program, SRTrack, described in the text.
Figure 4 shows actin sliding velocity event distributions for sHMM in the low velocity domain 0 – 4.1 for h = 5.2 nm and frame capture interval Δt = 0.05 sec (0 – 0.40 μm/sec). Figure 4A shows event distribution for σ derived from 0.114 μM sHMM bulk concentration (solid squares) and baseline (solid circles) from thermal/mechanical fluctuation events. Velocity probability data indicates discrete integer velocities corresponding to a myosin step-size of 5.2 nm (Table 1). Area under the peaks at velocities 1, 2, 3, and 4 and after baseline subtraction corresponds to 8, 38, 40, and 66 events for a total of 152 events. This sHMM bulk concentration was most efficient for producing the low velocity events providing the optimized sHMM surface density to favor non-overlapping cross-bridge/actin interactions under our conditions. For this sample, root mean squared standard deviation (rmsd) in one dimension was as low as 3 nm, with an average value of 7 nm, for the point intensities recorded (12).
Figure 4.

Actin sliding velocity event distribution for 50 msec frame capture intervals. (A) Event distribution for the 0.114 μM bulk sHMM concentration (closed squares connected by dashed line) and the simulation (solid line). The fitted baseline representing thermal/mechanical velocity fluctuation (closed circles connected by dashed line) is also shown. (B) Same as in A except for the event distribution summed over all bulk concentrations. Simulated lines are generated as described in the text.
Table 1.
Myosin in vitro step-size 1
| Unitary Step-Size (nm) |
Step Probability |
|||||
|---|---|---|---|---|---|---|
| Protein | 1 | 2 | 3 | 1 | 2 | 3 |
|
| ||||||
| sHMM | 5.2 | - | - | 1 | - | - |
| MYH7 | 5.1 | 8.2 | 3.2 | 1/2 | 3/8 | 1/8 |
Error is ~10% based on goodness of fit for 2 (sHMM) or 6 (MYH7) parameter fitting. Parameters are actin site occupation probability p, unitary step-size, and (for MYH7) step probabilities.
Other bulk sHMM concentrations investigated produce similar velocity event recordings after baseline subtraction. Figure 4B combines events detected for σ derived from 0.057, 0.114, 0.171, and 0.285 μM bulk concentrations for 497 total events. Event data at each bulk concentration had a fitted baseline from control immobilized Qdots subtracted to remove the thermal/mechanical fluctuation events as described below then velocity event distribution data were combined. Velocity histograms in Figure 4 were tabulated from 2-3 slides over 2-3 days with 2 data sets from each slide and for each bulk concentration. One data set contained 400-600 consecutive frames. Approximately 150 low velocity events corresponding to 60-120 actin tracks were accumulated for each bulk concentration.
Simultaneously bound cross-bridges produce identical actin sliding velocity under unloaded conditions like that in the in vitro motility assay hence the net velocity is proportional to the time any cross-bridge is actin bound between frames. Skeletal HMM has 1/τ = Vmax ~ 20 s−1 (28) per cross-bridge and duty cycle f ~ 0.05 (7) implying time spent actin bound at maximum sliding velocity is ton = f/Vmax ~ 2.5 ms. Two cross-bridges binding an actin filament at times offset by >3 ms but falling in the same frame capture interval will produce a sliding velocity of 2 (Figure 4). At low actin sliding velocity this is likely to occur. At higher velocities, where multiple cross-bridges are impelling actin, it is more likely that two or more cross-bridges will overlap some of their bound time producing a net sliding velocity intermediate to the discrete velocities at or near 1, 2, 3, and 4. This effect is seen as the rising baseline in Figures 4A and 4B that is reproduced in the simulation.
We simulated motility assay velocity probability density using a time×space array representing an actin filament interacting with the surface bound sHMM. Columns represent time evolution of myosin binding sites on actin. Rows are the spatial representation of myosin binding sites on actin located every 36 nm along the filament. They interact with surface bound myosin. The binding site (or target zone) is 3 actin monomers long (a ~ 16.5 nm) and has a width w ~ 40 nm (29). We simulated an actin filament 1.2 μm long having M = 33 total myosin binding sites. The time×space array was filled one row at a time by randomly generating binding site occupation from constant empty site occupation probability p that is the simulation parameter adjusted to match observation. We also tried an adapting algorithm with p = p0(M-g)/M for g the occupied sites in the row and p0 the binding probability when g = 0 under the assumption that tethering actin to the surface lowers subsequent probability for binding due to stearic constraints. For either algorithm, our expectation was that p ◻ σ a w implying p increases with rising sHMM bulk concentration although this turned out to be incorrect as discussed below.
To evaluate time evolution, we partitioned ton into n segments, tseg = ton/n, then using <ton> = 2.5 ms, we chose an actual on-time for the bound cross-bridge randomly and normally distributed within a width that best reproduced the peak widths in Figures 4A and 4B. For n = 16, a width of 2 tseg (~0.3 ms) represented observed dispersion in ton. An occupied binding site stayed occupied for several tseg’s (one tseg elapses between rows in the time×space array) and on average for <ton>. The total array column length is equal to, Δt/tseg, for Δt the time interval between consecutive frames. The actin filament velocity is then the number of rows with at least one site occupied, times the myosin step-size, divided by n Δt. The simulation for a single actin filament and for Δt = 50 ms is run repeatedly until the number of events falling in the 0-4 velocity range match the number observed.
The baseline was fitted to the velocity event distribution using the relationship, vobs = vsim + c vt/m, where vobs is the total observed column velocity event distribution vector, vsim is the simulated equivalent to vobs that does not include thermal/mechanical events, c is the unknown scalar, and vt/m is the observed thermal/mechanical column velocity event distribution vector. Constant c is overdetermined and estimated by least squares minimization with c = vt/mT (vobs-vsim)/(vt/mTvt/m) for superscript T meaning transpose.
Two scenarios creating low velocity events have actin gliding over: a homogeneous sHMM coated surface whose coverage varies with the bulk sHMM concentration infused into the flow cell (implying p varies with bulk [sHMM]) but that occasionally produces a down fluctuation in sHMM bound to the actin filament, or, a heterogeneous sHMM coated surface whose average coverage varies with the bulk HMM concentration infused into the flow cell but where local low density coverage areas are encountered (albeit less frequently with higher average sHMM coverage and implying constant p). Simulation shows that p ~ 0.0005 well represented data for every surface concentration (Figures 4A and 4B) supporting the heterogeneous sHMM coated surface scenario. Simulation shows that the homogeneous sHMM coated surface scenario has discrete velocities heavily weighted towards the high velocity end and contrasting with observation.
Simulated data is shown in Figures 4A and 4B as the solid line for 152 and 497 events (after baseline subtraction), respectively. Simulated area under the peaks at 1, 2, 3, and 4 for the 0.114 μM bulk concentration data (Figure 4A) correspond to 9, 38, 46, and 58 events that compare favorably to the 8, 38, 40, and 66 event distribution observed. The total simulated and observed events are not identical because round off from the baseline subtraction affects the two data sets differently. Peak areas for the combined data (Figure 4B) correspond to 29, 122, 116, and 230, and, 37, 125, 110, and 229 events also demonstrating agreement between simulation and observation. At p ~ 0.0005, occupation probability was so low that constant or adaptive p made no difference in the simulation.
Super-resolution particle tracking of MYH7
Figure 5 shows actin sliding velocity event distributions for MYH7 in the low velocity domain 0 – 4.1 in velocity units where h/Δt = 1 for h = 3.80 (A), 3.3 (B), and 3.3 (C) nm and frame capture interval Δt = 0.2 sec (0 – 0.08 or 0 – 0.07 μm/sec). Figure 5A shows event distribution for σ derived from 0.08 μM MYH7 bulk concentration (solid squares) and baseline (solid circles) from thermal/mechanical fluctuation events. Velocity probability data indicates discrete integer velocities corresponding to three myosin step-sizes of ~3.2, ~5.1, and ~8.2 nm (different sized single vertical arrows in Figure 5A). Total area under the Figure 5A curve corresponds to 436 events. For this sample, root mean squared standard deviation (rmsd) in one dimension was as low as 1 nm, with an average value of 2.4 nm, for the point intensities recorded (12).
Figure 5.
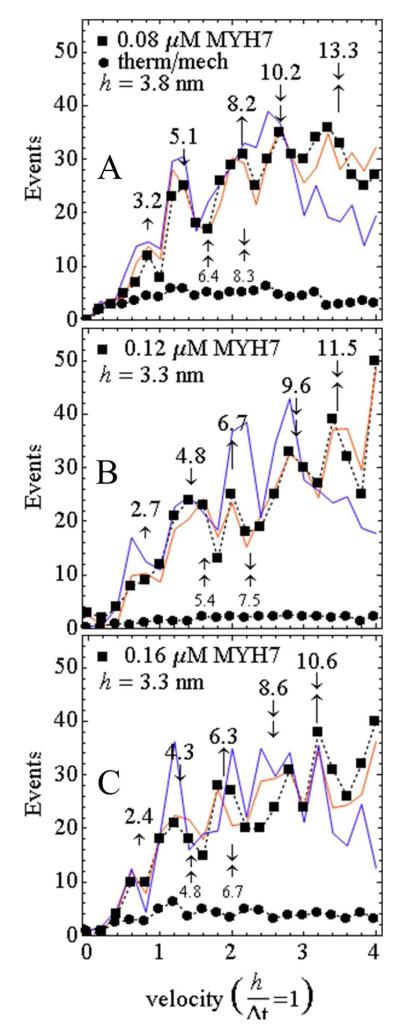
Actin sliding velocity event distribution for 200 msec frame capture intervals. Single vertical arrows identify unitary steps (↼ short, ⇑ medium, ⒑ long), and their correlation to peaks in the velocity histogram. Arrow orientation (up or down) is for clarity and has no significance. Combined vertical arrows indicate multiple unitary step combinations. Numbers above the vertical arrows indicate observed steps in nm computed by multiplying the ordinate position with the step parameter, h. Smaller font step lengths below the curves are two short or one short-one medium combinations that are often not evidentially present in the experimental data. (A) Event distribution for the 0.08 μM bulk MYH7 concentration (closed squares connected by dashed line) and simulations (solid lines). Simulations include 2 (blue) or 3 (red) unitary steps. Fitting parameter h = 3.8. The fitted baseline (closed circles connected by dashed line) represents thermal/mechanical velocity fluctuation. (B and C) Same as in A except for 0.12 and 0.16 μM bulk MYH7 concentration and fitting parameter h = 3.3.
Other higher bulk MYH7 concentrations investigated produce velocity event recordings indicating diminishing unitary step-sizes for increasing bulk concentrations. Panels B and C show the actin sliding velocity event distribution from 0.12 and 0.16 μM MYH7 (solid squares) and baseline (solid circles) from thermal/mechanical fluctuations. Unitary step-size decreases by ~22% as [MYH7] increases from 0.08 to 0.16 μM. It suggests myosin compliance changes with diminished direct contact to the planar surface as myosin crowds the surface. More MYH7 compliance at higher surface density also explains the slightly diminished ensemble average velocity at higher MYH7 concentration seen in Figure 1.
Simulated velocity histograms are depicted with the solid lines in Figure 5. The 8 nm peak is near in length to the short + medium steps in combination (indicated in the smaller font below the curve) hence we used simulation to investigate the relative contributions of the combined steps and unitary 8 nm step to the 8 nm peak. Multiple step-sizes were programmed into the time×space array by assigning each actin binding event with a unitary step-size selected randomly from a weighted list. The step-size lists {3, 5, 8} nm, or, {3, 5} nm had weights and step size adjusted for best fitting. Simulations with the 2 or 3 step lists are otherwise identical. Step length/weights {3.2, 5.1, 8.2}/{1/8, 1/2, 3/8} or {3.2, 5.1}/{1/5, 4/5} provided best fits with the step list including the 8.2 nm unitary step preferred (red line). Without the 8.2 nm unitary step, best fitting causes the simulation to substantially overshoot the 3.2 and 5.1 nm peaks in the event histogram (blue line) indicating the event deficit at 8.2 nm. The peak assigned to the combined 5.1 and 8.2 steps is substantially under occupied in the blue line simulation again demonstrating the need for the unitary 8.2 nm step. Step weighting {1/8, 1/2, 3/8} indicates 5.1 nm is the major step, 8.2 nm nearly as likely, and 3.2 nm least likely. Similar simulation results were obtained for the higher [MYH7] curves with the shorter unitary steps sizes indicated. Occupation probability p ~ 0.00065 for all [MYH7] indicates the heterogeneous MYH7 coated surface scenario like that suggested for sHMM. Occupation probability is somewhat higher than sHMM consistent with a higher duty cycle.
Velocity event distributions in Figure 5 were tabulated from 2-3 slides over 2-3 days with 2 data sets from each slide and for each bulk concentration. One data set contained 200-400 consecutive frames. Approximately 400 low velocity events corresponding to 60-120 actin tracks were accumulated for each bulk concentration.
DISCUSSION
The in vitro motility assay is a versatile and ubiquitous protein assay that, at the time of its introduction, distinctively altered how we characterized motor protein functionality (30). The assay has changed format and complexity over the years and continues to play an important role in motor protein characterization for classification and elucidation of structure/function. The various myosin ATPases and in vitro motility draw a broadly based picture of motor protein behavior marking the beginning and ending of energy transduction. Our objective here was to introduce super-resolution particle tracking to the assay and develop a quick, quantitative, and cheap method to detect single myosin step-size in a low duty cycle motor. Measuring actin movement by a low duty cycle motor in a single molecule assay where one motor protein binds actin presents challenges because actomyosin will quickly dissociate and the freely moving element (myosin or actin) will diffuse away. We show that the motility assay enables modestly more actomyosin interactions that, together with the methylcellulose inhibited diffusion, keeps actin from diffusing away without causing overlapping interactions such that a single myosin step is isolated in time. Super-resolution microscopy permits quantitation of the below diffraction limit translation by a single step.
Quantized actin filament sliding velocity was detected in the in vitro motility assay years ago (7). The slow quantized velocities, attributed to single myosin interactions with the actin filament, were detected with fluorescence using a spatial localization method conceptually identical to super-resolution. Results suggested actin localization accuracy was ~14 nm and that the rabbit skeletal myosin cross-bridge step-size was 5-20 nm. Later, using a different microscope based technology, mechanical measurements detected actin binding of S1 immobilized on a spherical bead. The S1 was constrained to interact repeatedly with a single actin filament stretched between dielectric spheres held in laser traps. This setup had nanometer spatial and piconewton force resolutions and measured step size to be ~5.2 nm for rabbit skeletal S1 (29).
In this work we returned to the standard motility assay while introducing two relatively recent technical innovations. Qdot labeling of actin via a biotin-streptavidin linker introduces a photostable and very bright point source probe (31). Visualization of the actin filament labeled with the Qdot + rhodamine-phalloidin shows that the Qdot sparsely labels intact filaments that translate over surface bound sHMM. Similar average in vitro actin motility velocity for pure rhodamine-phalloidin labeled vs Qdot + rhodamine-phalloidin labeled actin shows that the Qdot does not alter motility. Qdot labeling facilitates application of the super-resolution method to spatially localize the label to below the diffraction limit. For sHMM, an EMCCD camera capturing one frame per 50 msec quantified Qdot labeled actin motility. Images analyzed with QuickPALM (26) produced Qdot localization with spatial resolution approaching 3 nm in the most favorable cases. Qdot localization data linked frame-by-frame to actin motility tracks were interpreted by velocity histograms depicting the low velocity domain where 1-4 cross-bridges produce actin translation measured as velocity by dividing distance traveled by the 50 msec frame rate. In this velocity domain, discrete peaks mark the expected velocity for a 5.2 nm step-size actomyosin interaction. We also find that the peak amplitudes are independent of myosin surface density over the coverage range caused by bulk concentrations from 0.057-0.285 μM sHMM implying that at these experimental conditions the actin filaments interact with a heterogeneous myosin coated surface that is frequently locally sparse. Actin motility simulation indicates the shape of the velocity distribution curve is determined by step-size and ton as peaks are located in multiples of the step-size divided by frame rate and the rising baseline at higher velocity is due to cross-bridge binding events that overlap in time. We found no evidence for co-operation between sHMM heads but expected this to be manifest as anomalously high amplitude peaks at velocities 2, 3, and 4 due to accelerated binding of second heads.
We also investigated the in vitro motility of cardiac myosin MYH7. This motor also moves the Qdot+rhodamine and rhodamine labeled actin with equivalent efficiency. Ensemble average motility velocity slows by a factor of 7 compared to sHMM allowing a slower frame capture rate to follow movement and longer exposure time light collection. QuickPALM produced Qdot localization with spatial resolution approaching 1 nm in the most favorable cases. The MYH7 low velocity histogram indicates three unitary step-sizes 3.2, 5.1, and 8.2 nm when [MYH7] = 0.08 μM with weighting {1/8, 1/2, 3/8} (independent of [MYH7]). Inspection of Figure 5A indicates that the relative frequencies of the 3 and 5 nm steps are very different making it unlikely that they are parts of the same longer unitary step of 8 nm. We propose that the major 5 nm step is the default step and identical to the unitary step in sHMM. The 8 nm step is somewhat less likely and possibly different from the 5 nm step by involving an extra interaction with actin via the essential light chain (ELC). The cardiac ELC is known to bind actin by a unique N-terminal extension (32, 33). Our data shows the 5 and 8 nm steps make up 7/8 of the steps in the MYH7 in vitro motility assay. The minor 3 nm step is the unlikely conversion of the 5 nm step to the full ELC bound 8 nm step. It occurs in just 1 of 8 cycles and is isolated in time from the 5 nm step by the ADP dissociation time hence we observe it as an independent step.
Figure 6 shows the proposed 3 step mechanism for MYH7 and partial elements of the time×space array used for the simulation. Slow ADP release in the majority cross-bridge is indicated for the 5 nm step cycle shown. Columns of the time×space array are indicated for each actin binding target zone shown and for 3 Δt’s. In an actual simulation, columns contain 200 elements for one Δt = 200 ms and tseg = 1 ms. For the Δt intervals indicated, we would record Qdot translation of 5, 8, and 8 nm with the first translation due to the unitary 5 nm step, the second translation the result of combined 3 and 5 nm displacements from two different cross-bridges, and the third the unitary 8 nm step of a single cross-bridge. The 3, 5, and 8 nm steps are independent in the simulation although the 3 and 5 nm steps are coupled in the mechanism proposed in Figure 6. Future work will investigate coupling between these events.
Figure 6.

The three steps of MYH7 and their representation in the time×space array used in the simulation. MYH7 cross-bridge has a motor domain, lever-arm, and two light chains ELC (blue) and RLC (orange) indicated at the top. The actin/ELC linkage, shown as a line connecting ELC with actin, modulates myosin step size. The 3 actin monomers in the target zone are shown in red. Each target zone has a column in the time×space array. The figure shows three frame capture intervals, Δt, with frame capture happening at t = t1, t2, and t3. The cross-bridge attached at the upper right performs the major 5 nm step giving the 5 nm displacement recorded at t1. Slow ADP release is indicated in the 5 nm step cycle shown. This cross-bridge remains attached into the second exposure interval when it releases ADP then converts to the 8 nm step with the ELC linkage and produces the minor 3 nm displacement. Additional displacement of 5 nm by the middle cross-bridge releases ADP without the ELC linkage in the second exposure interval giving 3+5 nm total displacement at t2 due to two different unitary steps. The third exposure interval has a unitary 8 nm displacement caused by a minor step from a single cross-bridge.
Modulating probability for short or long power-strokes would affect sliding velocity and provide a mechanism for fine tuning efficiency for a dynamic work load. For the mechanism in Figure 6, step length modulation is accomplished by guiding the ELC/actin linkage. This could involve either thick or thin filament regulation. On the thick filament, myosin RLC binds to the myosin lever-arm and stiffens its resistance to deformation (23, 34). RLC phosphorylation is known to impact the resting head posture relative to the myosin filament backbone (35) and is implicated in cardiac contractility regulation (36). RLC disease implicated mutation was suggested to affect actin binding potentially via the ELC extension (34). Cardiac myosin regulation by RLC could rest on the ability of RLC to modulate step-size in an active muscle. In experiments reported here, MYH7 was not phosphorylated (17).
Seiryo et al. compared step-size for the rat α- and β-cardiac myosins and reported a single unitary step of 8-9 nm for both isoforms (37). Palmiter et al. compared step-size for the rabbit α- and β- cardiac myosins and reported a single unitary 7.2 ± 3.1 nm step for the β isoform (38). More recent work with rabbit cardiac myosin and regulated actin reported a 7 ± 3 nm unitary displacement (39). The extent of myosin phosphorylation was not reported. These cardiac myosin unitary displacements are consistent with the 6.0 nm weighted average of our three steps. Whether our three step scenario is consistent with this earlier work needs additional investigation.
Application of super-resolution in vitro motility to disease implicated mutations in the myosin heavy and light chains in low duty cycle muscle myosin will uniquely elucidate the effect of mutation on step-size. The skeletal and cardiac myosin applications described here dramatically demonstrate the power of the technique and its ability to distinguish and quantify subtle changes in the velocity due to step-size alteration. We have demonstrated a rapid, practical, and sensitive assay for myosin step size that has already provided interesting new insights into contractility.
Supplementary Material
ACKNOWLEDGEMENTS
This work was supported by NIH grants R01AR049277 and R01HL095572 and by the Mayo Foundation. Thanks to Brian Haldeman, University of Nevada, Reno, for suggesting biotin-free BSA.
Funding: This work was supported by NIH grants R01AR049277 and R01HL095572 and by the Mayo Foundation
Footnotes
SUPPORTING INFORMATION The 20 second real time movie (17sHMM) shows Qdot+rhodamine labeled actin filaments moving over rabbit skeletal HMM immobilized on the nitrocellulose coated glass surface. Surface bound sHMM derives from 0.114 μM bulk concentration sHMM. The 80 second real time movie (419MYH7) shows Qdot+rhodamine labeled actin filaments moving over cardiac myosin immobilized on the nitrocellulose coated glass surface. Surface bound myosin derives from 0.08 μM bulk concentration MYH7. Emission is dominated by the single Qdots but the rhodamine label is also visible. Rhodamine labeling is sparse with single rhodamines on the actin sometimes recognizable. This material is available free of charge via the Internet at http://pubs.acs.org.
REFERENCES
- 1.Moore JR, Leinwand L, Warshaw DM. Understanding Cardiomyopathy Phenotypes Based on the Functional Impact of Mutations in the Myosin Motor. Circ. Res. 2012;111:375–385. doi: 10.1161/CIRCRESAHA.110.223842. [DOI] [PMC free article] [PubMed] [Google Scholar]
- 2.Tajsharghi H, Kimber E, Kroksmark AK, Jerre R, Tulinius M, Oldfors A. Embryonic Myosin Heavy-Chain Mutations Cause Distal Arthrogryposis and Developmental Myosin Myopathy That Persists Postnatally. Arch.Neurology. 2008;65:1083–1090. doi: 10.1001/archneur.65.8.1083. [DOI] [PubMed] [Google Scholar]
- 3.Rayment I, Rypniewski WR, Schmidt-Base K, Smith R, Tomchick DR, Benning MM, Winkelmann DA, Wesenberg G, Holden HM. Three-dimensional structure of myosin subfragment-1: A molecular motor. Science. 1993;261:50–58. doi: 10.1126/science.8316857. [DOI] [PubMed] [Google Scholar]
- 4.Dominguez R, Freyzon Y, Trybus KM, Cohen C. Crystal structure of a vertebrate smooth muscle myosin motor domain and its complex with the essential light chain: visualization of the pre-power stroke state. Cell. 1998;94:559–571. doi: 10.1016/s0092-8674(00)81598-6. [DOI] [PubMed] [Google Scholar]
- 5.Sherwood JJ, Waller GS, Warshaw DM, Lowey S. A point mutation in the regulatory light chain reduces the step size of skeletal muscle myosin. Proceedings of the National Academy of Sciences. 2004;101:10973–10978. doi: 10.1073/pnas.0401699101. [DOI] [PMC free article] [PubMed] [Google Scholar]
- 6.Burghardt TP, Josephson MP, Ajtai K. Single myosin cross-bridge orientation in cardiac papillary muscle detects lever-arm shear strain in transduction. Biochemistry. 2011;50:7809–7821. doi: 10.1021/bi2008992. [DOI] [PMC free article] [PubMed] [Google Scholar]
- 7.Uyeda TQP, Warrick HM, Kron SJ, Spudich JA. Quantized velocities at low myosin densities in an in vitro motility assay. Nature. 1991;352:307–311. doi: 10.1038/352307a0. [DOI] [PubMed] [Google Scholar]
- 8.O’Connell CB, Tyska MJ, Mooseker MS. Myosin at work: Motor adaptations for a variety of cellular functions. Biochimica Biophysica Acta. 2007;1773:615–630. doi: 10.1016/j.bbamcr.2006.06.012. [DOI] [PubMed] [Google Scholar]
- 9.Betzig E, Patterson GH, Sougrat R, Lindwasser OW, Olenych S, Bonifacino JS, Davidson MW, Lippincott-Schwartz J, Hess HF. Imaging intracellular fluorescent proteins at nanometer resolution. Science. 2006;313:1642–1645. doi: 10.1126/science.1127344. [DOI] [PubMed] [Google Scholar]
- 10.Rust MJ, Bates M, Zhuang X. Sub-diffraction-limit imaging by stochastic optical reconstruction microscopy (STORM) Nature Methods. 2006;3:793–795. doi: 10.1038/nmeth929. [DOI] [PMC free article] [PubMed] [Google Scholar]
- 11.Bobroff N. Position measurement with a resolution and noise-limited instrument. Rev. Sci. Instrum. 1986;57:1152–1157. [Google Scholar]
- 12.Thompson RE, Larson DR, Webb WW. Precise nanometer localization analysis for individual fluorescent probes. Biophys. J. 2002;82:2775–2783. doi: 10.1016/S0006-3495(02)75618-X. [DOI] [PMC free article] [PubMed] [Google Scholar]
- 13.Pertsinidis A, Zhang Y, Chu S. Subnanometre single-molecule localization, registration and distance measurements. Nature. 2010;466:647–651. doi: 10.1038/nature09163. [DOI] [PubMed] [Google Scholar]
- 14.Tonomura Y, Appel P, Morales M. On the molecular weight of myosin II. Biochemistry. 1966;5:515–521. doi: 10.1021/bi00866a017. [DOI] [PubMed] [Google Scholar]
- 15.Weeds AG, Taylor RS. Separation of subfragment-1 isoenzymes from rabbit skeletal muscle myosin. Nature. 1975;257:54–56. doi: 10.1038/257054a0. [DOI] [PubMed] [Google Scholar]
- 16.Ajtai K, Garamszegi SP, Park S, Velazquez Dones AL, Burghardt TP. Structural characterization of β-cardiac myosin subfragment 1 in solution. Biochemistry. 2001;40:12078–12093. doi: 10.1021/bi0112098. [DOI] [PubMed] [Google Scholar]
- 17.Josephson MP, Sikkink LA, Penheiter AR, Burghardt TP, Ajtai K. Smooth muscle myosin light chain kinase efficiently phosphorylates serine 15 of cardiac myosin regulatory light chain. Biochem. Biophys. Res. Commun. 2011;416:367–371. doi: 10.1016/j.bbrc.2011.11.044. [DOI] [PMC free article] [PubMed] [Google Scholar]
- 18.Pardee JD, Spudich JA. Purification of muscle actin. Methods Enzymol. 1982;85:164–179. doi: 10.1016/0076-6879(82)85020-9. [DOI] [PubMed] [Google Scholar]
- 19.Kron SJ, Toyoshima YY, Uyeda TQP, Spudich JA. Assays for actin sliding movement over myosin-coated surfaces. Methods Enzymol. 1991;196:399–416. doi: 10.1016/0076-6879(91)96035-p. [DOI] [PubMed] [Google Scholar]
- 20.Trybus KM. Biochemical studies of myosin. Methods (Duluth) 2000;22:327–335. doi: 10.1006/meth.2000.1085. [DOI] [PubMed] [Google Scholar]
- 21.Månsson A, Sundberg M, Balaz M, Bunk R, Nicholls IA, Omling P, Tågerud S, Montelius L. In vitro sliding of actin filaments labelled with single quantum dots. Biochem. Biophys. Res. Commun. 2004;314:529–534. doi: 10.1016/j.bbrc.2003.12.133. [DOI] [PubMed] [Google Scholar]
- 22.Pant K, Watt J, Greenberg M, Jones M, Szczesna-Cordary D, Moore JR. Removal of the cardiac myosin regulatory light chain increases isometric force production. The FASEB Journal. 2009;23:3571–3580. doi: 10.1096/fj.08-126672. [DOI] [PMC free article] [PubMed] [Google Scholar]
- 23.Greenberg MJ, Watt JD, Jones M, Kazmierczak K, Szczesna-Cordary D, Moore JR. Regulatory light chain mutations associated with cardiomyopathy affect myosin mechanics and kinetics. J. Mol. Cell. Cardiol. 2009;46:108–115. doi: 10.1016/j.yjmcc.2008.09.126. [DOI] [PMC free article] [PubMed] [Google Scholar]
- 24.Stout AL, Axelrod D. Evanescent field excitation of fluorescence by epi-illumination microscopy. Applied Optics. 1989;28:5237–5242. doi: 10.1364/AO.28.005237. [DOI] [PubMed] [Google Scholar]
- 25.Meijering E, Dzyubachyk O, Smal I. Chapter nine - Methods for Cell and Particle Tracking. In: conn PM, editor. Methods Enzymol. Academic Press; 2012. pp. 183–200. [DOI] [PubMed] [Google Scholar]
- 26.Henriques R, Lelek M, Fornasiero EF, Valtorta F, Zimmer C, Mhlanga MM. QuickPALM: 3D real-time photoactivation nanoscopy image processing in ImageJ. Nature Methods. 2010;7:339–340. doi: 10.1038/nmeth0510-339. [DOI] [PubMed] [Google Scholar]
- 27.Uyeda TQP, Kron SJ, Spudich JA. Myosin step size: Estimation from slow sliding movement of actin over low densities of heavy meromyosin. J. Mol. Biol. 1990;214:699–710. doi: 10.1016/0022-2836(90)90287-V. [DOI] [PubMed] [Google Scholar]
- 28.Muhlrad A, Peyser YM, Nili M, Ajtai K, Reisler E, Burghardt TP. Chemical decoupling of ATPase activation and force production from the contractile cycle in myosin by steric hindrance of lever arm movement. Biophys. J. 2003;84:1047–1056. doi: 10.1016/S0006-3495(03)74921-2. [DOI] [PMC free article] [PubMed] [Google Scholar]
- 29.Steffen W, Smith D, Simmons R, Sleep J. Mapping the actin filament with myosin. Proc. Nat. Acad. Sci. USA. 2001;98:14949–14954. doi: 10.1073/pnas.261560698. [DOI] [PMC free article] [PubMed] [Google Scholar]
- 30.Sheetz MP, Spudich JA. Movement of myosin-coated fluorescent beads on actin cables in vitro. Nature. 1983;303:31–35. doi: 10.1038/303031a0. [DOI] [PubMed] [Google Scholar]
- 31.Medintz IL, Uyeda HT, Goldman ER, Mattoussi H. Quantum dot bioconjugates for imaging, labelling and sensing. Nat Mater. 2005;4:435–446. doi: 10.1038/nmat1390. [DOI] [PubMed] [Google Scholar]
- 32.Miyanishi T, Ishikawa T, Hayashibara T, Maita T, Wakabayashi T. The two actin-binding regions on the myosin heads of cardiac muscle. Biochemistry. 2002;41:5429–5438. doi: 10.1021/bi0118355. [DOI] [PubMed] [Google Scholar]
- 33.Schaub MC, Hefti MA, Zuellig RA, Morano I. Modulation of contractility in human cardiac hypertrophy by myosin essential light chain isoforms. Cardiovasc. Res. 1998;37:381–404. doi: 10.1016/s0008-6363(97)00258-7. [DOI] [PubMed] [Google Scholar]
- 34.Burghardt TP, Sikkink LA. Regulatory Light Chain Mutants Linked to Heart Disease Modify the Cardiac Myosin Lever-Arm. 2012 doi: 10.1021/bi301500d. in press. [DOI] [PMC free article] [PubMed] [Google Scholar]
- 35.Sheikh F, Ouyang K, Campbell SG, Lyon RC, Chuang J, Fitzsimons D, Tangney J, Hidalgo CG, Chung CS, Cheng H, Dalton ND, Gu Y, Kasahara H, Ghassemian M, Omens JH, Peterson KL, Granzier HL, Moss RL, McCulloch AD, Chen J. Mouse and computational models link Mlc2v dephosphorylation to altered myosin kinetics in early cardiac disease. J. Clin. Invest. 2012;122:1209–1221. doi: 10.1172/JCI61134. [DOI] [PMC free article] [PubMed] [Google Scholar]
- 36.Scruggs SB, Solaro RJ. The signficiance of regulatory light chain phosphorylation in cardiac physiology. Arch. Biochem. Biophys. 2011;510:129–134. doi: 10.1016/j.abb.2011.02.013. [DOI] [PMC free article] [PubMed] [Google Scholar]
- 37.Sugiura S, Kobayakawa N, Fujita H, Yamashita H, Momomura S.-i., Chaen S, Omata M, Sugi H. Comparison of Unitary Displacements and Forces Between 2 Cardiac Myosin Isoforms by the Optical Trap Technique: Molecular Basis for Cardiac Adaptation. Circ. Res. 1998;82:1029–1034. doi: 10.1161/01.res.82.10.1029. [DOI] [PubMed] [Google Scholar]
- 38.Palmiter KA, Tyska MJ, Dupuis DE, Alpert NR, Warshaw DM. Kinetic differences at the single molecule level account for the functional diversity of rabbit cardiac myosin isoforms. The Journal of Physiology. 1999;519:669–678. doi: 10.1111/j.1469-7793.1999.0669n.x. [DOI] [PMC free article] [PubMed] [Google Scholar]
- 39.Debold EP, Saber W, Cheema Y, Bookwalter CS, Trybus KM, Warshaw DM, VanBuren P. Human actin mutations associated with hypertrophic and dilated cardiomyopathies demonstrate distinct thin filament regulatory properties in vitro. J. Mol. Cell. Cardiol. 2010;48:286–292. doi: 10.1016/j.yjmcc.2009.09.014. [DOI] [PMC free article] [PubMed] [Google Scholar]
Associated Data
This section collects any data citations, data availability statements, or supplementary materials included in this article.