

Abstract
Objectives
The goal of these studies was to determine the association between cardiovascular autonomic neuropathy (CAN) and indices of left ventricle (LV) structure and function in patients with type 1 diabetes (T1DM) in the DCCT/EDIC (Diabetes Control and Complications Trial/Epidemiology of Diabetes Interventions and Complications) study.
Background
The pathophysiology of LV dysfunction in T1DM remains unclear, especially when the LV ejection fraction (EF) is preserved. Whether CAN is associated with LV dysfunction is unclear.
Methods
Indices of LV structure and function were obtained by cardiac magnetic resonance imaging (CMRI). CAN was assessed by cardiovascular reflex testing (R-R response to paced breathing, Valsalva ratio, and blood pressure response to standing). Analyses were performed in 966 DCCT/EDIC participants with valid CMRI and CAN data (mean age 51 years, 52% men, mean diabetes duration 29 years, and mean glycosylated hemoglobin 7.9%).
Results
Systolic function (EF, end-systolic and end-diastolic volumes, stroke volumes) was not different in 371 subjects with CAN compared with 595 subjects without CAN. In multiple-adjusted analyses, participants with either abnormal R-R variation or a composite of abnormal R-R variation, abnormal Valsalva ratio, and postural blood pressure changes had significantly higher LV mass, mass-to-volume-ratio, and cardiac output compared with those with normal tests (p < 0.0001 for all). After further adjustment for traditional cardiovascular risk factors, subjects with abnormal R-R variation had higher LV mass and cardiac output compared with those with a normal R-R variation (p < 0.05).
Conclusions
In this large cohort of patients with T1DM, CAN is associated with increased LV mass and concentric remodeling as assessed by CMRI independent of age, sex, and other factors. (Diabetes Control and Complications Trial [DCCT];NCT00360815) (Epidemiology of Diabetes Interventions and Complications [EDIC]; NCT00360893)
Keywords: cardiovascular autonomic neuropathy, left ventricle hypertrophy, myocardial dysfunction, type 1 diabetes
Cardiovascular disease (CVD) is a major cause of mortality among patients with type 1 diabetes (T1DM). In T1DM, left ventricular (LV) dysfunction may precede or occur in the absence of coronary artery disease or hypertension, often seen in the setting of a normal ejection fraction (EF) (1–4), and its pathophysiology remains unclear. Diastolic dysfunction, characterized by impairment in LV relaxation and passive filling, was reported as the earliest manifestation of diabetic cardiomyopathy (2,5). Our group has found that diastolic dysfunction detected early in the course of T1DM is correlated with abnormal cardiac sympathetic function as assessed by cardiac sympathetic imaging (4). Cardiovascular autonomic neuropathy (CAN) complicates T1DM and is an independent predictor of mortality in affected patients (6–8). Despite the frequent co-occurrence of these cardiac complications (4), whether there is a relationship between CAN and LV dysfunction in T1DM has not been clearly determined.
The development and progression of CVD and CAN in patients with T1DM has been a focus of the DCCT (Diabetes Control and Complications Trial)/EDIC (Epidemiology of Diabetes Interventions and Complications) study since its inception (9), and many factors associated with the risk of cardiovascular events in T1DM have been examined in EDIC prospectively (9).
In addition, DCCT/EDIC was the first large study to use cardiac magnetic resonance imaging (CMRI) to assess myocardial structure and function in patients with T1DM, the reference standard for assessment of LV structure and function (10). The most recent CAN evaluations were obtained during DCCT/EDIC years 13 to 14 and 16 to 17, and CMRI evaluations were obtained during DCCT/EDIC years 14 to 16. These evaluations provided us with a unique opportunity to explore the relationship between CAN and LV structure and function in this well-characterized cohort of patients and to gain new insights into the mechanisms underlying myocardial dysfunction in T1DM.
Methods
Subjects
DCCT and EDIC have been described elsewhere (11–13). Briefly, 1,441 subjects with T1DM for 1 to 15 years with no (primary prevention cohort) or minimal (secondary intervention cohort) diabetic retinopathy were enrolled in DCCT. Subjects were randomly assigned to either intensive or conventional treatment and were followed for 3 to 9 years (mean 6.5 years) (12). At the end of DCCT, intensive therapy was recommended for all subjects, subjects in the conventional treatment group were trained in intensive therapy, and all subjects returned to their own healthcare providers for diabetes care. Annual EDIC examinations began in 1994, 1 year after completion of the DCCT, and 1,375 (96%) of former DCCT subjects consented to participate in EDIC. A detailed description of EDIC study procedures and baseline characteristics has been published (11). During EDIC, clinical and biochemical endpoints were obtained annually by history, physical examination, and laboratory testing (13). Glycosylated hemoglobin (HbA1c) and blood pressure (BP) were measured annually, and lipid profiles and urinary albumin excretion rates (AER) were obtained on alternate years. DCCT/EDIC procedures were approved by institutional review boards of all participating centers. Written informed consent was provided by all participants.
CMRI with contrast (gadolinium) was performed during EDIC years 14 to 16, and CAN evaluations were performed during EDIC years 13 to 14 and again during years 16 to 17. Among the surviving EDIC cohort at year 14, 1,259 with no gadolinium contraindications were eligible for CMRI, and 1,122 (89%) consented to the procedure (Fig. 1). Ninety-four subjects were excluded because of contraindications to the examination (e.g., claustrophobia, metal in the orbit), and 11 subjects had CMRI examinations of insufficient quality for analysis, yielding a completion rate of 81% (1,017 of 1,259).
Figure 1. Flow Diagram of DCCT/EDIC Participation in CAN and CMRI Evaluations.
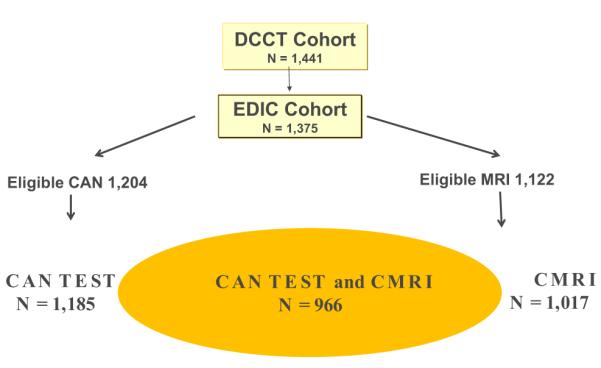
CAN = cardiovascular autonomic neuropathy; CMRI = cardiac magnetic resonance imaging; DCCT = Diabetes Control and Complications Trial; EDIC = Epidemiology of Diabetes Interventions and Complications; MRI = magnetic resonance imaging.
CAN testing was performed in 1,226 subjects during years 13 to 14 and in 1,185 subjects during years 16 to 17 of EDIC. Subjects who experienced hypoglycemia after midnight (blood glucose ≤50 mg/dl or signs/symptoms of hypoglycemia [n = 4]) and subjects with acute illnesses 48 h before testing (n = 1) were excluded from CAN testing. Subjects with proliferative retinopathy, recent history of laser therapy or vitrectomy, and/or no eye examination in the last 4 years (n = 34) and those who could not perform the required forced expiration (n = 25) were excluded from the Valsalva maneuver (Fig. 1).
CMRI Protocol
Among 25 scanning centers, 11 centers used Siemens 1.5-T magnetic resonance imaging (MRI) scanners (Siemens, Munich, Germany), 10 used General Electric scanners (GE Healthcare, Chalfont St Giles, United Kingdom), and 4 used Philips MRI scanners (Philips Medical Systems, Best, the Netherlands). CMRI examinations included short- and long-axis cine images for LV function, myocardial tagging for regional function, and delayed gadolinium images for myocardial scar. The protocol used localizing images, followed by horizontal and vertical long-axis cine images obtained using an electrocardiogram-gated steady-state free precession (SSFP) pulse sequence with temporal resolution ≤50 ms, spatial resolution <1.4 × 1.8 × 8 mm, and 2-mm gap between short-axis slices. Short-axis cine SSFP images were obtained beginning 1 cm above the mitral valve plane and extending to the apex of the LV. The temporal resolution for all SSFP cine images was ≤50 ms with 30 reconstructed cine phases. All images were obtained during breath holding at resting lung volume.
CMRI studies were read at the Johns Hopkins Hospital by readers masked to all clinical and laboratory data. Short-axis cine images were analyzed using QMASS software (version 6.0, Medis, the Netherlands). LV contours were checked by a senior cardiac trained MR physician with 15 years’ experience. The endocardial and epicardial borders of the LV were outlined at end-diastole and end-systole on short-axis cine images. The papillary muscles were included in the left ventricular end-diastolic volume (LVEDV) and left ventricular end-systolic volume (LVESV), and excluded from the LV mass. Re-reads of LV mass and volumes were performed for 100 randomly selected studies to calculate intraclass correlations. The quality of each series of the CMRI exams was subjectively scored by the reading center as 0 to 2, with 0 indicating nondiagnostic, 1 acceptable, and 2 good quality. An overall examination quality score was given by averaging the scores of the individual series. The mean quality score was 1.8 ± 0.2.
LVEDV and LVESV were calculated using Simpson’s rule (summation of areas on each separate slice multiplied by the sum of slice thickness and image gap). LV mass was determined by the sum of the myocardial areas (the difference between endo- and epicardial contours) multiplied by slice thickness plus image gap in the end-diastolic phase multiplied by the specific gravity of myocardium (1.05 g/ml). Left ventricular stroke volume (LVSV) was calculated as the difference between LVEDV and LVESV. LV EF was calculated as LVSV divided by LVEDV multiplied by 100 (percent). The mass-to-volume ratio was calculated as LVDM divided by LVEDV. Cardiac output was calculated as LVSV multiplied by the heart rate.
Assessment of CAN
Standardized CAN evaluations (R-R response to paced breathing [R-R variation], Valsalva maneuver, and postural changes in BP) were performed as described (14,15) (Fig. 2). Before CAN testing, all subjects were asked to fast, avoid caffeine and tobacco products for 8 h before the test, and hold all prescription and over-the-counter medicines (except for basal insulin) until testing was completed (14,15). CAN testing was performed with Hokanson ANS2000 devices (Hokanson, Bellevue, Washington), and results were analyzed at a single reading center. All CAN measurements were reviewed by a single masked investigator (P.A.L.), who determined whether the technical quality of the recording and conditions of the test met study criteria. Intrasubject reproducibility of the CAN tests was evaluated using same-day, test–retest on a random subset of 185 subjects across EDIC sites, and revealed high test–retest correlations for R-R variation and Valsalva (kappa = 0.7766 and 0.8034, respectively, p < 0.0001 for both).
Figure 2. Flow Diagram of CAN Testing.
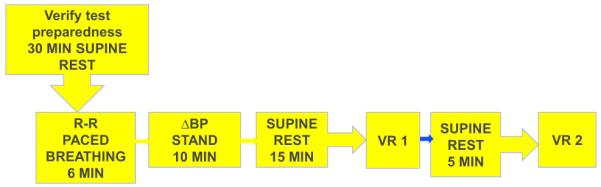
BP = blood pressure; VR = Valsalva ratio.
CAN was defined as either an R-R variation <15 (abnormal R-R) or a composite CAN index that included R-R variation <20 plus Valsalva ratio <1.5 or a decrease of >10 mm Hg in diastolic blood pressure (DBP) upon standing (CAN+) (DCCT original definition) (14,16).
Statistical analyses
Data entry, management, and analyses were performed at the DCCT/EDIC Data Coordinating Center using SAS version 9.2 statistical analysis software (Cary, North Carolina).
Demographic and clinical characteristics were compared using the Wilcoxon rank sum test to evaluate group differences (normal vs. abnormal CAN) for ordinal and numeric variables. The contingency chi-square test was used for categorical variables.
Separate multivariate linear regression models were used to calculate the least square means of LV function after adjusting for age, sex, DCCT cohort assignment (primary/secondary), and machine type. Means and standard errors were compared for subjects with normal versus abnormal R-R variation or CAN. Additional models adjusted for height, weight, smoking, alcohol use, systolic blood pressure (SBP), high-density lipoprotein (HDL) cholesterol, low-density lipoprotein (LDL) cholesterol, and HbA1c. Cardiac output models were further adjusted for resting heart rate.
Regression estimates and standard errors present the change in LV function per unit change in the independent variable of interest. The proportion of variability explained in the reduced model with only the CVD risk factors as predictors was compared with the proportion of variability in the full model with all CVD risk factors, height, weight, and either abnormal R-R or composite CAN.
SBP, HDL cholesterol, LDL cholesterol, and HbA1c were included in the analyses as time-weighted mean values calculated over the entire DCCT/EDIC study period up until the year 16 to 17 CAN evaluation.
Results
A description of CMRI measurements in EDIC participants and their relationship to CVD risk factors has been published (17). This analysis included 966 T1DM subjects with concomitant CMRI and CAN measurements. The demographic and clinical characteristics of this middle-age cohort (mean age 51 ± 7 years, 52% males) are shown in Table 1. Hypertension (defined as SBP ≥140 mm Hg/or DBP ≥90 mm Hg or use of antihypertensive agents) was present in 64% of subjects, smoking was reported by 11%, mean LDL cholesterol was 108 ± 20 mg/dl. Nonparticipants, including those who died, did not differ from participants in most characteristics (Online Table 1).
Table 1.
Characteristics of Participants With Concomitant CAN Measurements and CMRI Measurements (N = 966)
| Characteristic | Normal CAN Measures (n = 595) |
Abnormal CAN Measures (n = 371) |
|---|---|---|
| Female | 277 (47) | 183 (49) |
| Primary prevention cohort | 322 (54) | 154 (42)* |
| Age, yrs | 49.3 ± 6.6 | 52.5 ± 6.6* |
| Age at diagnosis, yrs | 20.3 ± 7.9 | 22.1 ± 7.9* |
| Body mass index, kg/m2 | 28.1 ± 4.7 | 28.5 ± 5.0 |
| Diabetes duration, yrs | 28.7 ± 4.9 | 30.1 ± 4.8* |
| HbA1c, % | 7.7 ± 1.1 | 8.1 ± 1.3* |
| Height, cm | 171.9 ± 9.5 | 172.0 ± 9.8 |
| Weight, kg | 83.4 ± 16.5 | 84.5 ± 17.4 |
| Current cigarette smoker | 45 (8) | 57 (15)* |
| Current alcohol use | 284 (48) | 159 (43) |
| Log(AER) | 2.5 ± 1.1 | 3.0 ± 1.5* |
| GFR CKD-EPI definition, ml/min/1.73 m2 | 96.6 ± 14.2 | 87.2 ± 23.8* |
| Heart rate | 66 ± 10 | 72 ± 12* |
| Treated hypertension† | 327 (55) | 284 (78)* |
| Treated hypercholesterolemia‡ | 366 (62) | 276 (75)* |
| Beta-blocker use | 29 (5) | 66 (18)* |
| Any ACEi or ARB use | 301 (51) | 250 (68)* |
| DCCT/EDIC time-weighted variables | ||
| HbA1c, % | 7.7 ± 0.8 | 8.3 ± 1.0* |
| HDL cholesterol, mg/dl | 56 ± 13 | 55 ± 13 |
| LDL cholesterol, mg/dl | 106 ± 20 | 112 ± 20* |
| Triglycerides, mg/dl | 78 ± 36 | 90 ± 44* |
| Systolic blood pressure, mm Hg | 117 ± 8 | 121 ± 8* |
| Diastolic blood pressure, mm Hg | 74 ± 5 | 75 ± 6* |
Values are n (%) or mean ± SD.
p < 0.01
Hypertension is defined as systolic blood pressure ≥140 mm Hg, diastolic blood pressure ≥90 mm Hg, documented hypertension, or the use of antihypertensive agents for the treatment of hypertension.
Hypercholesterolemia is defined as LDL cholesterol ≥130 mg/dl or the use of lipid-lowering agents.
ACEi = angiotensin-converting enzyme inhibitor; AER = albumin excretion rate; ARB = angiotensin receptor blocker; CAN = cardiac autonomic neuropathy; CKD-EPI = Chronic Kidney Disease Epidemiology Collaboration; CMRI = cardiac magnetic resonance imaging; DCCT/EDIC = Diabetes Control and Complications Trial/Epidemiology of Diabetes Interventions and Complications; GFR = glomerular filtration rate; HbA1c = glycosylated hemoglobin; HDL = high-density lipoprotein; LDL = low-density lipoprotein.
There were 371 subjects with CAN+ and 315 subjects with abnormal R-R variation only. As shown in Table 1, CAN+ and abnormal R-R subjects were more likely to be older, in the secondary prevention cohort, have longer diabetes duration, and have higher HbA1c, albumin excretion rate (AER), SBP, LDL cholesterol levels, and resting heart rate.
The association between indices of CAN (CAN+ and abnormal R-R variation) and CMRI indices are shown in Table 2. In a model adjusted for age, sex, cohort assignment (primary/secondary), and machine type, cardiac parameters of systolic function (EF, LVESV, LVEDV, and stroke volume) were not different in subjects with CAN compared with subjects without CAN. However, CAN+ subjects or those with abnormal R-R variation had higher LV mass and mass-to-volume-ratios compared with subjects without CAN (p < 0.0001 for all), changes consistent with LV concentric remodeling (Table 2). Subjects with abnormal R-R variation and CAN+ subjects also had significantly higher cardiac output (p < 0.0001). To evaluate whether CAN is an independent risk factor for the changes in LV mass and geometry, the model included the weighted mean HbA1c during DCCT/EDIC, and other covariates (height, weight, current smoking, current alcohol use, mean SBP, mean HDL, and mean LDL) previously shown (17) to be associated with CMRI-derived measures of LV structure in the EDIC participants. In this multivariate analysis, subjects with abnormal R-R variation had significantly higher LV mass and cardiac output compared with those with normal R-R (Table 3). Cardiac output remained significantly higher in subjects with an abnormal R-R variation and CAN+ after adjusting for resting heart rate (p = 0.003 and p = 0.01, respectively; data not shown). The associations between CAN+ and LV mass and mass-to-volume ratio were no longer significant. The effects of CAN on LV function were not different in men versus women.
Table 2.
Minimally Adjusted Association Between Indices of LV Function and R-R Variation or CAN at EDIC Year 16/17
| Cardiac Function | Normal R-R (n = 649) |
Abnormal R-R (n = 315) |
p Value | CAN– (n = 595) |
CAN+ (n = 371) |
p Value |
|---|---|---|---|---|---|---|
| End-diastolic volume, ml | 135.6 ± 1.1 | 136.3 ± 1.5 | 0.6895 | 135.7 ± 1.1 | 135.9 ± 1.4 | 0.9121 |
| End-systolic volume, ml | 52.5 ± 0.6 | 52.6 ± 0.9 | 0.9095 | 52.7 ± 0.6 | 52.3 ± | 0.8 0.6848 |
| Stroke volume, ml | 83.1 ± 0.7 | 83.7 ± 1.0 | 0.6057 | 83.0 ± 0.7 | 83.6 ± 0.9 | 0.5920 |
| Ejection fraction, % | 61.6 ± 0.3 | 61.9 ± 0.4 | 0.4477 | 61.5 ± 0.3 | 62.0 ± 0.3 | 0.2324 |
| Cardiac output, l/min | 5.7 ± 0.1 | 6.2 ± 0.1 | <0.0001 | 5.7 ± 0.1 | 6.1 ± 0.1 | <0.0001 |
| LV mass, gm | 134.6 ± 1.0 | 142.4 ± 1.5 | <0.0001 | 134.4 ± 1.1 | 141.4 ± 1.4 | <0.0001 |
| Mass-to-volume ratio, gm/ml | 1.00 ± 0.01 | 1.06 ± 0.01 | <0.0001 | 1.00 ± 0.01 | 1.05 ± 0.01 | <0.0001 |
Values are least square mean ± SE, adjusted for concurrent age, sex, cohort assignment (primary/secondary), and machine type. CAN+ included R-R variation <20 plus Valsalva ratio ≤1.5 or a decrease of >10 mm Hg in DBP upon standing as defined in Methods.
DBP = diastolic blood pressure; LV = left ventricular; other abbreviations as in Table 1.
Table 3.
Association Between Indices of LV function and R-R Variation or CAN at EDIC Year 16 to 17 After Adjustment for Traditional Cardiac Risk Factors and Glycemia
| Cardiac Function | Normal R-R (n = 649) |
Abnormal R-R (n = 315) |
p Value | CAN– (n = 595) |
CAN+ (n = 371) |
p Value |
|---|---|---|---|---|---|---|
| End-diastolic volume, ml | 135.9 ± 1.4 | 137.7 ± 1.6 | 0.2866 | 136.3 ± 1.4 | 136.8 ± 1.5 | 0.7277 |
| End-systolic volume, ml | 52.9 ± 0.9 | 53.2 ± 1.0 | 0.7922 | 53.3 ± 0.9 | 52.7 ± 1.0 | 0.5856 |
| Stroke volume, ml | 82.9 ± 0.9 | 84.4 ± 1.0 | 0.1662 | 83.0 ± 0.9 | 84.1 ± 1.0 | 0.2858 |
| Ejection fraction, % | 61.5 ± 0.4 | 61.9 ± 0.4 | 0.3656 | 61.4 ± 0.4 | 62.0 ± 0.4 | 0.1652 |
| Cardiac output, l/min | 5.8 ± 0.1 | 6.2 ± 0.1 | <0.0001 | 5.8 ± 0.1 | 6.1 ± 0.1 | 0.0003 |
| LV mass, gm | 140.3 ± 1.3 | 143.6 ± 1.5 | 0.0352 | 140.7 ± 1.3 | 142.6 ± 1.4 | 0.2155 |
| Mass-to-volume ratio, gm/ml | 1.04 ± 0.01 | 1.06 ± 0.01 | 0.2490 | 1.04 ± 0.01 | 1.05 ± 0.01 | 0.3499 |
Values are least square mean ± SE, adjusted for concurrent age, sex, cohort assignment (primary/secondary), machine type, height, weight, current smoking, current alcohol use, mean SBP, mean HDL, mean LDL, and mean HbA1c. CAN+ included RR variation <20 plus Valsalva ratio <1.5 or a decrease of >10 mm Hg in DBP upon standing as defined in Methods.
To better understand these findings, we performed multivariable analysis to evaluate the proportion of variability explained by CVD risk factors and to define how the addition of CAN measures into the model affects the change in risk for the CMRI indices of LV structure and function. Table 4 shows the proportion of variability associated with 9 CVD factors on those CMRI indices that were different in participants with CAN compared with participants without CAN, and the effect of the R-R variation on the absolute change in R2. The full model also adjusted for height and weight.
Table 4.
Multivariable Analysis of R-R Variation and CVD Risk Factors in Relation to LV Function
| Cardiac Function | Cardiac Output (l/min) | LV Mass (g) | Mass-to-Volume Ratio (g/ml) |
|---|---|---|---|
| CVD risk factor | |||
| Age, yrs | −0.03 (0.01)* | −0.42 (0.11)* | −0.0002 (0.001) |
| Sex, female vs. male | −0.17 (0.12) | −22.53 (2.12)* | −0.08 (0.02)* |
| Cohort, prim vs. scnd | 0.19 (0.08)† | 4.24 (1.38)* | −0.01 (0.01) |
| Smoking, yes vs. no | 0.13 (0.12) | 8.17 (2.23)* | 0.07 (0.02)* |
| Alcohol use, yes vs. no | 0.15 (0.08)† | 1.60 (1.39) | −0.02 (0.01) |
| Mean SBP, mm Hg | 0.03 (0.01)* | 0.99 (0.10)* | 0.01 (0.001)* |
| Mean HDL, mg/dl | 0.004 (0.003) | 0.02 (0.06) | −0.001 (0.0004) |
| Mean LDL, mg/dl | −0.003 (0.002) | −0.06 (0.04) | 0.0003 (0.0003) |
| Mean HbA1c, % | 0.03 (0.04) | 0.36 (0.80) | 0.02 (0.01)* |
| Proportion of variability (R2) explained by CVD risk factors‡ | 21.8% | 53.1% | 20.7% |
| CAN risk factor | |||
| Abnormal R-R, yes vs. no | 0.34 (0.09)* | 3.34 (1.58)† | 0.01 (0.01) |
| Proportion of variability (R2) explained by CVD risk factors and abnormal R-R§ |
33.2% | 61.6% | 21.8% |
| Increase in R2∥ | 11.4% | 8.5% | 1.1% |
Values are estimates (standard error) from full model.
p < 0.01
p < 0.05.
Reduced model includes all CVD risk factors in the first column as well as machine type.
§Full model includes R-R variation and is adjusted for all CVD risk factors in the first column, as well as height, weight, and machine type.
Absolute difference in proportion of variability from reduced model (only CVD risk factors) to full model (CVD risk factors + abnormal R-R).
Adding R-R variation improved the performance of the model for all indices of LV structure and function. R2 increased by 11.4% for cardiac output, and 8.5% for LV mass. Similar results were observed with the composite CAN (not shown). Before adding R-R variation into the model, mean SBP, mean HbA1c, and smoking accounted for most of the 20% variability in the LV mass-to-volume ratio. Abnormal R-R variation was associated with an ~3.3-g higher LV mass compared with normal R-R, which was higher than the LV mass change observed with the increase per mean unit SBP. To account for the possible impact of drugs used as part of the standard of care in T1DM on CVD risk factors, we added beta-blocker and angiotensin-converting enzyme inhibitor (ACEi)/angiotensin receptor blockers (ARBs) use to these models and found no significant effects (Online Table 2). Similarly, we found no significant interactions between diabetes duration and age on the relationship between CAN/R-R variability and CMRI findings.
Discussion
This study examined the association between CAN and indices of LV structure and function as assessed by CMRI in patients with T1DM. No significant differences in EF and other indices of LV function were observed between participants with and without CAN. However, the presence of CAN was associated with higher LV mass and structural changes, suggesting concentric remodeling. Measures of CAN were also associated with higher cardiac output.
Several studies (1,2,4,5,18) have reported that myocardial dysfunction may occur in the absence of coronary artery disease among patients with T1DM. Alterations of diastolic (2,4,5) and systolic (19) function are reported in otherwise healthy diabetic subjects, and often predate the development of macrovascular complications. This could suggest either direct metabolic effects on the heart, the contribution of microvascular disease (20), or the effects of other factors, including CAN. In prior smaller studies, we and others have found associations between CAN and diastolic dysfunction in patients with T1DM (2,4,5,21). Sacre et al. (3) reported that in patients with T2DM, measures of both systolic and diastolic function were associated with measures of CAN. In a more recent study, Dinh et al. (22) found that among subjects with T2DM or impaired glucose tolerance referred for elective coronary angiography, subjects with CAN had a higher prevalence and a more severe form of LV diastolic dysfunction, independent of the presence of coronary artery disease or other covariates.
Diastolic dysfunction, characterized by impairment in LV relaxation and passive filling, is considered to be the earliest manifestation of diabetic cardiomyopathy (2,5). Although direct indices of diastolic function were not available for this analysis, our data demonstrate that abnormalities in R-R variation, arguably the most sensitive index of cardiovascular autonomic dysfunction, and the composite index of CAN were strongly associated with an increased LV mass and evidence of concentric hypertrophy in subjects with normal EF. The pattern of LV concentric remodeling (23,24) was shown to carry an increased risk for CVD events (25), independent of LV hypertrophy (24).
Increased LV wall thickness and LV hypertrophy are described as causes of diastolic dysfunction and are, in general, due to myocardial structural changes, including altered or increased extracellular matrix collagen content and post-translational modification of structural cardiomyocyte proteins (26).
Excessive sympathetic activation, which is described in the early stages of CAN in diabetes due to an initial predominant parasympathetic denervation (7,27), may also promote LV hypertrophy through its impact on sympathovagal balance and baroreflexes. The cardiovascular reflex tests used to assess CAN in this study are essentially measures of cardiovagal function, and some have argued that impaired heart rate variability as measured by time- and-frequency domain indices may be more sensitive. However, studies that assessed the diagnostic accuracy against the reference standard of cardiovascular reflex tests found only fair agreement (28).The vagal component of the baroreflex is a major protective mechanism that adjusts heart rate, stroke volume, and BP to minimize myocardial stress. A depressed baroreflex is associated with an unopposed sympathetic tone, increased SBP (29), LV wall stress, and subsequent LV hypertrophy and increased risk of heart failure and CVD (30–32). Although baroreflex sensitivity was not directly measured in this study, several studies have reported early impairment of baroreflex sensitivity in patients with diabetes (33,34). Sympathetic activation associated with earlier stages of CAN may also promote myocardial injury and LV remodeling via abnormal myocardial norepinephrine signaling, catecholamine toxicity (35), oxidative stress–induced myocardial cytotoxic effects (36), calcium-dependent apoptosis, and myocardial fibrosis (36–38).
Increased LV mass is associated with incomplete ventricular relaxation, a clinical variable of diastolic dysfunction, in patients with normal EF (39). With incomplete relaxation, the myocardium remains in an activated state that can be described as a partial diastolic contracture. Traditionally, incomplete relaxation was believed to be associated with either high-rate tachycardia or increased LV stiffness (39,40). CAN + T1DM subjects had significantly higher heart rates than subjects without CAN. This may also contribute to incomplete relaxation in patients with LV hypertrophy compared with patients with normal LV mass (39).
A stiff, noncompliant ventricle has been shown to be a determinant of the diastolic properties of the LV, including incomplete relaxation (41,42). Although the majority of patients with diastolic dysfunction and normal EF are asymptomatic at rest, symptoms may develop with exertion, stress, or tachycardia. Such patients are at risk for the development of acute-onset heart failure symptoms. Exercise intolerance is one of the first symptoms in patients with diastolic dysfunction and in patients with CAN. An increase in LV diastolic pressures and pulmonary venous pressures is 1 of the proposed mechanisms associated with exercise intolerance in patients with LV diastolic dysfunction with normal EF. These observations suggest possible differences in the components of diastolic dysfunction between rest and dynamic conditions, which may have clinical relevance.
LV hypertrophy, defined by increased LV mass, has been shown to be a powerful, independent predictor of CVD mortality (43). Similarly, CAN has been shown to strongly predict CVD mortality in patients with diabetes (6,44,45), independent of traditional CVD risk factors (6). Therefore, the association of LV hypertrophy and CAN may contribute to increased mortality risk in these patients and may require more aggressive management of modifiable risk factors.
Acceptance of isolated diastolic dysfunction as the earliest (and primary) cardiac abnormality in patients with diabetes (18) might also reflect the insensitivity of commonly used indices for identifying earlier stages of abnormal LV systolic function. The ongoing evaluations with CMRI tagging techniques in the EDIC cohort will further elucidate the magnitude of changes on subclinical measures such as LV torsion and strain in this cohort of patients with T1DM.
A strong association was found between measures of CAN and higher cardiac output. Cardiac output is controlled by chronotropic and inotropic cardiac adaptive mechanisms, and is modulated by autonomic tone and innervation of the heart (46,47). Thus, the higher resting heart rate observed in subjects with CAN contributed to the higher observed cardiac output in these subjects. Differences in stroke volume associated with cardiac denervation and with changes in ventricular filling time (48) and baroreflex sensitivity (47,48) may have also played a role. Increased cardiac output has been associated with high-output cardiac failure (49) through mechanisms that involve changes in systemic vascular resistance and neurohormonal activation (49). Recent studies have also linked a high cardiac output to LV hypertrophy (50). In our study, the presence of CAN was associated with both LV hypertrophy and higher cardiac output.
Study strengths include the large number of standardized, high-quality CMRI and CAN evaluations performed. Additionally, this cohort of patients with T1DM has been followed for more than 20 years and carefully characterized for many other cardiovascular risk factors and microvascular and macrovascular complications.
Study limitations
The study is limited by its cross-sectional nature, preventing analysis of any causal relationship between CAN and LV dysfunction. It is further limited by the lack of concomitant CMRI and CAN evaluations in ~20% of the EDIC participants.
Conclusions
In summary, in this cohort of patients with T1DM, the presence of CAN was associated with increased LV mass and with concentric remodeling as assessed by CMRI, independent of age, sex, and other traditional CVD risk factors. Because both LV hypertrophy and CAN have been associated with diastolic dysfunction and increased CVD mortality, patients with this combined phenotype may be at increased risk for CVD and may benefit from early and more aggressive risk factor management. Studies targeting aggressive risk factor management in this patient population are warranted.
Supplementary Material
Acknowledgments
The DCCT/EDIC project is supported by contracts with the Division of Diabetes, Endocrinology and Metabolic Diseases of the National Institute of Diabetes and Digestive and Kidney Diseases; National Eye Institute; National Institute of Neurological Disorders and Stroke; the General Clinical Research Centers Program; and the Clinical and Translation Science Centers Program, National Center for Research Resources, as well as by Genentech through a Cooperative Research and Development Agreement with the National Institute of Diabetes and Digestive and Kidney Diseases, Bethesda, Maryland.
Abbreviations and Acronyms
- ACEi
angiotensin-converting enzyme inhibitor
- AER
albumin excretion rate
- ARB
angiotensin receptor blocker
- BP
blood pressure
- CAN
cardiac autonomic neuropathy
- CMRI
cardiac magnetic resonance imaging
- CVD
cardiovascular disease
- DBP
diastolic blood pressure
- EF
ejection fraction
- HbA1c
glycosylated hemoglobin
- HDL
high-density lipoprotein
- LDL
low-density lipoprotein
- LV
left ventricle/ventricular
- LVEDV
left ventricular end-diastolic volume
- LVESV
left ventricular end-systolic volume
- LVSV
left ventricular stroke volume
- MRI
magnetic resonance imaging
- SBP
systolic blood pressure
- SSFP
steady-state free precession
- T1DM
type 1 diabetes
Footnotes
The authors have reported that they have no relationships relevant to the contents of this paper to disclose. Darren McGuire, MD, served as Guest Editor of this paper.
APPENDIX For supplemental tables and a list of the participating radiologists and technologists in the DCCT/EDIC Research Group, please see the Online Appendix. A complete list of the individuals and institutions participating in the DCCT/EDIC Research Group can be found in Archives of Ophthalmology, 2008:126(12):1713.
REFERENCES
- 1.Fang ZY, Najos-Valencia O, Leano R, Marwick TH. Patients with early diabetic heart disease demonstrate a normal myocardial response to dobutamine. J Am Coll Cardiol. 2003;42:446–53. doi: 10.1016/s0735-1097(03)00654-5. [DOI] [PubMed] [Google Scholar]
- 2.Fang ZY, Yuda S, Anderson V, Short L, Case C, Marwick TH. Echocardiographic detection of early diabetic myocardial disease. J Am Coll Cardiol. 2003;41:611–7. doi: 10.1016/s0735-1097(02)02869-3. [DOI] [PubMed] [Google Scholar]
- 3.Sacre JW, Franjic B, Jellis CL, Jenkins C, Coombes JS, Marwick TH. Association of cardiac autonomic neuropathy with subclinical myocardial dysfunction in type 2 diabetes. J Am Coll Cardiol Img. 2010;3:1207–15. doi: 10.1016/j.jcmg.2010.09.014. [DOI] [PubMed] [Google Scholar]
- 4.Pop-Busui R, Kirkwood I, Schmid H, et al. Sympathetic dysfunction in type 1 diabetes: association with impaired myocardial blood flow reserve and diastolic dysfunction. J Am Coll Cardiol. 2004;44:2368–74. doi: 10.1016/j.jacc.2004.09.033. [DOI] [PubMed] [Google Scholar]
- 5.Fang ZY, Prins JB, Marwick TH. Diabetic cardiomyopathy: evidence, mechanisms, and therapeutic implications. Endocr Rev. 2004;25:543–67. doi: 10.1210/er.2003-0012. [DOI] [PubMed] [Google Scholar]
- 6.Pop-Busui R. Cardiac autonomic neuropathy in diabetes: a clinical perspective. Diabetes Care. 2010;33:434–41. doi: 10.2337/dc09-1294. [DOI] [PMC free article] [PubMed] [Google Scholar]
- 7.Spallone V, Ziegler D, Freeman R, et al. Cardiovascular autonomic neuropathy in diabetes: clinical impact, assessment, diagnosis, and management. Diabetes Metab Res Rev. 2011;27:639–53. doi: 10.1002/dmrr.1239. [DOI] [PubMed] [Google Scholar]
- 8.Vinik AI, Ziegler D. Diabetic cardiovascular autonomic neuropathy. Circulation. 2007;115:387–97. doi: 10.1161/CIRCULATIONAHA.106.634949. [DOI] [PubMed] [Google Scholar]
- 9.Nathan DM, Cleary PA, Backlund JY, et al. Intensive diabetes treatment and cardiovascular disease in patients with type 1 diabetes. N Engl J Med. 2005;353:2643–53. doi: 10.1056/NEJMoa052187. [DOI] [PMC free article] [PubMed] [Google Scholar]
- 10.Lima JA, Desai MY. Cardiovascular magnetic resonance imaging: current and emerging applications. J Am Coll Cardiol. 2004;44:1164–71. doi: 10.1016/j.jacc.2004.06.033. [DOI] [PubMed] [Google Scholar]
- 11.Epidemiology of Diabetes Interventions and Complications (EDIC) Design, implementation, and preliminary results of a long-term follow-up of the Diabetes Control and Complications Trial cohort. Diabetes Care. 1999;22:99–111. doi: 10.2337/diacare.22.1.99. [DOI] [PMC free article] [PubMed] [Google Scholar]
- 12.The Diabetes Control and Complications Trial Research Group The effect of intensive treatment of diabetes on the development and progression of long-term complications in insulin-dependent diabetes mellitus. N Engl J Med. 1993;329:977–86. doi: 10.1056/NEJM199309303291401. [DOI] [PubMed] [Google Scholar]
- 13.Writing Team for the Diabetes Control and Complications Trial/Epidemiology of Diabetes Interventions and Complications Research Group Sustained effect of intensive treatment of type 1 diabetes mellitus on development and progression of diabetic nephropathy: the Epidemiology of Diabetes Interventions and Complications (EDIC) study. JAMA. 2003;290:2159–67. doi: 10.1001/jama.290.16.2159. [DOI] [PMC free article] [PubMed] [Google Scholar]
- 14.The Diabetes Control and Complications Trial Research Group The effect of intensive diabetes therapy on measures of autonomic nervous system function in the Diabetes Control and Complications Trial (DCCT) Diabetologia. 1998;41:416–23. doi: 10.1007/s001250050924. [DOI] [PMC free article] [PubMed] [Google Scholar]
- 15.Pop-Busui R, Low PA, Waberski BH, et al. Effects of prior intensive insulin therapy on cardiac autonomic nervous system function in type 1 diabetes mellitus: the Diabetes Control and Complications Trial/Epidemiology of Diabetes Interventions and Complications study (DCCT/EDIC) Circulation. 2009;119:2886–93. doi: 10.1161/CIRCULATIONAHA.108.837369. [DOI] [PMC free article] [PubMed] [Google Scholar]
- 16.The Consensus Committee of the American Autonomic Society and the American Academy of Neurology Consensus statement on the definition of orthostatic hypotension, pure autonomic failure, and multiple system atrophy. Neurology. 1996;46:1470. doi: 10.1212/wnl.46.5.1470. [DOI] [PubMed] [Google Scholar]
- 17.Turkbey EB, Backlund JY, Genuth S, et al. Myocardial structure, function, and scar in patients with type 1 diabetes mellitus. Circulation. 2011;124:1737–46. doi: 10.1161/CIRCULATIONAHA.111.022327. [DOI] [PMC free article] [PubMed] [Google Scholar]
- 18.Bell DS. Diabetic cardiomyopathy. Diabetes Care. 2003;26:2949–51. doi: 10.2337/diacare.26.10.2949. [DOI] [PubMed] [Google Scholar]
- 19.Vered A, Battler A, Segal P, et al. Exercise-induced left ventricular dysfunction in young men with asymptomatic diabetes mellitus (diabetic cardiomyopathy) Am J Cardiol. 1984;54:633–7. doi: 10.1016/0002-9149(84)90263-7. [DOI] [PubMed] [Google Scholar]
- 20.Laakso M. Cardiovascular disease in type 2 diabetes from population to man to mechanisms: the Kelly West Award Lecture 2008. Diabetes Care. 2010;33:442–9. doi: 10.2337/dc09-0749. [DOI] [PMC free article] [PubMed] [Google Scholar]
- 21.Karamitsos TD, Karvounis HI, Didangelos T, Parcharidis GE, Karamitsos DT. Impact of autonomic neuropathy on left ventricular function in normotensive type 1 diabetic patients: a tissue Doppler echocardiographic study. Diabetes Care. 2008;31:325–7. doi: 10.2337/dc07-1634. [DOI] [PubMed] [Google Scholar]
- 22.Dinh W, Futh R, Lankisch M, et al. Cardiovascular autonomic neuropathy contributes to left ventricular diastolic dysfunction in subjects with type 2 diabetes and impaired glucose tolerance undergoing coronary angiography. Diabet Med. 2011;28:311–8. doi: 10.1111/j.1464-5491.2010.03221.x. [DOI] [PubMed] [Google Scholar]
- 23.Moriuchi M, Saito S, Kasamaki Y, Komaki K, Kanmatsuse K, Hayasaka K. Three-dimensional analysis of left ventricular geometry using magnetic resonance imaging: feasibility and comparison with echocardiographic analysis. J Cardiol. 2003;42:249–60. [PubMed] [Google Scholar]
- 24.Rodriguez CJ, Diez-Roux AV, Moran A, et al. Left ventricular mass and ventricular remodeling among Hispanic subgroups compared with non-Hispanic blacks and whites: MESA (Multi-Ethnic Study of Atherosclerosis) J Am Coll Cardiol. 2010;55:234–42. doi: 10.1016/j.jacc.2009.08.046. [DOI] [PMC free article] [PubMed] [Google Scholar]
- 25.Verma A, Meris A, Skali H, et al. Prognostic implications of left ventricular mass and geometry following myocardial infarction: the VAL-IANT (VALsartan In Acute myocardial iNfarcTion) echocardiographic study. J Am Coll Cardiol Img. 2008;1:582–91. doi: 10.1016/j.jcmg.2008.05.012. [DOI] [PubMed] [Google Scholar]
- 26.Paulus WJ, Tschope C, Sanderson JE, et al. How to diagnose diastolic heart failure: a consensus statement of the European Society of Cardiology. Eur Heart J. 2007;28:2539–50. doi: 10.1093/eurheartj/ehm037. [DOI] [PubMed] [Google Scholar]
- 27.Low PA. Diabetic autonomic neuropathy. Semin Neurol. 1996;16:143–51. doi: 10.1055/s-2008-1040970. [DOI] [PubMed] [Google Scholar]
- 28.Bernardi L, Spallone V, Stevens M, et al. Investigation methods for cardiac autonomic function in human research studies. Diabetes Metab Res Rev. 2011;27:654–64. doi: 10.1002/dmrr.1224. [DOI] [PubMed] [Google Scholar]
- 29.Rosengard-Barlund M, Bernardi L, Sandelin A, Forsblom C, Groop PH. Baroreflex sensitivity and its response to deep breathing predict increase in blood pressure in type 1 diabetes in a 5-year follow-up. Diabetes Care. 2011;34:2424–30. doi: 10.2337/dc11-0629. [DOI] [PMC free article] [PubMed] [Google Scholar]
- 30.La Rovere MT, Bigger JT, Jr., Marcus FI, Mortara A, Schwartz PJ. Baroreflex sensitivity and heart-rate variability in prediction of total cardiac mortality after myocardial infarction. Lancet. 1998;351:478–84. doi: 10.1016/s0140-6736(97)11144-8. [DOI] [PubMed] [Google Scholar]
- 31.La Rovere MT, Pinna GD, Maestri R, et al. Prognostic implications of baroreflex sensitivity in heart failure patients in the beta-blocking era. J Am Coll Cardiol. 2009;53:193–9. doi: 10.1016/j.jacc.2008.09.034. [DOI] [PubMed] [Google Scholar]
- 32.Ormezzano O, Quesada JL, Pierre H, Mallion JM, Baguet JP. EVAluation of the prognostic value of BARoreflex sensitivity in hypertensive patients: the EVABAR study. J Hypertens. 2008;26:1373–8. doi: 10.1097/HJH.0b013e3283015e5a. [DOI] [PubMed] [Google Scholar]
- 33.Frattola A, Parati G, Gamba P, et al. Time and frequency domain estimates of spontaneous baroreflex sensitivity provide early detection of autonomic dysfunction in diabetes mellitus. Diabetologia. 1997;40:1470–5. doi: 10.1007/s001250050851. [DOI] [PubMed] [Google Scholar]
- 34.Weston PJ, James MA, Panerai RB, McNally PG, Potter JF, Thurston H. Evidence of defective cardiovascular regulation in insulin-dependent diabetic patients without clinical autonomic dysfunction. Diabetes Res Clin Pract. 1998;42:141–8. doi: 10.1016/s0168-8227(98)00094-1. [DOI] [PubMed] [Google Scholar]
- 35.Paulson DJ, Light KE. Elevation of serum and ventricular norepinephrine content in the diabetic rat. Res Commun Chem Pathol Pharmacol. 1981;33:559–62. [PubMed] [Google Scholar]
- 36.Givertz MM, Sawyer DB, Colucci WS. Antioxidants and myocardial contractility: illuminating the “Dark Side” of beta-adrenergic receptor activation? Circulation. 2001;103:782–3. doi: 10.1161/01.cir.103.6.782. [DOI] [PubMed] [Google Scholar]
- 37.Communal C, Singh K, Pimentel DR, Colucci WS. Norepinephrine stimulates apoptosis in adult rat ventricular myocytes by activation of the beta-adrenergic pathway. Circulation. 1998;98:1329–34. doi: 10.1161/01.cir.98.13.1329. [DOI] [PubMed] [Google Scholar]
- 38.Kellogg AP, Converso K, Wiggin T, Stevens M, Pop-Busui R. Effects of cyclooxygenase-2 gene inactivation on cardiac autonomic and left ventricular function in experimental diabetes. Am J Physiol Heart Circ Physiol. 2009;296:H453–61. doi: 10.1152/ajpheart.00678.2008. [DOI] [PMC free article] [PubMed] [Google Scholar]
- 39.Selby DE, Palmer BM, LeWinter MM, Meyer M. Tachycardia-induced diastolic dysfunction and resting tone in myocardium from patients with a normal ejection fraction. J Am Coll Cardiol. 2011;58:147–54. doi: 10.1016/j.jacc.2010.10.069. [DOI] [PMC free article] [PubMed] [Google Scholar]
- 40.Westermann D, Kasner M, Steendijk P, et al. Role of left ventricular stiffness in heart failure with normal ejection fraction. Circulation. 2008;117:2051–60. doi: 10.1161/CIRCULATIONAHA.107.716886. [DOI] [PubMed] [Google Scholar]
- 41.Querejeta R, Lopez B, Gonzalez A, et al. Increased collagen type I synthesis in patients with heart failure of hypertensive origin: relation to myocardial fibrosis. Circulation. 2004;110:1263–8. doi: 10.1161/01.CIR.0000140973.60992.9A. [DOI] [PubMed] [Google Scholar]
- 42.Zile MR, Baicu CF, Gaasch WH. Diastolic heart failure—abnormalities in active relaxation and passive stiffness of the left ventricle. N Engl J Med. 2004;350:1953–9. doi: 10.1056/NEJMoa032566. [DOI] [PubMed] [Google Scholar]
- 43.Levy D, Garrison RJ, Savage DD, Kannel WB, Castelli WP. Prognostic implications of echocardiographically determined left ventricular mass in the Framingham Heart Study. N Engl J Med. 1990;322:1561–6. doi: 10.1056/NEJM199005313222203. [DOI] [PubMed] [Google Scholar]
- 44.Maser RE, Mitchell BD, Vinik AI, Freeman R. The association between cardiovascular autonomic neuropathy and mortality in individuals with diabetes: a meta-analysis. Diabetes Care. 2003;26:1895–901. doi: 10.2337/diacare.26.6.1895. [DOI] [PubMed] [Google Scholar]
- 45.Ziegler D, Zentai CP, Perz S, et al. KORA Study Group Prediction of mortality using measures of cardiac autonomic dysfunction in the diabetic and nondiabetic population: the MONICA/KORA Augsburg Cohort Study. Diabetes Care. 2008;31:556–61. doi: 10.2337/dc07-1615. [DOI] [PubMed] [Google Scholar]
- 46.Proctor DN, Beck KC, Shen PH, Eickhoff TJ, Halliwill JR, Joyner MJ. Influence of age and gender on cardiac output-VO2 relationships during submaximal cycle ergometry. J Appl Physiol. 1998;84:599–605. doi: 10.1152/jappl.1998.84.2.599. [DOI] [PubMed] [Google Scholar]
- 47.Kent KM, Cooper T. The denervated heart. A model for studying autonomic control of the heart. N Engl J Med. 1974;291:1017–21. doi: 10.1056/NEJM197411072911908. [DOI] [PubMed] [Google Scholar]
- 48.Ichinose M, Sala-Mercado JA, Coutsos M, et al. Dynamic cardiac output regulation at rest, during exercise and muscle metaboreflex activation: impact of congestive heart failure. Am J Physiol Regul Integr Comp Physiol. 2012;303:R757–68. doi: 10.1152/ajpregu.00119.2012. [DOI] [PMC free article] [PubMed] [Google Scholar]
- 49.Mehta PA, Dubrey SW. High output heart failure. QJM. 2009;102:235–41. doi: 10.1093/qjmed/hcn147. [DOI] [PubMed] [Google Scholar]
- 50.Weaver DJ, Jr., Kimball TR, Koury PR, Mitsnefes MM. Cardiac output and associated left ventricular hypertrophy in pediatric chronic kidney disease. Pediatr Nephrol. 2009;24:565–70. doi: 10.1007/s00467-008-1052-2. [DOI] [PubMed] [Google Scholar]
Associated Data
This section collects any data citations, data availability statements, or supplementary materials included in this article.