

Abstract
Purpose
Life course models suggest that socioeconomic mobility is associated with decreased cardiovascular disease (CVD) mortality risk. We examined adult socioeconomic mobility measured by household income in relation to CVD mortality risk among older adults.
Methods
Data from 2691 (nmen=1157, nwomen=1534) Alameda County Study respondents in 1994 were used in these analyses. Latent growth curve models were used to identify income patterns from 1965–1994.
Results
Income patterns were categorized as consistently low, moderately low, increasing, and high. Bivariate models showed that membership in the increasing compared to high pattern was associated with decreased hazards of CVD mortality (HR=0.15, 95% CI=0.04–0.53). Controlling for age, race/ethnicity, marital status and gender, respondents in the consistently low (HR= 2.1, 95% CI=1.5–3.1) and high pattern (HR=2.2, 95% CI=1.1–4.2) had increased hazards of CVD mortality than those in the moderately low income group.
Conclusions
Patterns of association were consistent with social mobility models of SEP, indicating lower CVD mortality risk for those with increasing or higher incomes. Future work should continue to investigate measures that capture the variation in social mobility over the life course, and how these patterns shape chronic disease risk in later life.
Keywords: income, socioeconomic, social mobility, cardiovascular disease, mortality
Life course research has shown that lower socioeconomic position (SEP) during childhood, adulthood, and older age is associated with greater risk of cardiovascular disease (CVD) [1, 2]. The accumulation model of disease risk over the life course is often cited as a potential explanation for the relation between SEP over the life course and CVD mortality risk [3, 4]. Long term exposure to low SEP, often captured by parental measures [5], education [6], and income [1] is associated with increased risk of poor adult health, including CVD mortality risk [1, 7]. Social mobility models suggest that variability in SEP or patterns of SEP exposure in addition to absolute measures of SEP are associated with variations in disease risk [8–11]. This area of research commonly examines SEP changes or cumulative effects across childhood to adulthood [1, 8] rather than variations throughout adulthood specifically.
Research on social mobility over the adult life course has examined multiple health outcomes, including general health [12], mortality [13], psychological [14], behavioral [15] and cardiovascular related outcomes [4, 16], and suggest positive outcomes [12, 14] for upwardly mobile groups. All but two of these studies have used measures of change in income over time [12–14, 16] to reflect some aspect of SEP variation over time. Only two of these studies captured patterns of income over time [4, 15], but neither study examined CVD mortality. While findings from these studies would suggest that upward mobility is associated with decreased CVD mortality risk, no studies of which we are aware have examined social mobility measured by income specifically over the adult life course in relation to CVD mortality risk.
We examined associations between social mobility measured by income patterns over the adult life course and CVD mortality risk among a population-based cohort of older adults who participated in the Alameda County Study from 1965–1994. Our work contributes to the limited body of empirical evidence examining the social mobility model based on patterning and variability of SEP over the adult life course in relation to CVD mortality risk.
Methods
Study population
The Alameda County Study was initiated in 1965 and was designed to collect socio-environmental, behavioral, and health data from men and women aged 20 and older or 16 and older if married in Alameda County, California [17–19]. A two stage stratified systematic sample was used to gather data on 8,023 non-institutionalized adults from 4,452 household units [17]. This study protocol was approved by the University of Michigan Institutional Review Board. The respondents to the baseline survey (n=6928) represented 86% of those sampled. Multiple waves of follow-up were completed in 1974 (85.1% response), 1983 (87.3% response among a 50% sample of those not known to be dead in 1982), and 1994 (n=2729, 93% response rate of respondents from 1974 and 1983). Our sample includes respondents without missing data for age in 1994, race/ethnicity, and marital status (n=2,691).
Cardiovascular disease mortality ascertainment
Cause-specific mortality data was collected from state death certificate data as well as gathered using cross-linkage methods with the National Death Index. Deaths of Alameda County Study participants were ascertained through December 31, 2000. All deaths attributable to diseases of the circulatory system (International Classification of Diseases-9 codes 390-459) were included for purposes of this study.
Household income
At each wave of data collection gross household income from all sources for the previous year was reported in categories. Household income in 1965 was categorized into four categories; fourteen categories in 1974, 19 categories in 1983, and 14 categories in 1994 and 1999. Using demographic data common to both the Alameda County Study and Current Population Surveys [20] of the same year, continuous measures of household income were imputed using IVEware [21] and bounded by the income categories provided by the respondents in the survey [22]. The common data used from the Alameda County Study and Current Population Surveys based on national data to carry out the imputation included age, education, gender, race, marital status, occupation, and number of household members. The Current Population Surveys, conducted monthly by the Census Bureau for the Bureau of Labor Statistics, provides the best national data on income [20]. These continuous measures were constructed to reduce misclassification due to fluctuations in the income categories throughout the waves and the widths of the income categories, and the utility of this approach has been discussed elsewhere [23, 24]. All respondents were required to have at least three waves of data for household income, and all income measures from each wave were adjusted for household size [25] and to 1993 dollars using the Consumer Price Index.
Covariates
Additional demographic covariates included in the analyses were age (years, <65 vs 65+), race/ethnicity (White, Black, other), marital status (married or not married), and gender. All covariate measures reflect data reported in 1994.
Statistical analyses
Modeling income trajectories
Trajectories reflect patterns of household income, in 1994 dollars, from 1965, 1974, 1983, and 1994. Income trajectories were created using a group-based trajectory modeling approach within the PROC TRAJ procedure in SAS System V 9.2 (SAS Institute, Cary, NC) [26]. This approach assumes the population is composed of a mixture of underlying trajectory groups. The groups were created based upon a parametric model of the household income data and linkage between time and household income. Using a latent variable approach, the method uses polynomial functions of time to estimate the likelihood of an individual having a specific household income [27].
Models with 2–6 trajectory groups, each with the same polynomial order, were used to determine the appropriate number of trajectory groups. Two-six groups allowed for multiple subgroups to emerge. Among these models, the model with the most negative Bayesian Information Criterion (BIC), which was provided by PROC TRAJ, was selected as the final model [26]. Patterns of the trajectories were determined based on the highest polynomial order that remained significant for each trajectory over time.[26] For each individual, the procedure calculated the posterior probability of membership in each trajectory group, and individuals were assigned to the trajectory for which they had the highest probability. All probabilities were greater than 90%. The resulting classification variable was included as an explanatory variable in the analyses. Although the probability of membership for the respective trajectory classes were greater than 90%, the variability of any individual from the modal values of the trajectories was unaccounted for in the regression models.
Observation time for deaths from CVD was calculated from the date of completion of the survey in 1994, or June 1, 1994 for those with missing data for the date of questionnaire completion until the date of death or the end of follow-up for deaths (December 31, 2000).
Descriptive statistics for each variable were examined by gender and compared using t-tests for continuous variables and chi-square tests for categorical measures. Proportional hazards regression models using PROC PHREG in SAS were used to examine the associations. Validity of the proportional hazards assumptions was assessed through the inclusion of interaction terms between time and each variable in the models.
Results
There were 2,729 men and women in 1994 who had at least three waves of data, and 2,691 (98.6%; 1157 men and 1534 women) of these persons provided information on gender, age, race/ethnicity, marital status, and household income. Descriptive information is displayed in Table 1.
Table 1.
Sample Characteristics of Adults in the Alameda County Study, Alameda County, California, 1994 (n=2691)
| N | % | ||
|---|---|---|---|
| CVD Death | 152 | 5.65 | |
| Age in 1994 (M, SD) | 64.81 | 10.57 | |
| Gender | Male | 1157 | 43.00 |
| Female | 1534 | 57.00 | |
| Race/ethnicity | White | 2353 | 87.44 |
| Black | 218 | 8.10 | |
| Other | 120 | 4.46 | |
| Married | 1870 | 69.49 | |
| Combined Trajectory Groups | 1 (Consistently Low) | 440 | 16.35 |
| 2 (Moderately Low) | 1777 | 66.03 | |
| 3 (Increasing) | 297 | 11.04 | |
| 4 (High) | 177 | 6.58 | |
| Original Trajectory Groups | 1 | 42 | 1.56 |
| 2 | 70 | 2.60 | |
| 3 | 328 | 12.19 | |
| 4 | 1777 | 66.03 | |
| 5 | 297 | 11.04 | |
| 6 | 177 | 6.58 | |
| Average Household Income (M, SD) | 36515.51 | 22957.60 | |
| 1994 Household Income (M, SD) | 38973.46 | 38594.24 |
Income trajectory patterns
The model with six household income trajectories had the smallest BIC than the five trajectory model. Membership percentages across these six trajectories were 1.6%, 2.6%, 12.2%, 66.0%, 11.0%, and 6.6% for trajectories with the lowest to highest absolute dollar value in 1965. Due to the small membership percentages in the lowest two trajectories, these two groups (with proportions 1.6% and 2.6% respectively) were combined with the trajectory group (12.2%) that shared similarly low income levels across the study period., , The resulting four trajectory groups were categorized as consistently low (Groups 1; n=440, 16.4%, mean age=67 years, ndeaths=51), moderately low (Group 2; n=1777, n=66.0%, mean age=64 years, ndeaths=87), increasing (Group 3; n=297, 11.0%, mean age=57 years, ndeaths=3) and consistently high (Group 4; n=177, 6.6%, mean age=71 years, ndeaths=11). The trajectories are shown in Figure 1, with mean age and income values reported.
Figure 1.
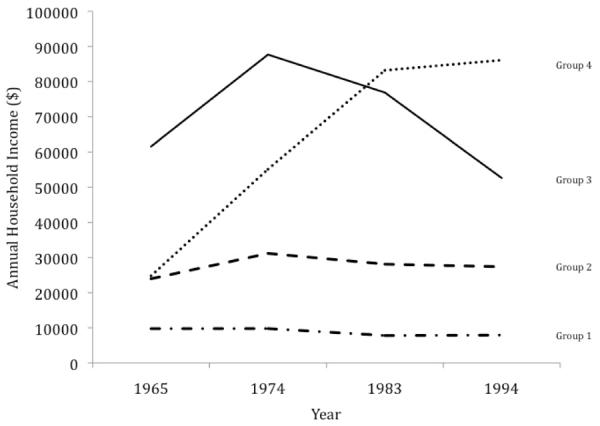
Household Income Trajectory Groups for Adults in the Alameda County Study, Alameda County, CA, 1965–1994. Consistently low: 16.35% (n=440), mean age = 67 years, range= 47–102 years, mean 1965–1994 income = $14751; Moderately low: 66.03%% (n=1777), mean age = 64 years, range= 46–97 years, mean 1965–1994 income = $29572; Increasing: 11.04% (n=297), mean age = 57 years, range= 47–86 years, mean 1965–1994 income = $66258; High: 6.58% (n=177), mean age = 71 years, range= 49–91 years, mean 1965–1994 income = $78403.
Proportional hazards model results
No violations of the proportional hazards were detected for any of the models. The bivariate model (Table 2, Model 1) between household income trajectory groups and CVD mortality showed that those in the consistently low trajectory had increased hazards of CVD mortality (HR = 1.91, 95% CI = 1.00–3.67), while membership in the increasing compared to the high trajectory was associated with decreased hazards of CVD mortality (HR = 0.15, 95%CI = 0.04–0.53). After adjustment for age, race/ethnicity, marital status, and gender (Model 2), individuals in the consistently low trajectory had increased hazards of CVD mortality (HR = 2.15, 95% CI = 1.10–4.20) compared to those in the high trajectory, and the associations were weakened but consistent in direction with additional confounders included in the model (Model 3).
Table 2.
Cardiovascular Disease Mortality (1994–2000) Proportional Hazards Model Results for Adults in the Alameda County Study, Alameda County, CA (n=2691)
| Model 1 (n=2691) | Model 2 (N=2691) | |||
|---|---|---|---|---|
| HR | 95% CI | HR | 95% CI | |
| Household Income Trajectory Group | ||||
| Consistently Low (Group 1) | 1.91 | (1.00–3.67) | 2.15 | (1.10–4.20) |
| Moderately Low (Group 2) | 0.76 | (0.41–1.42) | 1.02 | (0.54–1.90) |
| Increasing (Group 3) | 0.15 | (0.04–0.53) | 0.38 | (0.11–1.36) |
| High (Group 4) | ref | ref | ||
| Age < 65 (ref= ≥65) | 0.18 | (0.12–0.28) | ||
| Married (ref= Not married) | 0.60 | (0.43–0.85) | ||
| Race (ref=White) | ||||
| Black | 0.97 | (0.60–1.56) | ||
| Other | 1.00 | (0.45–2.19) | ||
| Male (ref=Female) | 1.34 | (0.95–1.87) | ||
HR= Hazards Ratio; CI=Confidence interval; ref=Referent group
Model 1: Household income measure
Model 2: Age, race/ethnicity, marital status, gender, and household income measure
Table 3 displays the hazards ratios for each of the remaining contrasting pairs of income patterns. Bivariate model results (Model 1) suggest that those in the consistently low trajectory had higher hazards of CVD mortality than those in either the moderately low (HR = 2.52, 95% CI =1.77–3.59) or increasing (HR = 12.92, 95% CI = 4.05–41.21) income patterns. Based on Model 2, results remained consistent with adjustment for age, race/ethnicity, marital status and gender (consistently vs moderately low: HR = 2.12, 95% CI = 1.46–3.07; consistently low vs increasing: HR = 5.70, 95% CI= 1.76–18.42). Bivariate models also indicated increased hazards for older adults following the moderately low compared to increasing income pattern (HR = 5.13, 95 %CI = 1.63–16.10).
Table 3.
Contrasts of income pattern hazards ratios in the Alameda County Study
| Model 1 | Model 2 | |||
|---|---|---|---|---|
| HR | 95% CI | HR | 95% CI | |
| Consistently Low vs Moderately Low Income Pattern | 2.52 | (1.77–3.59) | 2.12 | (1.46–3.07) |
| Consistently Low vs Increasing Income Pattern | 12.92 | (4.05–41.21) | 5.7 | (1.76–18.42) |
| Moderately Low vs Increasing Income Pattern | 5.13 | (1.63–16.10) | 2.69 | (0.85–8.50) |
HR= Hazards Ratio; CI=Confidence interval; ref=Referent group
Model 1: Household income measure
Model 2: Age, race/ethnicity, marital status, gender, and household income measure
Discussion
We found that adults who had a consistently low income pattern throughout the adult life course had increased 6-year hazards of CVD mortality compared to individuals who followed high, increasing, or even stable but only moderately low income patterns. Adults who had a moderately low pattern of income over the adult life course had higher hazards of CVD mortality within this sample compared to those with increasing income patterns but not the high pattern. Adults who had an increasing income pattern had decreased hazards of CVD mortality compared those in the high pattern.
Our findings suggest that increasing patterns of income over the life course are associated with lower CVD mortality risk, and provide evidence in modest support of social mobility models [3]. However, the increased risk of CVD mortality for individuals with consistently low household income throughout adulthood compared to each of the other higher trajectories is consistent with literature showing that chronic deprivation is associated with higher hazards of mortality [1, 28]. In addition, the findings that moderately low compared to higher income patterns was associated with increased hazards of CVD mortality are consistent with literature documenting the greatest CVD mortality risks for those with the lowest SEP, with decreasing risks for CVD mortality as the SEP level increases [1, 2].
The decreased risk of CVD mortality among individuals in the increasing income pattern compared to the high income pattern suggested that even among adults with relatively high levels of income throughout life, the decline in income in the latter years may have been associated with adverse health consequences. A closer look at the data indicated that the mean age of the adults in the high income pattern was 71 years, while mean age of adults in the increasing pattern was 57 years. Given that CVD mortality is more common among older adults, the higher hazards of CVD mortality in the high group were not surprising. The decrease in income among the high pattern group may reflect a decrease in income due to retirement, or may be the result of reverse causation associated with poorer health outcomes among older adults, and therefore limited ability to earn income. In addition, adults in the increasing pattern group, which may represent an upwardly social mobile group of adults, may have increased access to medical resources that can prevent poor health, and therefore have decreased risk of cardiovascular disease mortality. Consistent with other research findings on SEP and CVD mortality, this result suggests that significant increases in financial resources provide a protective effect from CVD mortality [1, 2, 9]. This result may also indicate that more recent measures of income reflect an individual's current CVD mortality risk in addition to one's pattern of income (or SEP) over the life course. Within the limited studies using income patterning in relation to adult health, one study has demonstrated attenuation of associations between income patterns and heavy drinking behavior among adults, and suggested recent income as a potential mediator of the relationship [15].
This study adds to the literature by examining income trajectory patterns over the adult life course in association with CVD mortality risk, and found that individuals following consistently lower compared to higher income patterns over the adult life course had increased hazards of CVD mortality. The use of trajectory groupings of household income over the life course is relatively new and limited in the health literature, with few studies using the trajectories of SEP or income in relation to health [11, 15, 29–31], and no studies were found that explore income trajectories in direct relation to CVD mortality risk. Income patterns reflect not only available resources, but also life course events, such as marriage, which could increase household income [32, 33], as well as early death [34], job loss [35], or poor health, including heart disease [34], each of which contributes to income loss. The use of income patterns in our analysis allows us to capture a set of experiences that determine resource availability and examine the relationship with CVD mortality risk. Our findings are consistent with previous works that identified inverse associations between SEP and CVD mortality risk, and add to the empirical literature examining the patterning of income in relation to health.
Limitations of the study include the limited number of CVD mortality cases in the sample overall, but specifically among the increasing and high income patterns. While the higher two income patterns characterize a significant proportion of the sample, and the CVD mortality risks among these two groups compared to the lower two income patterns are consistent with patterns of SEP and CVD mortality in the literature [1, 2], the small number of CVD deaths contributes to imprecision in the hazards ratio estimates, and highlights the need for larger longitudinal studies of the income patterning relationship with CVD mortality. An additional limitation is the absence of wealth data in these analyses, as older adults may depend upon the wealth accumulated to live [36]. Wealth is distinct from income in these analyses, but information on wealth could provide insight into mechanisms through which those with diminishing income over the life course manage their health. Finally, data for this sample was based on only four waves of data, which introduced wide time intervals in which significant fluctuations in income could have occurred. However, the repeated measures for several individuals provided us with the opportunity to examine variation in income and the associations with CVD mortality.
In summary, we aimed to investigate associations between adult life course income patterns and CVD mortality risk among older adults. Income patterns reflect information not only about an individual's absolute financial resources, but also about life experiences that affect their income, the potential instability related to life events, and subsequently long term health. Upward social mobility is associated with decreased CVD mortality risk, even among high income adults. Concurrently, long term exposure to low socioeconomic conditions was associated with increased CVD mortality risk. Our work suggests that variability in SEP over the adult life course may also contribute to CVD mortality risk. Future work should continue to investigate measures that capture the variation in social mobility over the life course, Understanding these associations may aid in identifying specific periods of the adult life course in which maintenance of reasonable access to resources may have a lasting positive influence on health in subsequent years.
Acknowledgments
This work was supported by the National Institutes of Health (5R37AG011375 and R24 HD047861 to G.A.K.) and the Rackham Merit Fellowship, University of Michigan (V.D.J.L.).
Footnotes
Publisher's Disclaimer: This is a PDF file of an unedited manuscript that has been accepted for publication. As a service to our customers we are providing this early version of the manuscript. The manuscript will undergo copyediting, typesetting, and review of the resulting proof before it is published in its final citable form. Please note that during the production process errors may be discovered which could affect the content, and all legal disclaimers that apply to the journal pertain.
References
- 1.Beebe-Dimmer J, Lynch J, Turrell G, Lustgarten S, Raghunathan T, Kaplan G. Childhood and adult socioeconomic conditions and 31-year mortality risk in women. American Journal of Epidemiology. 2004;159(5):481–90. doi: 10.1093/aje/kwh057. [DOI] [PubMed] [Google Scholar]
- 2.Davey Smith G, Hart C. Life-course socioeconomic and behavioral influences on cardiovascular disease mortality: The Collaborative Study. American Journal of Public Health. 2002;92:1295–8. doi: 10.2105/ajph.92.8.1295. [DOI] [PMC free article] [PubMed] [Google Scholar]
- 3.Pollitt R, Rose K, Kaufman J. Evaluating the evidence for models of life course socioeconomic factors and cardiovascular outcomes: a systematic review. BMC Public Health. 2005;5(7) doi: 10.1186/1471-2458-5-7. [DOI] [PMC free article] [PubMed] [Google Scholar]
- 4.Lemelin E, Diez-Roux A, Franklin T, Carnethon M, Lutsey P, H N, et al. Life-course socioeconomic positions and subclinical atherosclerosis in the multi-ethnic study of atherosclerosis. Social Science & Medicine. 2009;68:444–51. doi: 10.1016/j.socscimed.2008.10.038. [DOI] [PMC free article] [PubMed] [Google Scholar]
- 5.Davey Smith G, Hart C, Blane D, Hole D. Adverse socioeconomic conditions in childhood and cause specific adult mortality: prospective observational study. BMJ. 1998;316(7145):1631–5. doi: 10.1136/bmj.316.7145.1631. Epub 1998/06/17. [DOI] [PMC free article] [PubMed] [Google Scholar]
- 6.Lee J, Paultre F, Mosca L. The association between educational level and risk of cardiovascular disease fatality among women with cardiovascular disease. Womens Health Issues. 2005;15(2):80–8. doi: 10.1016/j.whi.2004.11.004. [DOI] [PubMed] [Google Scholar]
- 7.Murray ET, Mishra GD, Kuh D, Guralnik J, Black S, Hardy R. Life course models of socioeconomic position and cardiovascular risk factors: 1946 birth cohort. Ann Epidemiol. 2011;21(8):589–97. doi: 10.1016/j.annepidem.2011.04.005. Epub 2011/07/09. [DOI] [PMC free article] [PubMed] [Google Scholar]
- 8.Lynch J, Smith GD. A life course approach to chronic disease epidemiology. Annual review of public health. 2005:1–35. doi: 10.1146/annurev.publhealth.26.021304.144505. [DOI] [PubMed] [Google Scholar]
- 9.Hallqvist J, Lynch J, Bartley M, T L, D B. Can we disentangle life course processes of accumulation, critical period, and social mobility? An analysis of disadvantaged socio-economic positions and myocardial infarction in the Stockholm Heart Epidemiology Program. Soc Sci Med. 2004;58:1555–62. doi: 10.1016/S0277-9536(03)00344-7. [DOI] [PubMed] [Google Scholar]
- 10.Tiikkaja S, Hemstrom O. Does intergenerational social mobility among men affect cardiovascular mortality? A population-based register study from Sweden. Scand J Public Health. 2008;36(6):619–28. doi: 10.1177/1403494808090635. Epub 2008/09/09. [DOI] [PubMed] [Google Scholar]
- 11.Tiikkaja S, Hemstrom O, Vagero D. Intergenerational class mobility and cardiovascular mortality among Swedish women: A population-based register study. Soc Sci Med. 2009;68(4):733–9. doi: 10.1016/j.socscimed.2008.11.017. Epub 2008/12/19. [DOI] [PubMed] [Google Scholar]
- 12.Gunasekara FI, Carter K, Blakely T. Change in income and change in self-rated health: Systematic review of studies using repeated measures to control for confounding bias. Social Science & Medicine. 2011;72(2):193–201. doi: 10.1016/j.socscimed.2010.10.029. [DOI] [PubMed] [Google Scholar]
- 13.McDonough P, Duncan GJ, Williams D, House J. Income dynamics and adult mortality in the United States, 1972 through 1989. American Journal of Public Health. 1997;87(9):1476–83. doi: 10.2105/ajph.87.9.1476. [DOI] [PMC free article] [PubMed] [Google Scholar]
- 14.Kaplan GA, Shema SJ, Leite CM. Socioeconomic determinants of psychological well-being: the role of income, income change, and income sources during the course of 29 years. Ann Epidemiol. 2008;18(7):531–7. doi: 10.1016/j.annepidem.2008.03.006. Epub 2008/05/28. [DOI] [PMC free article] [PubMed] [Google Scholar]
- 15.Cerda M, Johnson-Lawrence VD, Galea S. Lifetime income patterns and alcohol consumption: Investigating the association between long- and short-term income trajectories and drinking. Social Science & Medicine. 2011;73:1178–85. doi: 10.1016/j.socscimed.2011.07.025. [DOI] [PMC free article] [PubMed] [Google Scholar]
- 16.Chaix B, Isacsson S-O, Rastam L, Lindstrom M, Merlo J. Income change at retirement, neighbourhood-based social support, and ischaemic heart disease: Results from the prospective cohort study “Men born in 1914”. Social Science & Medicine. 2007;64(4):818–29. doi: 10.1016/j.socscimed.2006.10.018. [DOI] [PubMed] [Google Scholar]
- 17.Berkman L, Breslow L. Health and Ways of Living: The Alameda County Study. Oxford Universty Press; New York: 1983. [Google Scholar]
- 18.Kaplan GA, Baltrus PT, Raghunathan TE. The shape of health to come: prospective study of the determinants of 30-year health trajectories in the Alameda County Study. Int J Epidemiol. 2007;36(3):542–8. doi: 10.1093/ije/dym008. Epub 2007/03/23. [DOI] [PubMed] [Google Scholar]
- 19.Hochstim J. The community as an epidemiologic laboratory. In: KIaL ML, editor. Health and ways of living-- The Alameda County, California, Population Laboratory. Johns Hopkins University Press; Baltimore: 1970. [Google Scholar]
- 20.Bureau of Labor Statistics UCB . Current population survey: design and methodology. US Department of Labor and US Department of Commerce; 2002. Technical Paper No.: 63RV. [Google Scholar]
- 21.Raghunathan T, Lepkowski J, Van Hoewyk J, Solenberger P. A multivariate technique for multiple imputing missing values using a sequence of regression models. Survey Methodology. 2001;27:12. [Google Scholar]
- 22.Baltrus P, Lynch J, Everson Rose S, Raghunathan T, Kaplan G. Race/ethnicity, life-course socioeconomic position, and body weight trajectories over 34 years: the Alameda County Study. American Journal of Public Health. 2005;95(9):1595–601. doi: 10.2105/AJPH.2004.046292. Epub 2005/07/30. [DOI] [PMC free article] [PubMed] [Google Scholar]
- 23.Baltrus PT, Lynch JW, Everson-Rose S, Raghunathan TE, Kaplan GA. Race/ethnicity, life-course socioeconomic position, and body weight trajectories over 34 years: the Alameda County Study. Am J Public Health. 2005;95(9):1595–601. doi: 10.2105/AJPH.2004.046292. Epub 2005/07/30. [DOI] [PMC free article] [PubMed] [Google Scholar]
- 24.Raghunathan T. What do we do with missing data? Some options for analysis of incomplete data. Annual Review of Publich Health. 2004;25:99–117. doi: 10.1146/annurev.publhealth.25.102802.124410. [DOI] [PubMed] [Google Scholar]
- 25.Figini P. Measuring inequality: on the correlation between indices. Luxembourg Income Study Working Paper No 229. 2000 [Google Scholar]
- 26.Jones B, Nagin D, Roeder K. A SAS procedure based on mixture models for estimating developmental trajectories. Sociological Methods and Research. 2001;29:374–93. [Google Scholar]
- 27.Jones B, Nagin D. Advances in Group-Based Trajectory Modeling and an SAS Preocdure for Estimating Them. Sociological Methods and Research. 2007;35:542–71. [Google Scholar]
- 28.Lynch J, Kaplan G, Cohen R, Tuomilehto J, Salonen J. Do cardiovascular risk factors explain the relation between socioeconomic status, risk of all-cause mortality, cardiovascular mortality, and acute myocardial infarction? American Journal of Epidemiology. 1996;144(10):934–42. doi: 10.1093/oxfordjournals.aje.a008863. [DOI] [PubMed] [Google Scholar]
- 29.Peres MA, Peres KG, Thomson WM, Broadbent JM, Gigante DP, Horta BL. The Influence of Family Income Trajectories From Birth to Adulthood on Adult Oral Health: Findings From the 1982 Pelotas Birth Cohort. American Journal of Public Health. 2011;101(4):730–6. doi: 10.2105/AJPH.2009.184044. [DOI] [PMC free article] [PubMed] [Google Scholar]
- 30.Do DP. The dynamics of income and neighborhood context for population health: Do long-term measures of socioeconomic status explain more of the black/white health disparity than single-point-in-time measures? Social Science & Medicine. 2009;68(8):1368–75. doi: 10.1016/j.socscimed.2009.01.028. [DOI] [PMC free article] [PubMed] [Google Scholar]
- 31.Kozyrskyj A, Kendall G, Jacoby P, Sly P, Zubrick S. Association Between Socioeconomic Status and the Development of Asthma: Analyses of Income Trajectories. American Journal of Public Health. 2010;100(3):540–6. doi: 10.2105/AJPH.2008.150771. [DOI] [PMC free article] [PubMed] [Google Scholar]
- 32.Waite LJ. Does marriage matter? Demography. 1995;32(4):483–507. [PubMed] [Google Scholar]
- 33.Lehman RI. Marriage and the economic well-being of families with children: a review of the literature. Urban Institute and American University; Washington, DC: 2002. [Google Scholar]
- 34.Roger VL, Go AS, Lloyd-Jones DM, Benjamin EJ, Berry JD, Borden WB, et al. Executive Summary: Heart Disease and Stroke Statistics-2012 Update A Report From the American Heart Association. Circulation. 2012;125(1):188–97. doi: 10.1161/CIR.0b013e3182456d46. [DOI] [PubMed] [Google Scholar]
- 35.Eliason M. Income after job loss: the role of the family and the welfare state. Applied Economics. 2009;43(5):603–18. [Google Scholar]
- 36.Pollack CE, Chideya S, Cubbin C, Williams B, Dekker M, Braveman P. Should health studies measure wealth? A systematic review. Am J Prev Med. 2007;33(3):250–64. doi: 10.1016/j.amepre.2007.04.033. [DOI] [PubMed] [Google Scholar]