


Abstract
Secondary structure of messenger RNA plays an important role in the bio-synthesis of proteins. Its negative impact on translation can reduce the yield of protein by slowing or blocking the initiation and movement of ribosomes along the mRNA, becoming a major factor in the regulation of gene expression. Several algorithms can predict the formation of secondary structures by calculating the minimum free energy of RNA sequences, or perform the inverse process of obtaining an RNA sequence for a given structure. However, there is still no approach to redesign an mRNA to achieve minimal secondary structure without affecting the amino acid sequence. Here we present the first strategy to optimize mRNA secondary structures, to increase (or decrease) the minimum free energy of a nucleotide sequence, without changing its resulting polypeptide, in a time-efficient manner, through a simplistic approximation to hairpin formation. Our data show that this approach can efficiently increase the minimum free energy by >40%, strongly reducing the strength of secondary structures. Applications of this technique range from multi-objective optimization of genes by controlling minimum free energy together with CAI and other gene expression variables, to optimization of secondary structures at the genomic level.
INTRODUCTION
Among the many factors that influence gene translation, the role of mRNA secondary structure has long been shown to be of major importance (1–3). For instance, regulation of gene expression is highly dependent on the formation of stable structures by nucleotide pairing in the mRNA strand. This is especially true when the structures encompass translation initiation regions, hence hampering the start of the decoding process (4,5).
The formation of stem–loops and more complex structures occurs on RNA folding on itself, causing secondary and tertiary nucleotide interactions, the stability of which is dependent on the nucleotides involved and the length of the interacting domains. The strength of two paired bases is largely determined by the number of hydrogen bonds that connect the nucleotides: guanine–cytosine pairs share three hydrogen bonds, and adenine–uracil pairs have only two; the wobble base pair guanine–uracil also shares two hydrogen bonds. Longer paired zones and stronger-paired zones tend to be more stable, and therefore have higher melting temperatures, preventing the ribosome from breaking the pairing and proceeding translation (3,6).
Several recent studies have demonstrated that manipulating RNA sequences to avoid secondary structures has a substantial impact on gene expression. In the study by Studer and Joseph (6), the authors changed several mRNA sequences to control the presence and strength of secondary structures near translation initiation sites, and showed a significant negative correlation between the strength of the structures and mRNA ease of association with the ribosome. Moreover, sequences with no secondary structures associated faster with the 30S ribosomal subunit, and therefore were more likely to form stable initiation complexes, which are determinant for translation efficiency. Analogous results were obtained by studying the expression of human interleukin-10 and human interferon-α in Escherichia coli. Introducing silent mutations to expose the start codon from secondary structures effectively improved translation and heterologous expression of both proteins by 10-fold (5). Similarly, a study showed how the L1 gene from human papillomavirus type 16 was modified to avoid the formation of secondary structures when expressed in Saccharomyces cerevisiae, again yielding 4-fold higher expression than the wild type (7).
Assessment of RNA secondary structures and minimum free energy (MFE) can be accomplished via numerous algorithms and approaches to structure prediction (8–11). The most sophisticated and well known is the fast dynamic programming approach from Zuker and Stiegler (12), which is based on a first approach from Nussinov et al. (13), and served as a basis for recent methods. Their algorithm attempts to find the structural base-pair configuration of an RNA sequence that yields the minimum possible free energy. Implementations of this algorithm can be found in the mFold (11) or Vienna RNA (14) software packages. Other applications focus on performing inverse RNA folding, to produce nucleotide configurations for a given secondary structure, regardless of any gene, such as the RNAexinv (15), INFO-RNA (16) and RNA-SSD (17) tools. However, no method can yet perform the process of obtaining an mRNA sequence that maintains the polypeptide primary structure and achieves minimal secondary structure. This gap is likely due to the difficulty in finding the codon-sequence configuration with the highest MFE, requiring calculation of the MFE numerous times, which is an unfeasible task time-wise.
Here we focus on the problem of avoiding stable secondary structures in mRNA molecules by means of maximizing the MFE of the nucleotide sequences, without changing the resulting amino acid sequence. For this, we have developed an algorithm that divides in 2-fold: a first part that uses a metaheuristic approach to explore the space of possible synonymous codon sequences, and a second part where a fast algorithm calculates a metric that is linearly dependent on the MFE. Thus, the core of our approach resides in computing a pseudo-MFE using a fast method the results of which, although not as accurate as current predictors, are highly correlated with MFE. When searching for a synonymous sequence using the metaheuristic approach, the pseudo-MFE is used to look for configurations that offer high values of MFE.
Results show that using our approach, the MFE of an mRNA strand can be increased by >40%, strongly reducing the strength of secondary structures, in only a few seconds. Besides single gene optimization, this strategy can also be used to perform large-scale studies on secondary structures, and can be combined with other optimization approaches, such as CAI, codon context and GC content optimizations, to achieve optimal gene configurations for improving yield and quality of heterologous protein production.
MATERIALS AND METHODS
We consider the problem of having a nucleotide sequence with both coding and non-coding regions, and maximizing the MFE resulting from possible folds, by altering nucleotides in the coding region without altering the amino acid sequence. We take advantage of the degeneracy of the genetic code to search for a synonymous gene sequence that maximizes an energy function highly related to the strength of the secondary structure.
We split the methods in four parts: (i) the search for the best codon combination, (ii) the development of a rapid pseudo-MFE calculation function, (iii) the optimization of that function to maximize its correlation with an accurate MFE measure and (iv) a linear regression to transform the pseudo-MFE values into more precise bounds.
Synonymous gene exploration
Finding an optimal synonymous sequence is a combinatorial problem often impractical to solve in efficient time given the volume of the search space (approximately  for a sequence with
  codons, using the standard genetic code). As a consequence, it becomes attractive to resort to metaheuristics, such as genetic algorithms and simulated annealing, that facilitate the exploration of possible sequences, driving the search through regions of the solution space of interest to the problem.
For the MFE maximization problem, we used Kirkpatrick’s simulated annealing approach (18), which was shown to behave quickly and achieve global maxima results in codon optimization problems (19,20). Thus, starting from the original coding sequence, a number of codons are selected in each iteration to be randomly changed for synonymous ones. The new sequence, including the non-coding regions, is evaluated by the pseudo-energy assessor (described in the following section), which returns a value correlated with the MFE. New sequences with larger values are accepted as the current sequence for the next iteration. However, to avoid local maxima, sequences with lower values might also be accepted, according to a probability mimicking the Boltzmann distribution, defined as:
| (1) |
where  is the energy value of the current sequence,
  the energy of the new sequence,
  the iteration number,
  is the maximum number of iterations and
  is the cooling schedule. The last two parameters were selected after a heuristic assessment to ensure the resulting sequence is near optimal. This formulation allows acceptance of worse solutions at the beginning of the process, and slowly decreasing the acceptance probability until only better solutions are chosen as the algorithm approaches the maximum number of iterations. The number of codons that are changed in each step also decreases with passing iterations, performing only targeted alterations near the end to fine-tune results. The search ends when the maximum number of iterations is reached.
Simplistic approximation to MFE estimation
Current tools for secondary structure estimation can accurately measure the MFE that results from the fold of a nucleotide strand. However, such accuracy is achieved by thoroughly analysing possible secondary structures, and this process takes up to several seconds, depending on the size of the sequence. Although they are generally fast enough for a single run, which is the normal use of these tools, it becomes unfeasibly slow when there is the need for multiple calls, which is the case if one is searching for an optimal configuration of codons and needs to constantly re-evaluate the sequence. For instance, making 1500 calls to RNAfold to evolve an mRNA with 1000 codons (without non-coding regions) takes >6 h (considering an average of 15 s for each call to RNAfold, which is generally a lower bound in a modern personal computer). To overcome this hurdle, we have developed an evaluation function that is much faster at analysing secondary structures, at the expense of less accurate results, and which is highly correlated with the real MFE energy. To reduce the time complexity from the MFE estimation [ for RNAfold and MFold, for sequences of N nucleotides], we introduced a simplistic approach with quadratic complexity, which considers all possible single stem–loop conformations and averages their interaction energy, as described in Algorithm 1.
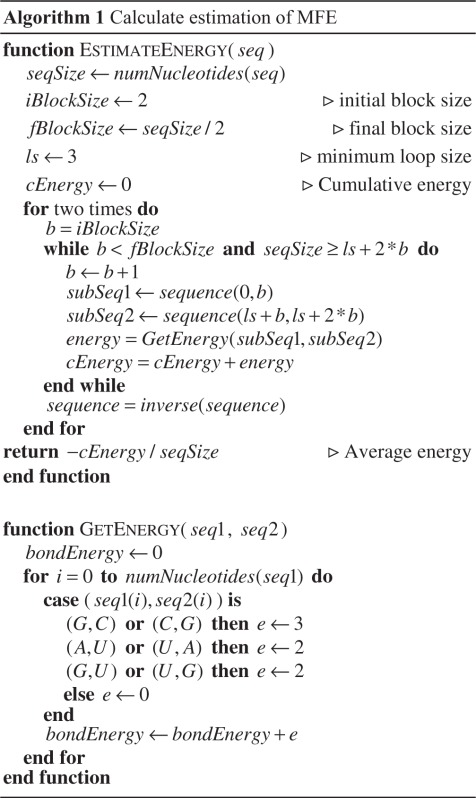
The algorithm considers every possible conformation of the mRNA secondary structure using only a single fold (there are approximately  ) and, for each conformation, looking for nucleotide pairs that bind (Figure 1). The energy of each fold is the number of hydrogen bonds shared in the interaction regions. This method then returns the average energy of all folds. This approximation does not consider more complex conformations of multiple stem–loop structures or pseudo-knots, which require more intricate formulations, nor does it intend to yield an accurate energy value. However, it does assume an abstract value representing the MFE can be obtained from the primary folds of the molecule, and that considering all possible nucleotide interactions further specifies this value to represent a global view of the structure strength. As a result, the algorithm returns a value largely associated with complex MFE predictions.
Figure 1.

Ilustration of the MFE estimation algorithm. All possible folds of a single stem–loop are considered, starting from the 3′ end. In each fold, the nucleotides close to the folding region are not considered to interact. The average of the nucleotide-pair contributions of all folds is the result.
Fine-tuning nucleotide interactions
To further enhance the statistical dependence of our estimation function with an accurate MFE measure, we chose the output of RNAfold as a target for our function, which offers the current highest performance (0.76 F1-measure) among single-strand secondary structure predictors (9), and the fastest calculation (see comparison in Supplementary Material). The tuning was made by changing the contribution of each binding pair (‘getEnergy’ function in Algorithm 1) and assessing the correlation between the approximation function and the results from RNAfold. For that, we randomly selected 48 genes from six different species (Aquifex aeolicus, E. coli, Homo sapiens, Mus musculus, Rattus norvegicus and Drosophila melanogaster. Data sets and further details are available in the Supplementary Material), with equal length, As the length of the genes already has a large bias (−97% Pearson correlation) to the MFE. To perform the optimization, we also used a simulated annealing heuristic. Thus, the contribution of GC, AU and GU pairs was changed in each iteration, evaluating their performance by analysing the correlation between our MFE estimation function and RNAfold’s output in the 48 genes. Correlations were measured using Spearman’s rank correlation coefficient, which focuses on measuring the extent to which as our function increases the RNAfold MFE also increases, using Formula 2.
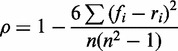 |
(2) |
Where  is the rank of the value of our approximation function,
  the rank of RNAfold’s output and
  is the number of sequences used (48 genes). This allows the search algorithm to find binding-pair weights that maximize the dependence to the target output.
Using this method, we increased the initial correlation of 0.73 to 0.91, by changing the pair weights from (2, 2, 3) for AU, GU and CG into (1, 1, 3.12). We further confirmed a high linear dependence using Person’s product-moment correlation coefficient, which also returned 0.91.
Linear regression
Given the large linear dependence that was created in the previous step, we were able to easily transform the values returned by the MFE estimation function to closely resemble those of an accurate MFE. Although this step is not necessary and does not change the final correlation nor the optimization results, the transformed values become visibly comparable with those of accurate measures, allowing quick assessment and comparison of MFE values.
Using ordinary least squares, we performed a simple linear regression using the energy values of Algorithm 1 as the input variable and the MFE given by RNAfold as the observed variable. To better predict MFE, we created two regressions, the first for the wild-type genes and the second for optimized genes (see Supplementary Material for formulas and results).
RESULTS
To test and evaluate our correlated optimization approach, we randomly selected 36 different genes from the same species used in the previous section. By using a different set of genes, we avoid biases that might have been generated when tuning the estimation function. To perform an initial assessment, we evaluated all genes using both our approximation function and RNAfold, and obtained a Pearson’s correlation of 0.99, indicating a perfect statistical dependence between the two approaches. The increase in correlation compared with the results obtained during training is justified by the use of a gene set with random lengths, as opposed to fixed length, which limited the bias.
We proceeded to the evaluation of secondary structure optimization by applying our method to the 36 genes and then re-evaluating them with RNAfold to assess evolution (Figure 2a). By analysing the difference between the results of wild-type genes and optimized genes, we measured an average of 46% increase in the MFE, with a t-test probability of 3 × 10⁻¹¹. As an example, one of the largest evolutions (67%) increased the MFE from −175 to −58 kcal/mol, strongly diminishing the predicted secondary structures. In this optimization, the number of base pairs of the resulting RNA was reduced by 54%, and particularly the number of GC pairs decreased by 60%, as depicted in Figure 2b and c.
Figure 2.
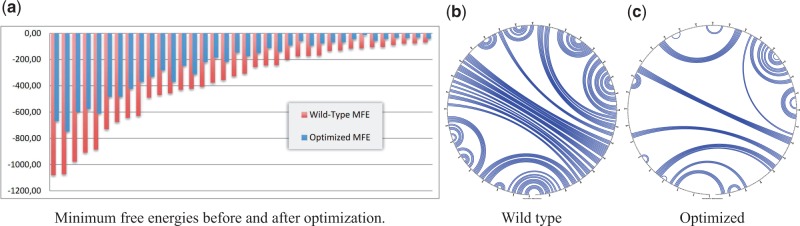
Optimization results. In (a) the improvement for each gene is shown. In (b) and (c) the secondary structures of a Drosophila melanogaster gene are shown for the wild type and optimized mRNAs.
To understand the algorithm bias relative to the amount of guanine and cytosine in genes, which are the nucleotides that produce the strongest pair, we have evaluated GC content before and after optimization, measuring an average of 24% decrease, although weakly correlated to the MFE improvement of each gene. We then assessed the role of GC content by adding a rule to our optimization algorithm to evolve genes into configurations that simultaneously increase MFE and maintain the same percentage of GC as the wild type. Results show MFE improvements averaging 28%, without any change in GC content, which represents a 17% decrease in improvement when compared with the original optimization. This suggests that the main contributing factor to our algorithm is codon configuration, although GC content also has a significant role.
Furthermore, to control for GC content and assess its impact on optimization, 36 genes with equal amount of GC (50%) were randomly selected from the same species (available in Supplementary Material), and optimized using our approach. Improvements in MFE averaged 43% (t-test probability of  ), with results still showing a large correlation between values of RNAfold and our approach (
 ). Also, by adding the previous rule to maintain the same GC% amounts of the wild type, we measured improvements in MFE averaging 29%, with a t-test probability of 1 × 10⁻¹⁰.
Considering that our MFE evaluation function is faster but less accurate than RNAfold, we compared our approach with that of optimizing a codon sequence using the same strategy but with RNAfold as the MFE estimation function instead of our correlated method, to deduce the loss in accuracy and gain in time. For that, we used the simulated annealing method with the same parameters, replacing only the energy evaluation function by a call to RNAfold. We then performed the optimization in the set of 36 genes (random GC% and length) and collected results for comparison. All final results, from both approaches, were measured afterwards using RNAfold, to build a reliable comparable basis between methods. We found a small gain of 2%, which is close to being statistically insignificant (t-test probability of 0.003), with >35% of the genes having similar or worse results than our approach. Also, higher differences were only found in smaller genes (for genes larger than 250 codons, the gain was null), suggesting that as the problem becomes more complex, our approach obtains equivalent results to using RNAfold. However, being of quadratic time complexity, our approach took only 34 min to optimize the 36 genes ( 1 min per gene), whereas using RNAfold took >6 days (
 4 h per gene) (in a computer with Windows Server 2008, 2.67-GHz 4-core Intel Xeon and 4-GB RAM). Parallelizing the process leads to bounding the problem to the longest optimization, which was 4 min using our approach and 22 h using RNAfold. Thus, having no significant loss, and gains in time up to several hundred times, our strategy becomes a feasible approach to optimizing RNA secondary structure.
CONCLUSION
The study of RNA secondary structures is an important area of research in computational molecular biology. Specifically, structure prediction and MFE calculation are prominent subjects in recent RNA literature. Being able to predict the formation of structures has allowed researchers to understand how RNA functions, whereas reverse RNA folding has allowed building non-coding RNAs that have a specific structure. However, considering the impact of secondary structures on gene translation, a strategy to redesign genes to produce less structured mRNAs that would allow for improved or controlled expression is important.
We presented the first approach to optimizing the secondary structure of mRNA sequences using a fast correlated MFE estimation method. Although the estimation algorithm was not built for maximum accuracy, results are closely associated with those of using accurate methods, such as RNAfold, allowing for rapid calculation of synonymous genes with improved structures. Overall, our tests indicate an average of >40% improvement in MFE, as measured by RNAfold.
Besides allowing the optimization of mRNA sequences alone, our method can be used in combination with other factors that influence gene expression, such as codon usage, harmonization and GC content, to optimize the in silico engineering of recombinant genes for heterologous expression.
To promote the use of our approach, we produced a software application that implements the optimization process, which is available at http://bioinformatics.ua.pt/software/mRNA-optimiser
SUPPLEMENTARY DATA
Supplementary Data are available at NAR Online: Supplementary Material.
FUNDING
The European FP7 projects GEN2PHEN and Mephitis; FCT/FEDER project [PTDC/BiA-GEN/110383/2009]; Fundação para a Ciência e Tecnologia (FCT) [SFRH/BD/71063/2010 to P.G.]. Funding for open access charge: GEN2PHEN.
Conflict of interest statement. None declared.
Supplementary Material
REFERENCES
- 1.de Smit MH, van Duin J. Control of translation by mRNA secondary structure in Escherichia coli: a quantitative analysis of literature data. J. Mol. Biol. 1994;244:144–150. doi: 10.1006/jmbi.1994.1714. [DOI] [PubMed] [Google Scholar]
- 2.Hall MN, Gabay J, Débarbouillé M, Schwartz M. A role for mRNA secondary structure in the control of translation initiation. Nature. 1982;295:616–618. doi: 10.1038/295616a0. [DOI] [PubMed] [Google Scholar]
- 3.Kozak M. Influences of mRNA secondary structure on initiation by eukaryotic ribosomes. Proc. Natl. Acad. Sci. USA. 1986;83:2850. doi: 10.1073/pnas.83.9.2850. [DOI] [PMC free article] [PubMed] [Google Scholar]
- 4.Kozak M. Initiation of translation in prokaryotes and eukaryotes. Gene. 1999;234:187–208. doi: 10.1016/s0378-1119(99)00210-3. [DOI] [PubMed] [Google Scholar]
- 5.Zhang W, Xiao W, Wei H, Zhang J, Tian Z. mRNA secondary structure at start AUG codon is a key limiting factor for human protein expression in Escherichia coli. Biochem. Biophys. Res. Commun. 2006;349:69–78. doi: 10.1016/j.bbrc.2006.07.209. [DOI] [PubMed] [Google Scholar]
- 6.Studer SM, Joseph S. Unfolding of mRNA secondary structure by the bacterial translation initiation complex. Mol. Cell. 2006;22:105–115. doi: 10.1016/j.molcel.2006.02.014. [DOI] [PubMed] [Google Scholar]
- 7.Kim HJ, Lee SJ, Kim HJ. Optimizing the secondary structure of human papillomavirus type 16 l1 mRNA enhances l1 protein expression in Saccharomyces cerevisiae. J. Biotechnol. 2010;150:31–36. doi: 10.1016/j.jbiotec.2010.07.032. [DOI] [PubMed] [Google Scholar]
- 8.Knudsen B, Hein J. Pfold: RNA secondary structure prediction using stochastic context-free grammars. Nucleic Acids Res. 2003;31:3423–3428. doi: 10.1093/nar/gkg614. [DOI] [PMC free article] [PubMed] [Google Scholar]
- 9.Lorenz R, Bernhart SH, zu Siederdissen CH, Tafer H, Flamm C, Stadler PF, Hofacker IL. ViennaRNA Package 2.0. Algorithms Mol. Biol. 2011;6:26. doi: 10.1186/1748-7188-6-26. [DOI] [PMC free article] [PubMed] [Google Scholar]
- 10.Sun Y, Ye SH, Lu HW. Study of RNA secondary structure prediction algorithms. Adv. Mater. Res. 2012;393:955–960. [Google Scholar]
- 11.Zuker M. Mfold web server for nucleic acid folding and hybridization prediction. Nucleic Acids Res. 2003;31:3406–3415. doi: 10.1093/nar/gkg595. [DOI] [PMC free article] [PubMed] [Google Scholar]
- 12.Zuker M, Stiegler P. Optimal computer folding of large RNA sequences using thermodynamics and auxiliary information. Nucleic Acids Res. 1981;9:133. doi: 10.1093/nar/9.1.133. [DOI] [PMC free article] [PubMed] [Google Scholar]
- 13.Nussinov R, Jacobson AB. Fast algorithm for predicting the secondary structure of single-stranded RNA. Proc. Natl. Acad. Sci. USA. 1980;77:6309. doi: 10.1073/pnas.77.11.6309. [DOI] [PMC free article] [PubMed] [Google Scholar]
- 14.Hofacker IL. Vienna RNA secondary structure server. Nucleic Acids Res. 2003;31:3429–3431. doi: 10.1093/nar/gkg599. [DOI] [PMC free article] [PubMed] [Google Scholar]
- 15.Avihoo A, Churkin A, Barash D. RNAexinv: an extended inverse RNA folding from shape and physical attributes to sequences. BMC Bioinformatics. 2011;12:319. doi: 10.1186/1471-2105-12-319. [DOI] [PMC free article] [PubMed] [Google Scholar]
- 16.Busch A, Backofen R. Info-RNA—a server for fast inverse RNA folding satisfying sequence constraints. Nucleic Acids Res. 2007;35(Suppl. 2):W310–W313. doi: 10.1093/nar/gkm218. [DOI] [PMC free article] [PubMed] [Google Scholar]
- 17.Andronescu M, Fejes AP, Hutter F, Hoos HH, Condon A. A new algorithm for RNA secondary structure design. J. Mol. Biol. 2004;336:607–624. doi: 10.1016/j.jmb.2003.12.041. [DOI] [PubMed] [Google Scholar]
- 18.Kirkpatrick S, Gelatt CD, Jr, Vecchi MP. Optimization by simulated annealing. Science. 1983;220:671–680. doi: 10.1126/science.220.4598.671. [DOI] [PubMed] [Google Scholar]
- 19.Oliveira J, Gaspar P. Advantages of a pareto-based genetic algorithm to solve the gene synthetic design problem. Curr. Bioinformatics. 2012;7:304–309. [Google Scholar]
- 20.Gaspar P, Oliveira JL, Frommlet J, Santos MA, Moura G. Eugene: maximizing synthetic gene design for heterologous expression. Bioinformatics. 2012;28:2683–2684. doi: 10.1093/bioinformatics/bts465. [DOI] [PubMed] [Google Scholar]
Associated Data
This section collects any data citations, data availability statements, or supplementary materials included in this article.