


Abstract
Meiotic recombination is an important biological process. As a main driving force of evolution, recombination provides natural new combinations of genetic variations. Rather than randomly occurring across a genome, meiotic recombination takes place in some genomic regions (the so-called ‘hotspots’) with higher frequencies, and in the other regions (the so-called ‘coldspots’) with lower frequencies. Therefore, the information of the hotspots and coldspots would provide useful insights for in-depth studying of the mechanism of recombination and the genome evolution process as well. So far, the recombination regions have been mainly determined by experiments, which are both expensive and time-consuming. With the avalanche of genome sequences generated in the postgenomic age, it is highly desired to develop automated methods for rapidly and effectively identifying the recombination regions. In this study, a predictor, called ‘iRSpot-PseDNC’, was developed for identifying the recombination hotspots and coldspots. In the new predictor, the samples of DNA sequences are formulated by a novel feature vector, the so-called ‘pseudo dinucleotide composition’ (PseDNC), into which six local DNA structural properties, i.e. three angular parameters (twist, tilt and roll) and three translational parameters (shift, slide and rise), are incorporated. It was observed by the rigorous jackknife test that the overall success rate achieved by iRSpot-PseDNC was >82% in identifying recombination spots in Saccharomyces cerevisiae, indicating the new predictor is promising or at least may become a complementary tool to the existing methods in this area. Although the benchmark data set used to train and test the current method was from S. cerevisiae, the basic approaches can also be extended to deal with all the other genomes. Particularly, it has not escaped our notice that the PseDNC approach can be also used to study many other DNA-related problems. As a user-friendly web-server, iRSpot-PseDNC is freely accessible at http://lin.uestc.edu.cn/server/iRSpot-PseDNC.
INTRODUCTION
Genetic recombination describes the generation of new combinations of alleles that occurs at each generation in diploid organisms. It is an important biological process and results from a physical exchange of chromosomal material (1). As a main driving force of evolution, recombination provides new combinations of genetic variations and accelerates the evolution of sexual reproductive organisms. A schematic illustration to show the meiotic recombination pathways is given in Figure 1.
Figure 1.

A schematic drawing to show the meiotic recombination pathways in a DNA system. Recombination is initiated by a double-strand break (DSB) catalysed by the Spo11 protein (green ball), a relative of archaeal topoisomerase VI. After DSBs are formed, Spo11 is removed from the DNA molecule (blue helix) and the single-stranded 3′ ends are formed. These tails undergo strand invasion of intact homologous duplexes (red helix), ultimately yielding mature recombinant products. The repair of meiotic DSB can result in either reciprocal exchange of the chromosome arms flanking the break (a crossover) as shown in the left lower panel, or no exchange of flanking arms (a non-crossover or parental configuration) as shown in the right lower panel. Adapted from (2).
As recombination is crucial to genome evolution, identification and characterization of recombination spots are substantially important. In the past decades, several global mapping studies have been performed to map double-strand breaks sites on chromosomes in yeast to determine the distribution pattern of recombination regions across genome (3–5). They found that meiotic recombination events generally concentrate in  kilobase regions and does not occur randomly across the genome. Regions that exhibit elevated rates of recombination relative to a neutral expectation are called recombination hotspots, whereas those with low rates of recombination are recombination coldspots. Additionally, they also found that recombination regions do not share a consensus sequence. With the rapid increasing number of sequenced genomes, it is highly desired to develop reliable automated methods for timely identifying the recombination spots.
Although considerable progress has been made in this regard, the computational predictive accuracy of recombination spots still needs further improvements. The existing computational algorithm for recombination spots prediction was based on the nucleotide sequence contents (6), in which little sequence-order effect was taken into account. To improve the prediction quality, it is necessary to take into account this kind of effect. However, the number of possible patterns for DNA sequences is extremely large, and their lengths vary widely, making it difficult to incorporate the sequence-order information into a statistical predictor. Facing such a difficulty, how can we take into account the sequence-order effect to improve the prediction quality? If it is not feasible to count all the sequence-order information, can we find an approximate way to partially take into account it? Similar problems were also encountered in computational proteomics. To cope with this kind of problems, the concept of pseudo amino acid composition (PseAAC) was proposed by Chou (7). Since then, the concept of PseAAC has penetrated into almost all the fields of computational proteomics, such as predicting protein submitochondrial localization (8), predicting protein structural class (9), predicting DNA-binding proteins (10), identifying bacterial virulent proteins (11), predicting metalloproteinase family (12), predicting protein folding rate (13), predicting GABA(A) receptor proteins (14), predicting protein supersecondary structure (15), predicting cyclin proteins (16), classifying amino acids (17), predicting enzyme family class (18), identifying risk type of human papillomaviruses (19), predicting allergenic proteins (20), identifying G protein-coupled receptors and their types (21) and discriminating outer membrane proteins (22), among many others [see a long list of references cited in a review (23)]. Because of its wide and increasing usage, in 2012, a powerful software called PseAAC-Builder (http://www.pseb.sf.net) (24) was established for generating various special modes of PseAAC, in addition to the earlier web-server PseAAC (http://www.csbio.sjtu.edu.cn/bioinf/PseAAC) (25) built in 2008.
Encouraged by the successes of introducing the PseAAC approach (7,26) into computational proteomics, the present study was initiated in an attempt to propose a novel feature vector, called ‘pseudo dinucleotide composition’ (PseDNC), to represent DNA sequence samples by incorporating more sequence-order effects so as to improve the quality of predicting the recombination spots.
As summarized in a review (23) and demonstrated by a series of recent publications [see, e.g. (27–29)], to establish a really useful statistical predictor for a biological system, we need to consider the following procedures: (i) construct or select a valid benchmark data set to train and test the predictor; (ii) formulate the biological samples with an effective mathematical expression that can truly reflect their intrinsic correlation with the target to be predicted; (iii) introduce or develop a powerful algorithm (or engine) to operate the prediction; (iv) properly perform cross-validation tests to objectively evaluate the anticipated accuracy of the predictor; and (v) establish a user-friendly web-server for the predictor that is accessible to the public. Below, let us elaborate how to deal with these procedures one by one.
MATERIALS AND METHODS
Benchmark data set
The benchmark data set  for the recombination hotspots and coldspots was taken from Liu et al. (6). It contains 490 recombination hotspots and 591 recombination coldspots, as can be formulated by
| (1) |
where  represents the symbol for ‘union’ in the set theory; the subset
  contains the recombination hotspots only, whereas
  recombination coldspots only. For the convenience of readers, the 490 sequences in
  and 591 sequences in
  are given in the Supplementary Information S1.
PseDNC
Suppose a DNA sequence D with L nucleic acid residues; i.e.
| (2) |
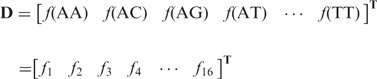
where R1 represents the nucleic acid residue at the sequence position 1, R2 the nucleic acid residue at position 2 and so forth. If the feature vector of the DNA sequence is formulated by its nucleic acid composition (NAC), we have
| (3) |
where  ,
,  ,
,  , and
, and  are the normalized occurrence frequencies of adenine (A), cytosine (C), guanine (G) and thymine (T), respectively, in the DNA sequence; the symbol
  is the transpose operator. As we can see from Equation 3, all the sequence-order information is missed if using NAC to represent a DNA sequence. If using the DNC to represent the DNA sequence, instead of the four components as shown in Equation 3, the corresponding feature vector will contain
  components, as given below
 |
(4) |
where  is the normalized occurrence frequency of AA in the DNA sequence;
  , that of AC;
  , that of AG and so forth. Although the most contiguous local sequence-order information is included in Equation 4, none of the global sequence-order information is reflected by the formulation. DNC is the most simple pseudo NAC, or PseNAC, according to the terminology similar to that used in (7).
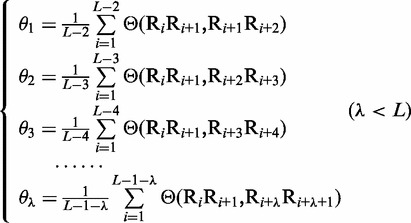
To incorporate the global sequence-order information into the feature vector for the DNA sequence, let us consider the following approach. As shown in Equation 2, the first dinucleotide in the DNA sequence is R1R2, the second dinucleotide is R2R3 and so forth; the last one is RL-1RL. Thus, by following the similar procedures as described in (7) to reflect the global sequence-order information of a protein with a set of sequence-order-correlated factors, for the DNA sequence of Equation 2, we also have the corresponding factors as defined below:
 |
(5) |
where θ1 is called the first-tier correlation factor that reflects the sequence-order correlation between all the most contiguous dinucleotide along a DNA sequence (Figure 2a); θ2, the second-tier correlation factor between all the second most contiguous dinucleotide (Figure 2b); θ3, the third-tier correlation factor between all the third most contiguous dinucleotide (Figure 2c) and so forth.
Figure 2.

A schematic illustration to show the correlations of dinucleotides along a DNA sequence. (a) The first-tier correlation reflects the sequence-order mode between all the most contiguous dinucleotide. (b) The second-tier correlation reflects the sequence-order mode between all the second-most contiguous dinucleotide. (c) The third-tier correlation reflects the sequence-order mode between all the third-most contiguous dinucleotide.
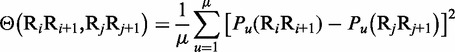
In Equation 5, the parameter λ is an integer, representing the highest counted rank (or tier) of the correlation along a DNA sequence, and the correlation function is given by
 |
(6) |
where  is the number of local DNA structural properties considered that is equal to 6 in the current study as will be explained later in the text;
  , the numerical value of the
 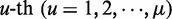 DNA local property for the dinucleotide RiRi+1 at position
  and
and  , the corresponding value for the dinucleotide RjRj+1 at position j.
DNA local structural properties
Multiple lines of evidences have indicated that some local DNA structural properties, i.e. angular parameters (twist, tilt and roll) and translational parameters (shift, slide and rise), have important roles in biological processes, such as protein–DNA interactions, formation of chromosomes and higher-order organization of the genetic material (30–32). Accordingly, these six structural properties might have impact on DNA binding of regulatory proteins, either directly by hampering or favoring complex formation or indirectly through the modulation of the chromatin structures and hence the DNA accessibility (33). Listed in Table 1 are their original numerical values derived from (32) for twist  , tilt
  , roll
  , shift
  , slide
  , and rise
  , respectively, where
  represents the 16 possible dinucleotides AA, AC, AG, AT, …, TT. It was these six DNA local physical structural properties that were to be used as correlation functions to derive the PseDNC for the current study. Meanwhile, it is also self-evident why
  in Equation 6 for the current case.
Table 1.
The original numerical values for the six DNA dinucleotide physical structures
| Dinucleotide | Physical structuresa |
|||||
|---|---|---|---|---|---|---|
 |
 |
 |
 |
 |
 |
|
| AA | 0.026 | 0.038 | 0.020 | 1.69 | 2.26 | 7.65 |
| AC | 0.036 | 0.038 | 0.023 | 1.32 | 3.03 | 8.93 |
| AG | 0.031 | 0.037 | 0.019 | 1.46 | 2.03 | 7.08 |
| AT | 0.033 | 0.036 | 0.022 | 1.03 | 3.83 | 9.07 |
| CA | 0.016 | 0.025 | 0.017 | 1.07 | 1.78 | 6.38 |
| CC | 0.026 | 0.042 | 0.019 | 1.43 | 1.65 | 8.04 |
| CG | 0.014 | 0.026 | 0.016 | 1.08 | 2.00 | 6.23 |
| CT | 0.031 | 0.037 | 0.019 | 1.46 | 2.03 | 7.08 |
| GA | 0.025 | 0.038 | 0.020 | 1.32 | 1.93 | 8.56 |
| GC | 0.025 | 0.036 | 0.026 | 1.20 | 2.61 | 9.53 |
| GG | 0.026 | 0.042 | 0.019 | 1.43 | 1.65 | 8.04 |
| GT | 0.036 | 0.038 | 0.023 | 1.32 | 3.03 | 8.93 |
| TA | 0.017 | 0.018 | 0.016 | 0.72 | 1.20 | 6.23 |
| TC | 0.025 | 0.038 | 0.020 | 1.32 | 1.93 | 8.56 |
| TG | 0.016 | 0.025 | 0.017 | 1.07 | 1.78 | 6.38 |
| TT | 0.026 | 0.038 | 0.020 | 1.69 | 2.26 | 7.65 |
aIn this table, the following symbols were used to represent the six physical structures of dinucleotide (32):  for ‘twist,
  for ‘tilt’,
  for ‘roll’,
  for ‘shift’,
  for ‘slide’ and
  for ‘rise’.
Before substituting into Equation 6, the original values as listed in Table 1 for  , they were all subjected to a standard conversion (26), as described by the following equation
| (7) |
where the symbol < > means taking the average of the quantity therein for 16 different dinucleotides (cf. Equation 4), and SD means the corresponding standard deviation. The converted values obtained by Equation 7 will have a zero mean value for the 16 different dinucleotides and will remain unchanged if going through the same conversion procedure again. Listed in Table 2 are the values of  obtained via the standard conversion of Equation 7 from those of Table 1.
Table 2.
The normalized values for the six DNA dinucleotide physical structures
| Dinucleotide | Physical structuresa |
|||||
|---|---|---|---|---|---|---|
 |
 |
 |
 |
 |
 |
|
| AA | 0.06 | 0.5 | 0.27 | 1.59 | 0.11 | −0.11 |
| AC | 1.50 | 0.50 | 0.80 | 0.13 | 1.29 | 1.04 |
| AG | 0.78 | 0.36 | 0.09 | 0.68 | −0.24 | −0.62 |
| AT | 1.07 | 0.22 | 0.62 | −1.02 | 2.51 | 1.17 |
| CA | −1.38 | −1.36 | −0.27 | −0.86 | −0.62 | −1.25 |
| CC | 0.06 | 1.08 | 0.09 | 0.56 | −0.82 | 0.24 |
| CG | −1.66 | −1.22 | −0.44 | −0.82 | −0.29 | −1.39 |
| CT | 0.78 | 0.36 | 0.09 | 0.68 | −0.24 | −0.62 |
| GA | −0.08 | 0.5 | 0.27 | 0.13 | −0.39 | 0.71 |
| GC | −0.08 | 0.22 | 1.33 | −0.35 | 0.65 | 1.59 |
| GG | 0.06 | 1.08 | 0.09 | 0.56 | −0.82 | 0.24 |
| GT | 1.50 | 0.50 | 0.80 | 0.13 | 1.29 | 1.04 |
| TA | −1.23 | −2.37 | −0.44 | −2.24 | −1.51 | −1.39 |
| TC | −0.08 | 0.5 | 0.27 | 0.13 | −0.39 | 0.71 |
| TG | −1.38 | −1.36 | −0.27 | −0.86 | −0.62 | −1.25 |
| TT | 0.06 | 0.5 | 0.27 | 1.59 | 0.11 | −0.11 |
aSee footnote a of Table 1 for further explanation.
Now we can see from Figure 2 that the sequence-order effect of a DNA sequence can be, to some extent, reflected through a set of sequence-correlation factors 
 ,
,  ,
,  ,
,  , as clearly defined by Equations 5 and 6. Similar to the procedure as described in (7) for converting the amino acid composition to the PseACC, let us augment the DNC of Equation 4 to the PseDNC as given later in the text
| (8) |
where
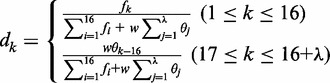 |
(9) |
where 
 are the same as those in Equation 4,
 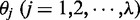 are given by Equation 5,
  is the number of the total counted ranks (or tiers) of the correlations along a DNA sequence and
  is the weight factor. The concrete values for
  and
and  will be discussed further. Thus, instead of a 16-D (dimensional) vector (cf. Equation 4), the DNA sequence is now formulated by a
  vector as shown in Equation 8. It is through the additional
  correlation factors (Figure 2) that not only considerable global sequence-order effects can be incorporated but the DNA sequences with extreme difference in length can also be converted into a set of feature vectors with a same dimension. The latter is an important pre-requisite for formulating the statistical samples because many powerful classification engines, such as Covariant Discriminant (34,35), Support Vector Machine (SVM) (36) and K-Nearest Neighbor (37–39) algorithms, require the input to be a set of digital vectors with a fixed number of components.
SVM
SVM is an effective method for supervised pattern recognition and has been widely used in the realm of bioinformatics [see, e.g. (14,40–45)]. The basic idea of SVM is to transform the data into a high dimensional feature space and then determine the optimal separating hyperplane. A brief introduction about the formulation of SVM was given in (46). In this study, the SVM implementation was based on the freely available package LIBSVM 2.84 written by Chang and Lin (47). Because of its effectiveness and speed in training process, the radial basis kernel function was used to obtain the best classification hyperplane. The regularization parameter  and the kernel width parameter
  were determined via an optimization procedure using a grid search approach, and their actual values thus obtained for the current study were
  and
and  .
.
iRSpot-PseDNC and its parameters
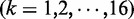
The predictor obtained via the aforementioned procedures is called iRSpot-PseDNC. The PseDNC as formulated in Equations 8 and 9 contains two uncertain parameters  and
and  . The former represents the total number of correlation ranks counted (cf. Equation 5 and Figure 2), which is an integer and should be smaller than the length of any of the DNA sequences involved in this study, whereas the latter is the weight factor ranged from 0 to 1 (26). Generally speaking, the greater the value of
  , the more sequence-order effects will be incorporated. However, if the value of
  is too large, it might cause the overfitting problem (48) or ‘high dimension disaster’ (49). Preliminary tests indicated that in using the iRSpot-PseDNC predictor on the benchmark data set
  (Supplementary Information S1), a peak was observed for the overall accuracy
  (cf. Equation 11) or Acc (cf. Equation 12) when
  and
and  . Accordingly, the two numerical values were respectively used for the two uncertain parameters in iRSpot-PseDNC.
RESULTS AND DISCUSSIONS
One of the important procedures in developing a useful statistical predictor (23) is to objectively evaluate its performance or anticipated success rate. Now let us address this problem.
Criteria for performance evaluation
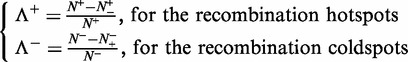
To provide a more intuitive and easier-to-understand method to measure the prediction quality, the criteria proposed in (50) was adopted here. According to that criteria, the rates of correct predictions for the recombination hotspots in data set  and the recombination coldspots in data set
  are respectively defined by (cf. Equation 1)
 |
(10) |
where  is the total number of the recombination hotspots investigated, whereas
  the number of the recombination hotspots incorrectly predicted as the coldspots;
  the total number of the recombination coldspots investigated, whereas
  the number of the recombination coldspots incorrectly predicted as the hotspots. The overall success prediction rate is given by (51)
| (11) |
It is obvious from Equations 10 and 11 that, if and only if none of the recombination hotspots and the recombination coldspots are mispredicted, i.e.  and
and  , we have the overall success rate
  . Otherwise, the overall success rate would be <1.
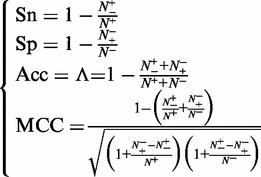
On the other hand, it is instructive to point out that the following equation set is often used in literatures for examining the performance quality of a predictor
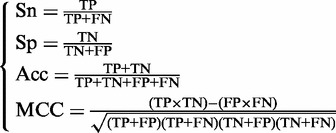 |
(12) |
where TP represents the true positive; TN, the true negative; FP, the false positive; FN, the false negative; Sn, the sensitivity; Sp, the specificity; Acc, the accuracy; MCC, the Mathew’s correlation coefficient.
The relations between the symbols in Equation 11 and those in Equation 12 are given by
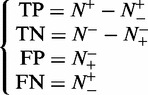 |
(13) |
Substituting Equation 13 into Equation 12 and also noting Equation 11, we obtain
 |
(14) |
Obviously, when  , meaning none of the recombination hotspots was mispredicted to be a coldspots, we have the sensitivity
  , whereas
  , meaning that all the recombination hotspots were mispredicted to be the coldspots, we have the sensitivity
  . Likewise, when
  , meaning none of the recombination coldspots was mispredicted, we have the specificity
  , whereas
  meaning all the recombination coldspots were incorrectly predicted as recombination hotspots, we have the specificity
  . When
  , meaning that none of the recombination hotspots in the data set
  and none of the recombination coldspots in
  was incorrectly predicted, we have the overall accuracy
  , whereas
  and
and  , meaning that all the recombination hotspots in the data set
  and all the recombination coldspots in
  were mispredicted, we have the overall accuracy
  . The MCC correlation coefficient is usually used for measuring the quality of binary (two-class) classifications. When
  , meaning that none of the recombination hotspots in the data set
  and none of the recombination coldspots in
  was mispredicted, we have
  ; when
  and
and  , we have
  , meaning no better than random prediction; when
  and
and  we have
  , meaning total disagreement between prediction and observation. As we can see from the aforementioned discussion, it is much more intuitive and easier to understand when using Equation 14 to examine a predictor for its sensitivity, specificity, overall accuracy and Mathew’s correlation coefficient.
Cross-validation
In literatures, the following three cross-validation methods are often used to evaluate the quality of a predictor: independent data set test, subsampling (K-fold cross-validation) test and jackknife test. However, as elaborated by an analysis in (52) and demonstrated by Equations 28–32 of (23), among the three cross-validation methods, the jackknife test is deemed the least arbitrary and most objective because it can always yield a unique result for a given benchmark data set, and hence has been widely recognized and increasingly used by investigators to examine the quality of various predictors [see, e.g. (11,16,21,22,29,53–57)]. Accordingly, the jackknife test was also adopted in this study to examine the anticipated success rates of the current predictor. In the jackknife test, all the samples in the benchmark data set  will be singled out one by one and tested by the predictor trained by the remaining samples. During the jackknifing process, both the training data set and testing data set are actually open, and each sample will be in turn moved between the two.
The results obtained with iRSpot-PseDNC on the benchmark data set  of Supplementary Information S1 by the jackknife test are given in Table 3, where for facilitating comparison, the corresponding results by the IDQD predictor (6) on the same benchmark data set are also given. As indicated in Table 3, the results reported by Liu et al. (6) were derived by the 5-fold cross-validation test. As elucidated in (23), this would make their test without a unique result as demonstrated later in the text. For the current case, the benchmark data set
  consists of
  and
and  , where
  contains 490 recombination hotspots, and
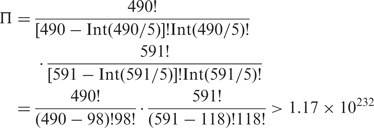
  contains 591 recombination coldspots. Substituting these data into Equations 28 and 29 of (23) with
  (number of groups for classification) and
  (number of folds for cross-validation), we obtain
 |
(15) |
where the symbol Int is the integer-truncating operator meaning to take the integer part for the number in the bracket right after it. The result of Equation 15 indicates that the number of possible combinations of taking one-fifth samples from each of the two subsets,  and
and  , for conducting the 5-fold cross-validation will be >
 , which is an astronomical figure, too large to be practical. Therefore, in their study (6), Liu et al. only randomly picked one of ∼
 possible combinations (cf. Equation 15) to perform the 5-fold cross-validation. To make the comparison between iRspot-PseNDC and IDQD (6) with the same test method, we also randomly picked one of the possible combinations from the same benchmark data set to perform the 5-fold cross-validation test with iRspot-PseNDC, and the corresponding results thus obtained are given in Table 3 as well.
Table 3.
A comparison of between iRSpot-PseDNC with the existing method
| Predictor | Test method | Sn (%) | Sp (%) | Acc (%) | MCC |
|---|---|---|---|---|---|
| iRSpot-PseDNCa | Jackknife | 73.06 | 89.49 | 82.04 | 0.638 |
| 5-fold cross | 81.63 | 88.14 | 85.19 | 0.692 | |
| IDQDb | 5-fold cross | 79.40 | 81.00 | 80.30 | 0.603 |
aThe parameters used:  and
and  for Equation 9;
  and
and  for the LIBSVM operation engine (47).
bFrom Liu et al. (6).
As we can see from the table, not only the overall accuracy (Acc) achieved by iRSpot-PseDNC using the 5-fold cross validation test is remarkably higher than that by the IDQD (6) but the overall accuracy achieved by iRSpot-PseDNC using the rigorous jackknife test is also higher than that by the IDQD. Besides the overall accuracy, the MCC rates achieved by the iRSpot-PseDNC predictor derived from both 5-fold cross-validation and jackknife tests are also higher than those by the IDQD predictor.
To further demonstrate its performance, we used iRSpot-PseDNC to identify the 452 experimentally annotated recombination hotspots by Pan et al. (58) for the S. cerevisiae chromosome IV. The results are given in the Supplementary Information S2, from which we can see that 347 outcomes by the predictor were consistent with the experimental observations. The overall success rate was 76.77%, indicating that the method as proposed in this article is promising in identifying recombination hot/cold spots, or can at the very least play a complementary role to the existing method in this area.
Web-server guide
For the convenience of the vast majority of experimental scientists, let us give a step-by-step guide on how to use the iRSpot-PseDNC web-server to get their desired results without the need to follow the complicated mathematic equations that were presented just for the integrity in developing the predictor. The detailed steps are as follows.
Step 1
Open the web server at http://lin.uestc.edu.cn/server/iRSpot-PseDNC and you will see the top page of iRSpot-PseDNC on your computer screen, as shown in Figure 3. Click on the Read Me button to see a brief introduction about the predictor and the caveat when using it.
Figure 3.

A semi-screenshot to show the top page of the iRSpot-PseDNC web-server. Its website address is at http://lin.uestc.edu.cn/server/iRSpot-PseDNC.
Step 2
Either type or copy/paste the query DNA sequence into the input box at the center of Figure 3. The input sequence should be in the FASTA format. A sequence in FASTA format consists of a single initial line beginning with a greater-than symbol (‘>’) in the first column, followed by lines of sequence data. The words right after the ‘>’ symbol in the single initial line are optional and only used for the purpose of identification and description. All lines should not be longer than 120 characters and usually do not exceed 80 characters. The sequence ends if another line starting with a ‘>’ appears; this indicates the start of another sequence. Example sequences in FASTA format can be seen by clicking on the Example button right above the input box.
Step 3
Click on the Submit button to see the predicted result. For example, if you use the query DNA sequences in the Example window as the input, after clicking the Submit button, you will see the following shown on the screen of your computer: the outcome for the first query sample is ‘recombination hotspot’; the outcome for the second query sample is ‘recombination coldspot’. All these results are fully consistent with the experimental observations as summarized in the Supplementary Information S1. It takes a few seconds for the aforementioned computation before the predicted result appears on your computer screen; the more number of query sequences and longer of each sequence, the more time it is usually needed.
Step 4
Click on the Citation button to find the relevant papers that document the detailed development and algorithm of iRSpot-PseDNC.
Step 5
Click on the Data button to download the benchmark data sets used to train and test the iRSpot-PseDNC predictor.
SUPPLEMENTARY DATA
Supplementary Data are available at NAR Online: Supplementary Data sets 1 and 2.
FUNDING
Funding for open access charge: The National Nature Scientific Foundation of China [61100092, 61202256].
Conflict of interest statement. None declared.
Supplementary Material
ACKNOWLEDGEMENTS
The authors wish to thank the two anonymous reviewers for their constructive comments, which were indeed very helpful for strengthening the presentation of this study.
REFERENCES
- 1.Lewin B. Genes IX. 2008. Chap.18. Jones & Bartlett, Massachusetts, pp. 428–456. [Google Scholar]
- 2.Keeney S. Spo11 and the Formation of DNA Double-Strand Breaks in Meiosis. Genome Dyn. Stab. 2008;2:81–123. doi: 10.1007/7050_2007_026. [DOI] [PMC free article] [PubMed] [Google Scholar]
- 3.Baudat F, Nicolas A. Clustering of meiotic double-strand breaks on yeast chromosome III. Proc. Natl Acad. Sci. USA. 1997;94:5213–5218. doi: 10.1073/pnas.94.10.5213. [DOI] [PMC free article] [PubMed] [Google Scholar]
- 4.Klein S, Zenvirth D, Dror V, Barton AB, Kaback DB, Simchen G. Patterns of meiotic double-strand breakage on native and artificial yeast chromosomes. Chromosoma. 1996;105:276–284. doi: 10.1007/BF02524645. [DOI] [PubMed] [Google Scholar]
- 5.Zenvirth D, Arbel T, Sherman A, Goldway M, Klein S, Simchen G. Multiple sites for double-strand breaks in whole meiotic chromosomes of Saccharomyces cerevisiae. EMBO J. 1992;11:3441–3447. doi: 10.1002/j.1460-2075.1992.tb05423.x. [DOI] [PMC free article] [PubMed] [Google Scholar]
- 6.Liu G, Liu J, Cui X, Cai L. Sequence-dependent prediction of recombination hotspots in Saccharomyces cerevisiae. J. Theor. Biol. 2012;293:49–54. doi: 10.1016/j.jtbi.2011.10.004. [DOI] [PubMed] [Google Scholar]
- 7.Chou KC. Prediction of protein cellular attributes using pseudo amino acid composition. Proteins. 2001;43:246–255. doi: 10.1002/prot.1035. [DOI] [PubMed] [Google Scholar]
- 8.Nanni L, Lumini A. Genetic programming for creating Chou's pseudo amino acid based features for submitochondria localization. Amino Acids. 2008;34:653–660. doi: 10.1007/s00726-007-0018-1. [DOI] [PubMed] [Google Scholar]
- 9.Sahu SS, Panda G. A novel feature representation method based on Chou's pseudo amino acid composition for protein structural class prediction. Comput. Biol. Chem. 2010;34:320–327. doi: 10.1016/j.compbiolchem.2010.09.002. [DOI] [PubMed] [Google Scholar]
- 10.Fang Y, Guo Y, Feng Y, Li M. Predicting DNA-binding proteins: approached from Chou's pseudo amino acid composition and other specific sequence features. Amino Acids. 2008;34:103–109. doi: 10.1007/s00726-007-0568-2. [DOI] [PubMed] [Google Scholar]
- 11.Nanni L, Lumini A, Gupta D, Garg A. Identifying bacterial virulent proteins by fusing a set of classifiers based on variants of Chou's pseudo amino acid composition and on evolutionary information. IEEE/ACM Trans. Comput. Biol. Bioinform. 2012;9:467–475. doi: 10.1109/TCBB.2011.117. [DOI] [PubMed] [Google Scholar]
- 12.Mohammad Beigi M, Behjati M, Mohabatkar H. Prediction of metalloproteinase family based on the concept of Chou's pseudo amino acid composition using a machine learning approach. J. Struct. Funct. Genom. 2011;12:191–197. doi: 10.1007/s10969-011-9120-4. [DOI] [PubMed] [Google Scholar]
- 13.Guo J, Rao N, Liu G, Yang Y, Wang G. Predicting protein folding rates using the concept of Chou's pseudo amino acid composition. J. Comput. Chem. 2011;32:1612–1617. doi: 10.1002/jcc.21740. [DOI] [PubMed] [Google Scholar]
- 14.Mohabatkar H, Mohammad Beigi M, Esmaeili A. Prediction of GABA(A) receptor proteins using the concept of Chou's pseudo-amino acid composition and support vector machine. J. Theor. Biol. 2011;281:18–23. doi: 10.1016/j.jtbi.2011.04.017. [DOI] [PubMed] [Google Scholar]
- 15.Zou D, He Z, He J, Xia Y. Supersecondary structure prediction using Chou's pseudo amino acid composition. J. Comput. Chem. 2011;32:271–278. doi: 10.1002/jcc.21616. [DOI] [PubMed] [Google Scholar]
- 16.Mohabatkar H. Prediction of cyclin proteins using Chou's pseudo amino acid composition. Protein Pept. Lett. 2010;17:1207–1214. doi: 10.2174/092986610792231564. [DOI] [PubMed] [Google Scholar]
- 17.Georgiou DN, Karakasidis TE, Nieto JJ, Torres A. Use of fuzzy clustering technique and matrices to classify amino acids and its impact to Chou's pseudo amino acid composition. J. Theor. Biol. 2009;257:17–26. doi: 10.1016/j.jtbi.2008.11.003. [DOI] [PubMed] [Google Scholar]
- 18.Zhou XB, Chen C, Li ZC, Zou XY. Using Chou's amphiphilic pseudo-amino acid composition and support vector machine for prediction of enzyme subfamily classes. J. Theor. Biol. 2007;248:546–551. doi: 10.1016/j.jtbi.2007.06.001. [DOI] [PubMed] [Google Scholar]
- 19.Esmaeili M, Mohabatkar H, Mohsenzadeh S. Using the concept of Chou's pseudo amino acid composition for risk type prediction of human papillomaviruses. J. Theor. Biol. 2010;263:203–209. doi: 10.1016/j.jtbi.2009.11.016. [DOI] [PubMed] [Google Scholar]
- 20.Mohabatkar H, Beigi MM, Abdolahi K, Mohsenzadeh S. Prediction of allergenic proteins by means of the concept of Chou's pseudo amino acid composition and a machine learning approach. Med. Chem. 2012 doi: 10.2174/157340613804488341. [DOI] [PubMed] [Google Scholar]
- 21.Zia Ur R, Khan A. Identifying GPCRs and their types with Chou's Pseudo amino acid composition: an approach from multi-scale energy representation and position specific scoring matrix. Protein Pept. Lett. 2012;19:890–903. doi: 10.2174/092986612801619589. [DOI] [PubMed] [Google Scholar]
- 22.Hayat M, Khan A. Discriminating outer membrane proteins with fuzzy K-Nearest neighbor algorithms based on the general form of Chou's PseAAC. Protein Pept. Lett. 2012;19:411–421. doi: 10.2174/092986612799789387. [DOI] [PubMed] [Google Scholar]
- 23.Chou KC. Some remarks on protein attribute prediction and pseudo amino acid composition (50th Anniversary Year Review) J. Theor. Biol. 2011;273:236–247. doi: 10.1016/j.jtbi.2010.12.024. [DOI] [PMC free article] [PubMed] [Google Scholar]
- 24.Du P, Wang X, Xu C, Gao Y. PseAAC-Builder: a cross-platform stand-alone program for generating various special Chou's pseudo-amino acid compositions. Anal. Biochem. 2012;425:117–119. doi: 10.1016/j.ab.2012.03.015. [DOI] [PubMed] [Google Scholar]
- 25.Shen HB, Chou KC. PseAAC: a flexible web-server for generating various kinds of protein pseudo amino acid composition. Anal. Biochem. 2008;373:386–388. doi: 10.1016/j.ab.2007.10.012. [DOI] [PubMed] [Google Scholar]
- 26.Chou KC. Using amphiphilic pseudo amino acid composition to predict enzyme subfamily classes. Bioinformatics. 2005;21:10–19. doi: 10.1093/bioinformatics/bth466. [DOI] [PubMed] [Google Scholar]
- 27.Lin WZ, Fang JA, Xiao X, Chou KC. iDNA-Prot: identification of DNA binding proteins using random forest with grey model. PLoS One. 2011;6:e24756. doi: 10.1371/journal.pone.0024756. [DOI] [PMC free article] [PubMed] [Google Scholar]
- 28.Xiao X, Wu ZC, Chou KC. iLoc-Virus: a multi-label learning classifier for identifying the subcellular localization of virus proteins with both single and multiple sites. J. Theor. Biol. 2011;284:42–51. doi: 10.1016/j.jtbi.2011.06.005. [DOI] [PubMed] [Google Scholar]
- 29.Chou KC, Wu ZC, Xiao X. iLoc-Hum: using accumulation-label scale to predict subcellular locations of human proteins with both single and multiple sites. Molecular Biosystems. 2012;8:629–641. doi: 10.1039/c1mb05420a. [DOI] [PubMed] [Google Scholar]
- 30.Abeel T, Saeys Y, Bonnet E, Rouze P, Van de Peer Y. Generic eukaryotic core promoter prediction using structural features of DNA. Genome. Res. 2008;18:310–323. doi: 10.1101/gr.6991408. [DOI] [PMC free article] [PubMed] [Google Scholar]
- 31.Goni JR, Fenollosa C, Perez A, Torrents D, Orozco M. DNAlive: a tool for the physical analysis of DNA at the genomic scale. Bioinformatics. 2008;24:1731–1732. doi: 10.1093/bioinformatics/btn259. [DOI] [PubMed] [Google Scholar]
- 32.Goni JR, Perez A, Torrents D, Orozco M. Determining promoter location based on DNA structure first-principles calculations. Genome Biol. 2007;8:R263. doi: 10.1186/gb-2007-8-12-r263. [DOI] [PMC free article] [PubMed] [Google Scholar]
- 33.Miele V, Vaillant C, d'Aubenton-Carafa Y, Thermes C, Grange T. DNA physical properties determine nucleosome occupancy from yeast to fly. Nucleic Acids Res. 2008;36:3746–3756. doi: 10.1093/nar/gkn262. [DOI] [PMC free article] [PubMed] [Google Scholar]
- 34.Chou KC, Liu W, Maggiora GM, Zhang CT. Prediction and classification of domain structural classes. Proteins. 1998;31:97–103. [PubMed] [Google Scholar]
- 35.Chou KC, Cai YD. Prediction of membrane protein types by incorporating amphipathic effects. J. Chem. Inf. Model. 2005;45:407–413. doi: 10.1021/ci049686v. [DOI] [PubMed] [Google Scholar]
- 36.Vapnik VN. The Nature of Statistical Learning Theory. New York: Springer Verlag; 1995. [Google Scholar]
- 37.Denoeux T. A k-nearest neighbor classification rule based on Dempster-Shafer theory. IEEE Trans. Syst. Man Cybern. 1995;25:804–813. [Google Scholar]
- 38.Shen HB, Chou KC. Virus-PLoc: A fusion classifier for predicting the subcellular localization of viral proteins within host and virus-infected cells. Biopolymers. 2007;85:233–240. doi: 10.1002/bip.20640. [DOI] [PubMed] [Google Scholar]
- 39.Chou KC, Shen HB. Review: recent progresses in protein subcellular location prediction. Anal. Biochem. 2007;370:1–16. doi: 10.1016/j.ab.2007.07.006. [DOI] [PubMed] [Google Scholar]
- 40.Chen W, Lin H. Prediction of midbody, centrosome and kinetochore proteins based on gene ontology information. Biochem. Biophys. Res. Commun. 2010;401:382–384. doi: 10.1016/j.bbrc.2010.09.061. [DOI] [PubMed] [Google Scholar]
- 41.Cai YD, Zhou GP, Chou KC. Support vector machines for predicting membrane protein types by using functional domain composition. Biophys. J. 2003;84:3257–3263. doi: 10.1016/S0006-3495(03)70050-2. [DOI] [PMC free article] [PubMed] [Google Scholar]
- 42.Lin H, Ding H. Predicting ion channels and their types by the dipeptide mode of pseudo amino acid composition. J. Theor. Biol. 2011;269:64–69. doi: 10.1016/j.jtbi.2010.10.019. [DOI] [PubMed] [Google Scholar]
- 43.Zhu L, Yang J, Shen HB. Multi label learning for prediction of human protein subcellular localizations. Protein J. 2009;28:384–390. doi: 10.1007/s10930-009-9205-0. [DOI] [PubMed] [Google Scholar]
- 44.Chen W, Feng P, Lin H. Prediction of replication origins by calculating DNA structural properties. FEBS Lett. 2012;586:934–938. doi: 10.1016/j.febslet.2012.02.034. [DOI] [PubMed] [Google Scholar]
- 45.Chen C, Shen ZB, Zou XY. Dual-Layer wavelet SVM for predicting protein structural class via the general form of Chou's pseudo amino acid composition. Protein Pept. Lett. 2012;19:422–429. doi: 10.2174/092986612799789332. [DOI] [PubMed] [Google Scholar]
- 46.Chou KC, Cai YD. Using functional domain composition and support vector machines for prediction of protein subcellular location. J. Biol. Chem. 2002;277:45765–45769. doi: 10.1074/jbc.M204161200. [DOI] [PubMed] [Google Scholar]
- 47.Chang CC, Lin CJ. LIBSVM: a library for support vector machines. 2001 Software. http://www.csie.ntu.edu.tw/_cjlin/libsvm. [Google Scholar]
- 48.Chou KC. A key driving force in determination of protein structural classes. Biochem. Biophys. Res. Commun. 1999;264:216–224. doi: 10.1006/bbrc.1999.1325. [DOI] [PubMed] [Google Scholar]
- 49.Wang T, Yang J, Shen HB, Chou KC. Predicting membrane protein types by the LLDA algorithm. Protein Pept. Lett. 2008;15:915–921. doi: 10.2174/092986608785849308. [DOI] [PubMed] [Google Scholar]
- 50.Chou KC. Using subsite coupling to predict signal peptides. Protein Eng. 2001;14:75–79. doi: 10.1093/protein/14.2.75. [DOI] [PubMed] [Google Scholar]
- 51.Chou KC. Prediction of signal peptides using scaled window. Peptides. 2001;22:1973–1979. doi: 10.1016/s0196-9781(01)00540-x. [DOI] [PubMed] [Google Scholar]
- 52.Chou KC, Shen HB. Cell-PLoc 2.0: an improved package of web-servers for predicting subcellular localization of proteins in various organisms. Natural Science. 2010;2:1090–1103. doi: 10.1038/nprot.2007.494. [DOI] [PubMed] [Google Scholar]
- 53.Hayat M, Khan A. MemHyb: Predicting membrane protein types by hybridizing SAAC and PSSM. J. Theor. Biol. 2012;292:93–102. doi: 10.1016/j.jtbi.2011.09.026. [DOI] [PubMed] [Google Scholar]
- 54.Sun XY, Shi SP, Qiu JD, Suo SB, Huang SY, Liang RP. Identifying protein quaternary structural attributes by incorporating physicochemical properties into the general form of Chou's PseAAC via discrete wavelet transform. Mol. Biosyst. 2012;8:3178–3184. doi: 10.1039/c2mb25280e. [DOI] [PubMed] [Google Scholar]
- 55.Hayat M, Khan A. Predicting membrane protein types by fusing composite protein sequence features into pseudo amino acid composition. J. Theor. Biol. 2011;271:10–17. doi: 10.1016/j.jtbi.2010.11.017. [DOI] [PubMed] [Google Scholar]
- 56.Mei S. Predicting plant protein subcellular multi-localization by Chou's PseAAC formulation based multi-label homolog knowledge transfer learning. J. Theor. Biol. 2012;310:80–87. doi: 10.1016/j.jtbi.2012.06.028. [DOI] [PubMed] [Google Scholar]
- 57.Chou KC, Wu ZC, Xiao X. iLoc-Euk: a multi-label classifier for predicting the subcellular localization of singleplex and multiplex eukaryotic proteins. PLoS One. 2011;6:e18258. doi: 10.1371/journal.pone.0018258. [DOI] [PMC free article] [PubMed] [Google Scholar]
- 58.Pan J, Sasaki M, Kniewel R, Murakami H, Blitzblau HG, Tischfield SE, Zhu X, Neale MJ, Jasin M, Socci ND, et al. A hierarchical combination of factors shapes the genome-wide topography of yeast meiotic recombination initiation. Cell. 2011;144:719–731. doi: 10.1016/j.cell.2011.02.009. [DOI] [PMC free article] [PubMed] [Google Scholar]
Associated Data
This section collects any data citations, data availability statements, or supplementary materials included in this article.