

On comparing the rates of graft failure and death among United States and Spanish kidney transplant recipients…the 10 year graft and patient survival was significantly better in the Spanish population.”
Keywords: death with a functioning allograft, diabetes mellitus, end stage renal disease, graft survival, international comparison
Abstract
Background
The long-term outcomes of kidney transplantation are suboptimal because many patients lose their allografts or experience premature death. Cross-country comparisons of long-term outcomes of kidney transplantation may provide insight into factors contributing to premature graft failure and death. We evaluated the rates of late graft failure and death among US and Spanish kidney recipients.
Methods
This is a cohort study of US (n = 9609) and Spanish (n = 3808) patients who received a deceased donor kidney transplant in 1990, 1994, 1998 or 2002 and had a functioning allograft 1 year after transplantation with follow-up through September 2006. Ten-year overall and death-censored graft survival and 10-year overall recipient survival and death with graft function (DWGF) were estimated with multivariate Cox models.
Results
Among recipients alive with graft function 1 year after transplant, the 10-year graft survival was 71.3% for Spanish and 53.4% for US recipients (P < 0.001). The 10-year, death-censored graft survival was 75.6 and 76.0% for Spanish and US recipients, respectively (P = 0.73). The 10-year recipient survival was 86.2% for Spanish and 67.4% for US recipients (P < 0.001). In recipients with diabetes as the cause of ESRD, the adjusted DWGF rates at 10 years were 23.9 and 53.8 per 1000 person-years for Spanish and US recipients, respectively (P < 0.001). Among recipients whose cause of ESRD was not diabetes mellitus, the adjusted 10-year DWGF rates were 11.0 and 25.4 per 1000 person-years for Spanish and US recipients, respectively.
Conclusions
US kidney transplant recipients had more than twice the long-term hazard of DWGF compared with Spanish kidney transplant recipients and similar levels of death-censored graft function. Pre-transplant medical care, comorbidities, such as cardiovascular disease, and their management in each country's health system are possible explanations for the differences between the two countries.
Introduction
Kidney transplantation is the treatment of choice for end-stage renal disease (ESRD) [1]. However, more than 80% of ESRD patients are treated with maintenance dialysis because of organ shortages and other factors [2–4]. Studies have shown marked differences in the demographics and case mix of patients admitted to dialysis treatment centers across countries in the industrialized world [5]. Cross-country differences have also been demonstrated in the practice patterns of ESRD management in the dialysis setting as well as patient outcomes [6, 7]. Differences between countries in kidney transplantation outcomes and practice patterns have been less well studied.
Premature failure of a renal allograft and the consequent need for retransplantation aggravates organ shortages [8]. Long-term allograft survival has not improved significantly since the early 1990s, which contrasts sharply with the remarkable improvement in short-term outcomes, such as reduction in the rates of acute rejection and increases in 1-year patient and allograft survival [9–11]. The few cross-country studies of renal transplantation suggest that clinical outcomes are inferior in the USA compared with Canada, Australia-New Zealand and the UK [12, 13]. To better understand these differences in long-term outcomes, the current study compared kidney transplant recipients and outcomes in the USA and Spain at four time points during a 12-year period.
Methods
Sources of data
The data on US kidney transplant recipients were obtained from the Scientific Registry of Transplant Recipients (SRTR). All US kidney transplant programs and organ procurement organizations are mandated to submit data on transplant candidates, recipients and organ donors to the Organ Procurement and Transplantation Network at waiting list registration, transplant, 6 and 12 months after transplant, and annually thereafter; these data become the SRTR [14]. Data for the Spanish recipients were collected from individual transplant centers participating in the Spanish Chronic Allograft Nephropathy (CAN) Study Group, which comprised 34 out of 38 adult kidney transplant centers in Spain and 96% of all adult kidney transplant recipients in Spain who were alive with a functioning graft at 1 year after transplant, during the studied years (1990, 1994, 1998, 2002) [15, 16]. The Spanish study was designed to determine the risks and causes of late graft loss from chronic allograft nephropathy. Data were collected on each recipient at 1 year following transplantation and annually thereafter. At the time of enrolment in the Spanish CAN Study, baseline donor and recipient information and transplant events that occurred from transplant to the end of year one were also collected. Data were then collected prospectively, beginning from transplantation in the US cohort and 1 year after transplantation in the Spanish cohort. Mortality determination in US recipients was supplemented with the Social Security Death Master File, and data on graft failure were supplemented with return to dialysis from Medicare files [14]. The quality of the Spanish dataset was verified by an audit of source documents at each of the participating transplant centers with 10% of data points randomly audited at each transplant center. In both the US and Spanish data, delayed graft function was defined as the need for at least one dialysis treatment during the first week after transplantation. Renal allograft function was calculated from the serum creatinine measurement using the abbreviated Modification of Diet in Renal Disease Study (MDRD) equation [17].
Study population
Patients who received a deceased donor kidney transplant during 1990, 1994, 1998 and 2002 and survived with graft function to the first transplant anniversary constituted the study population from which our analysis sample was drawn. These years were chosen because of the Spanish CAN Study design, the original aim of which was to evaluate changes in kidney transplantation in Spain over time. Patients were excluded from the analysis sample if they were under the age 18 years at transplant; received multi-organ or double kidney transplants; had a previous organ transplant (any organ); or were positive for hepatitis B. Since most recipients and donors in Spain were of white race, the US study cohort was further restricted to white recipients of kidneys from white donors. The final sample had 9609 US and 3808 Spanish recipients.
Statistical analysis
Bivariate comparisons were evaluated using the χ2 test for proportions and the t-test for means. Multivariate Cox regression models were used to estimate graft and patient survival, conditional on the recipient having survived with a functioning graft 1 year after transplant. Adjustment covariates for all survival analyses included donor factors [age, sex, hepatitis C (HCV) serologic status and cause of death]; recipient factors [sex, HCV serologic status, body mass index (BMI), cause of ESRD, time on dialysis and peak panel reactive antibodies (PRA) level]; recipient and donor HLA-ABDR mismatch; cold ischemia time; antibody induction therapy; calcineurin inhibitor and sirolimus treatment at discharge from initial transplant hospitalization; any acute rejection during the first year after transplant; and delayed graft function.
Three sets of multivariate Cox regression models were used to estimate survival: (i) an unstratified model with an indicator for country, evaluated at the mean of the covariates of the whole sample (both countries combined); (ii) a model stratified by country and evaluated at each country's own covariate means and; (iii) two separate country models, which allowed the covariates to have different effects in each country, evaluated at each country's mean covariates. Results of the three models were similar. Graft survival was modeled in two separate analyses; one that treated death with a functioning graft (DWFG) as a graft failure event (graft survival) and one that censored the survival time at death if the graft was still functioning (death-censored graft survival). Graft survival time in both cases was calculated as the number of days from transplant to the date of graft failure as reported by the center, re-initiation of maintenance dialysis, retransplant, death or the end of the study. The difference for death-censored graft survival is that the recipient is not counted as having a graft failure if their kidney was functioning at the time of death; he or she just no longer contributes information to the model after their date of death. In addition to estimating the overall risk of death, we also estimated the risk of DWFG, defined as death that was not preceded by initiation of maintenance dialysis or center-reported graft failure. In all cases, our study variables are to be interpreted as survival to a given follow-up interval, such as 10 years after transplant, among recipients who have survived with a functioning graft for at least 1 year following transplant, rather than all transplant recipients.
This study is reported in accordance with the guidelines set forth in the STROBE statement [18].
Results
Donor and recipient characteristics
Transplant recipients and deceased donors differed between the USA and Spain in many ways (Table 1). The USA had younger donors than Spain, with a median age of 34 years compared with 43 years in Spain; 77% of kidney grafts in the USA were from donors under age 50 compared with 60% for Spain (P < 0.001). Donor death due to cerebrovascular accident was more prevalent in Spain than in the USA (43 versus 37%, P < 0.001). While the median age of transplant recipients in both countries was similar (48.4 and 49.0), the USA had a lower fraction of transplants going to recipients under age 35 than Spain (17 versus 21%, P < 0.001) and a greater fraction going to recipients 70 or older (3.5 versus 1.7%, P < 0.001). Recipients with a BMI of 25 or higher accounted for 23 and 38% of transplants in Spain and the USA, respectively (P < 0.001); however, BMI was not reported for a substantial number of recipients (45 Spain, 29% USA, P < 0.001). US recipients were more likely to have low PRA levels (<10%) at transplant (85 versus 74%); zero HLA-ABDR mismatches (16 versus 3%); transplantation preemptive of dialysis treatment (8 versus 2%); and <6 years on dialysis prior to transplantation (95 versus 90%, all comparisons P < 0.001). For transplants performed in 1998 and 2002 (when HCV data were collected in the USA), Spanish recipients were more likely to have positive HCV serology than US recipients (4.3 versus 1.8%, P < 0.001). The most striking difference between the countries was in the primary cause of ESRD. The two countries had a similar fraction of recipients with glomerular diseases (P = 0.20) and polycystic kidney disease (P = 0.83). However, a much larger proportion of US transplant recipients had diabetes (24 versus 6%, P < 0.001) and hypertension (13 versus 7%, P < 0.001) as the underlying causes of ESRD.
Table 1.
Characteristics of US and Spanish kidney transplant recipients who were alive with a functioning graft 1 year after the date of transplantation
| Characteristic | Spain (n = 3808) | USA (n = 9609) | P-value |
|---|---|---|---|
| Donor age, year (mean ± SD) | 41.9 ± 17.1 | 35.1 ± 16.3 | <0.001 |
| Median | 43 | 34 | |
| Range | 12–86 | 0–80 | |
| Categories, no. (%) | |||
| <18 year | 282 (7.4) | 1528 (15.9) | <0.001 |
| 18 to <35 year | 1044 (27.4) | 3327 (34.6) | <0.001 |
| 35 to <50 year | 968 (25.4) | 2526 (26.3) | 0.30 |
| 50 to <65 year | 1037 (27.2) | 1926 (20.0) | <0.001 |
| 65+ year | 349 (9.2) | 302 (3.1) | <0.001 |
| Unknown | 128 (3.4) | 0 (0) | |
| Donor male, no. (%) | 2430 (63.8) | 5874 (61.1) | 0.004 |
| Donor cause of death, no. (%) | |||
| Trauma | 1672 (43.9) | 4316 (44.9) | 0.29 |
| Cerebrovascular accident | 1643 (43.1) | 3573 (37.2) | <0.001 |
| Other | 493 (12.9) | 1720 (17.9) | <0.001 |
| Donor HCV status, 2002a,b, no. (%) | |||
| Negative | 887 (92.9) | 2213 (99.2) | <0.001 |
| Positive | 5 (0.5) | 16 (0.7) | 0.54 |
| Unknown | 63 (6.6) | 2 (0.1) | <0.001 |
| Recipient age at transplant, year (mean ± SD) | 47.1 ± 13.2 | 47.9 ± 13.0 | 0.002 |
| Median | 48.4 | 49.0 | |
| Range | 18–78 | 18–80 | |
| Categories, no. (%) | |||
| <35 year | 797 (20.9) | 1637 (17.0) | <0.001 |
| 35 to <50 year | 1239 (32.5) | 3417 (35.6) | <0.001 |
| 50 to <60 year | 1059 (27.8) | 2569 (26.7) | 0.21 |
| 60 to <70 year | 627 (16.5) | 1653 (17.2) | 0.31 |
| 70+ year | 66 (1.7) | 333 (3.5) | <0.001 |
| Unknown | 20 (0.5) | 0 (0) | |
| Recipient male, no. (%) | 2403 (63.1) | 5943 (61.8) | 0.18 |
| Recipient BMI, kg/m2 (mean ± SD) | 24.6 ± 4.1 | 26.0 ± 5.2 | <0.001 |
| Median | 24.2 | 25.3 | |
| Range | 15.4–43.6 | 9.0–49.5 | |
| Categories, no. (%) | |||
| <20 | 234 (6.1) | 676 (7.0) | 0.06 |
| 20 to <25 | 986 (25.9) | 2565 (26.7) | 0.34 |
| 25 to <30 | 666 (17.5) | 2231 (23.2) | <0.001 |
| 30 to <35 | 171 (4.5) | 1007 (10.5) | <0.001 |
| 35+ | 36 (0.9) | 382 (4.0) | <0.001 |
| Unknown | 1715 (45.0) | 2784 (28.6) | <0.001 |
| Peak PRA, no. (%) | |||
| <10% | 2363 (62.1) | 6881 (71.6) | <0.001 |
| 10 to <80% | 575 (15.1) | 1744 (18.1) | <0.001 |
| 80 to 100% | 68 (1.8) | 379 (3.9) | <0.001 |
| Unknown | 802 (21.1) | 605 (6.3) | <0.001 |
| PRA at transplant, no (%) | |||
| <10% | 2831 (74.3) | 8152 (84.8) | <0.001 |
| 10 to <80% | 213 (5.6) | 710 (7.4) | <0.001 |
| 80–100% | 13 (0.3) | 142 (1.5) | <0.001 |
| Unknown | 751 (19.7) | 605 (6.3) | <0.001 |
| Recipient-donor total HLA-ABDR mismatches, (mean ± SD) | 3.2 ± 1.2 | 2.9 ± 1.7 | <0.001 |
| Categories, no. (%) | |||
| 0 | 97 (2.5) | 1548 (16.1) | <0.001 |
| 1 | 238 (6.3) | 548 (5.7) | 0.22 |
| 2 | 645 (16.9) | 1348 (14.1) | <0.001 |
| 3 | 1247 (32.7) | 2340 (24.4) | <0.001 |
| 4 | 988 (25.9) | 2081 (21.7) | <0.001 |
| 5 | 383 (10.1) | 1245 (13.0) | <0.001 |
| 6 | 70 (1.8) | 446 (4.6) | <0.001 |
| Missing | 140 (3.7) | 53 (0.6) | <0.001 |
| Time on dialysis prior to transplant, year (mean ± SD) | 2.7 ± 2.9 | 2.2 ± 2.2 | <0.001 |
| Median | 1.8 | 1.6 | |
| Range | 0–57.3 | 0–22.5 | |
| Categories, no. (%) | |||
| 0 (Preemptive) | 59 (1.5) | 720 (7.5) | <0.001 |
| <1 year | 851 (22.3) | 2210 (23.0) | 0.42 |
| 1 to <2 year | 1032 (27.1) | 2660 (27.7) | 0.50 |
| 2 to <3 year | 623 (16.4) | 1682 (17.5) | 0.11 |
| 3 to <6 year | 737 (19.4) | 1705 (17.7) | 0.03 |
| 6+ year | 370 (9.7) | 452 (4.7) | <0.001 |
| Unknown | 136 (3.6) | 180 (1.9) | <0.001 |
| Recipient HCV status, 1998–2002c, no. (%) | |||
| Negative | 1981 (90.5) | 4130 (89.2) | 0.14 |
| Positive | 94 (4.3) | 83 (1.8) | <0.001 |
| Unknown | 115 (5.3) | 413 (8.9) | <0.001 |
| Recipient cause of ESRD, no. (%) | |||
| Diabetes mellitus | 212 (5.6) | 2311 (24.1) | <0.001 |
| Hypertension | 276 (7.2) | 1221 (12.7) | <0.001 |
| Glomerular diseases | 1143 (30.0) | 2777 (28.9) | 0.20 |
| Polycystic kidney disease | 553 (14.5) | 1409 (14.7) | 0.83 |
| Other known diagnoses | 488 (12.8) | 900 (9.4) | <0.001 |
| Unknown | 1136 (29.8) | 991 (10.3) | <0.001 |
| Cold ischemia time, hours (mean ± SD) | 19.3 ± 7.2 | 21.1 ± 9.3 | <0.001 |
| Median | 19.0 | 20.0 | |
| Range | 0–231.0 | 0–85.0 | |
| Categories no. (%) | |||
| <12 h | 319 (8.4) | 1234 (12.8) | <0.001 |
| 12 to <18 h | 1026 (26.9) | 2142 (22.3) | <0.001 |
| 18 to <24 h | 1473 (38.7) | 2354 (24.5) | <0.001 |
| 24 to <30 h | 591 (15.5) | 1674 (17.4) | 0.008 |
| 30 to <36 h | 127 (3.3) | 979 (10.2) | <0.001 |
| 36+ h | 51 (1.3) | 636 (6.6) | <0.001 |
| Unknown | 221 (5.8) | 590 (6.1) | 0.46 |
| Delayed graft function, no. (%) | |||
| No | 2543 (66.8) | 7729 (80.4) | <0.001 |
| Yes | 1041 (27.3) | 1757 (18.3) | <0.001 |
| Unknown | 224 (5.9) | 123 (1.3) | <0.001 |
| GFR at 1 year after transplantd, (mean ± SD) (ml/min/1.73 m2 of body surface area) | 50.6 ± 18.3 | 50.1 ± 18.4 | 0.12 |
| Acute rejection during the first year after transplant, no. (%) | |||
| Overall (1990–2002) | 984 (25.8) | 2282 (23.7) | 0.01 |
| 1990 | 232 (33.5) | 1023 (39.5) | 0.004 |
| 1994 | 320 (34.6) | 661 (27.6) | <0.001 |
| 1998 | 284 (23.0) | 382 (15.9) | <0.001 |
| 2002 | 148 (15.5) | 216 (9.7) | <0.001 |
| Induction immunosuppression, 2002a – no. (%) | |||
| None | 609 (63.8) | 716 (32.1) | <0.001 |
| Polyclonal | 76 (8.0) | 565 (25.3) | <0.001 |
| Monoclonal | 270 (28.3) | 864 (38.7) | <0.001 |
| Other/Mixed | 0 (0) | 82 (3.7) | |
| Unknown | 0 (0) | 4 (0.2) | |
| Maintenance immunosuppression, 2002a, no. (%) | |||
| Cyclosporine without MMFe | 41 (4.3) | 36 (1.6) | <0.001 |
| Cyclosporine with MMFe | 205 (21.5) | 627 (28.1) | <0.001 |
| Tacrolimus without MMFe | 2 (0.2) | 129 (5.8) | <0.001 |
| Tacrolimus with MMFe | 559 (58.5) | 1071 (48.0) | <0.001 |
| All sirolimus containing regimens | 30 (3.1) | 289 (13.0) | <0.001 |
| Other regimens | 118 (12.4) | 75 (3.4) | <0.001 |
| Unknown | 0 (0) | 4 (0.2) | |
aFor the cohort transplanted in 2002 (n = 955 Spain, n = 2231 USA).
bData on HCV status of deceased donors were not collected consistently in the USA until 2000.
cFor the sample excluding the 1990 and 1994 cohorts (n = 2190 Spain, n = 4626 USA). Data on HCV status of recipients were not collected consistently in the USA until 1995.
dGlomerular filtration rate estimated with the 4-variable Modification of Diet in Renal Disease equation.
eMMF – mycophenolate mofetil or mycophenolic acid.
Cold ischemia time, graft function, acute rejection and immunosuppression
While mean cold ischemia time for the allograft was similar in both countries (21 and 19 h), 34% of US transplants had a cold ischemia time of ≥24 h compared with 20% in Spain (P < 0.001). Delayed graft function was reported in 27% of Spanish and 18% of US recipients (P < 0.001). Mean allograft function (estimated glomerular filtration rate [eGFR] from the MDRD 4-variable equation) at 1 year after transplant was the same in both countries (50.6 and 50.1 mL/min/1.73 m2, P = 0.12) and remained the same among survivors at annual follow-up reports through 5 years after transplant. The rate of acute rejection during the first year after transplant was lower for US recipients (24%) than Spanish ones (26%, P = 0.01), with a larger difference for the most recent cohort. For transplants in 2002 (n = 955 Spain; n = 2231 USA), induction therapy with either a non-depleting anti-CD25 monoclonal antibody or a depleting antithymocyte polyclonal antibody was employed for 64% of US recipients and 36% of Spanish recipients (P < 0.001). In 2002, tacrolimus was the most commonly used calcineurin inhibitor in both Spain (59% tacrolimus versus 26% cyclosporine, P < 0.0001) and the USA (54% tacrolimus versus 30% cyclosporine). A calcineurin inhibitor-based maintenance immunosuppression regimen was used for most Spanish and US recipients (85 and 84%, P = 0.48). Data on immunosuppression prior to 2002 reflected similar distribution of older immunosuppressive drugs in use at that time (data not shown).
Graft survival
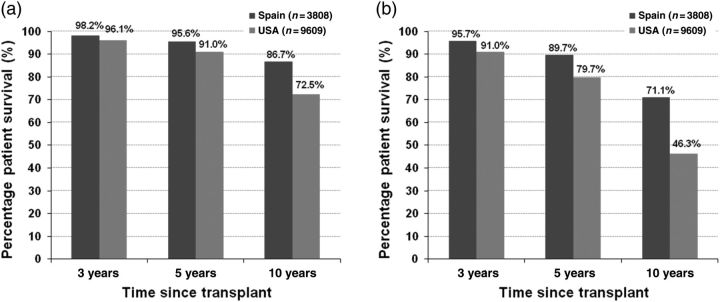
For graft survival, and separately for death-censored graft survival, a Cox regression model was fitted to the combined sample of US and Spanish recipients, modeling graft survival through the end of the study (1 September 2006), which was then evaluated at 3, 5 and 10 years after transplant using each country's mean covariate values. The hazard ratio for graft failure when DWFG is treated as a graft failure was 1.90 for the US relative to Spain (P < 0.001). The adjusted graft survival at 10 years after transplant was 71% for Spanish and 53% for US recipients (P < 0.001). Figure 1 shows the graft survival by diabetes status (diabetic or non-diabetic, based on documentation, as the underlying cause of ESRD). In both countries, non-diabetic recipients had better graft survival than diabetic recipients; the USA had lower survival in both groups. When DWFG was censored in the graft survival analysis rather than treated as graft failure (death-censored graft survival), the hazard ratio for the USA relative to Spain was much smaller (1.19, P = 0.001). The 10-year adjusted graft survival was 75.6% for Spanish recipients compared with 76.1% for US recipients (P = 0.69). Figure 2 shows adjusted 10-year death-censored graft survival by diabetes status. The adjusted 10-year death-censored graft survival in non-diabetic recipients was 76% in Spain and 77% in the USA (P = 0.30) and was 72% in Spain and 73% in the USA for diabetic recipients (P = 0.45). Since recipients with diabetes are known to be at higher risk for graft failure and are disproportionately represented in the US cohort (24 versus 6%), we reproduced the survival analyses using a sample that excluded recipients with ESRD due to diabetes mellitus from both cohorts. Results for non-diabetics were the same.
Fig. 1.
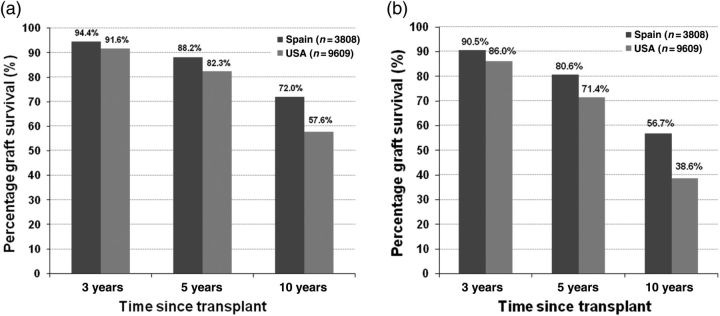
(a) Adjusted allograft survival (death-considered graft failure) in non-diabetic US and Spanish kidney transplant recipients who have survived at least 1 year since transplantation. (b) Adjusted allograft survival (death-considered graft failure) in diabetic US and Spanish kidney transplant recipients who have survived at least 1 year since transplantation.
Fig. 2.

(a) Adjusted death-censored allograft survival in non-diabetic US and Spanish kidney transplant recipients who have survived at least 1 year since transplantation. (b) Adjusted death-censored allograft survival in diabetic US and Spanish kidney transplant recipients who have survived at least 1 year since transplantation.
Patient survival, death with graft function and cause of death
During the period under study, 37% of US recipients and 12% of Spanish recipients died (P < 0.001). The hazard ratio for risk of death for the USA compared with Spain was 2.35 (P < 0.001). The 10-year patient survival was 86% in Spain and 67% in the USA (P < 0.001). Survival estimates by diabetes status are shown in Figure 3. In addition to this model of overall risk of death, we also estimated a model for the risk of death with a functioning graft. The hazard ratio of death with a functioning graft for the USA relative to Spain was 2.31 (P < 0.001). Table 2 shows the adjusted rates per 1000 person-years of DWFG by diabetes status.
Fig. 3.
(a) Adjusted patient survival in non-diabetic US and Spanish kidney transplant recipients who have survived at least 1 year since transplantation. (b) Adjusted patient survival in diabetic US and Spanish kidney transplant recipients who have survived at least 1 year since transplantation.
Table 2.
Adjusted rate of DWGF in US and Spanish kidney transplant recipients alive with a functioning graft 1 year after transplantation
| Adjusted rate of DWGF per 1000 person-years |
|||
|---|---|---|---|
| 3 years | 5 years | 10 years | |
| Patients with diabetes mellitus as cause of ESRD | |||
| Spain | 14.0 | 17.7 | 23.9 |
| USA | 30.0 | 38.9 | 53.8 |
| P-value* | <0.001 | <0.001 | <0.001 |
| Patients with all other causes of ESRD | |||
| Spain | 6.6 | 8.7 | 11.0 |
| USA | 14.7 | 19.4 | 25.4 |
| P-value* | <0.001 | <0.001 | <0.001 |
*P-value from tests of differences of underlying survival estimates.
Discussion
Spanish recipients had better overall graft and patient survival compared with US recipients in this study, which combined data from the USA and Spain and defined the covariates the same way in both countries. These results are consistent with previous studies comparing the USA to Canada, the UK and Australia-New Zealand [12,13]. Estimates of overall graft survival [death with graft function (DWGF) treated as graft failure] and death-censored graft survival yielded similar values of 10-year survival for Spain −71% (death as graft failure) and 76% (death-censored), while the estimates for the USA were quite different −53% (when DWGF was treated as graft failure) and 76% (death-censored graft survival). The underlying causes of these differences cannot be elucidated from the available data.
A notable difference between the US and Spanish study cohorts is the underlying cause of ESRD among the transplant recipients in the current study. Over one-third of the US cohort had either diabetes or hypertension as the cause of their ESRD (36.8%) compared with one-eighth of the Spanish cohort (12.8%). Both of these causes of ESRD are associated with substantial comorbidities, including CVD, which was the leading cause of death for both cohorts. Owing to the lack of data on CVD, blood pressure, hemoglobin A1C, cholesterol and other co-existing complications of diabetes in the US registry data, it was not possible to account for these important explanatory covariates in the analysis of DWGF. Thus, a complete profile of the differences between the two countries in the overall health status of the patients at the time of transplantation was not evaluable.
Although US kidney transplant recipients in this study had higher mortality compared with Spanish kidney transplant recipients, there are potentially contributory stark differences in the mortality rates in the general population and in the ESRD population between the countries [19–22]. For example, annual mortality rates among dialysis patients were between 20.9 and 22.7% in the USA and 13.0–14.0% in Spain during the study years (P < 0.01) [19–21]. As depicted in Table 1, there was also a difference in the total ESRD time prior to transplantation which was 2.2 ± 2.2 years for US recipients and 2.7 ± 2.9 years for the Spanish recipients (P < 0.001). There are also differences between the countries with respect to access to both general medical care and immunosuppressive medications in the late post-transplant period [23–26]. Data suggest that US kidney transplant recipients are more vulnerable to medical noncompliance and increased risk of graft loss when access to Medicare immunosuppressive drug coverage is automatically terminated at 36 months after transplant (unless the recipients can establish Medicare eligibility on grounds of age or disability) [27–29]. The combination of restricted access to care, the loose long-term connection to transplant care providers and the economic burden of out-of-pocket medical expenses places the average US kidney transplant recipient at a great disadvantage in receiving the medical management necessary for optimal long-term post-transplant outcomes.
The current study was limited by non-uniform data collection methods across the two countries and the inability to verify the cause of death in the Spanish cohort. In addition, data on important variables (e.g. HCV serologic status) were missing in a significant minority of recipients, which could have biased the estimation of the effect of the covariate with the missing data.
In conclusion, this study reinforces the fact that successful kidney transplantation is still associated with a relatively high rate of long-term mortality. The cross countries differences in late post-transplant outcomes shown in this study have been documented in many studies that examined outcomes between countries. The contribution of variabilities in practice pattern and country-specific transplant recipient populations can be elucidated only in a prospective study of appropriation duration. Such a study may inform best practices to prolong survival of both kidney allografts and their recipients.
Acknowledgements
This paper was edited by Jennifer McCready-Maynes, an employee of Arbor Research Collaborative for Health. Gabriela Alperovich, an employee of Pfizer, Spain, coordinated data collection and management for the Chronic Spanish Allograft Nephropathy Study. Support was received from NIH Grant # K24 DK062234 (A.O.O.), HRSA Grant #234-2005-37009 C (A.O.O., D.S., R.M.M.) and Pfizer, Spain (to the Spanish Chronic Allograft Study Group). The SRTR was funded by contract number 234-2005-37009C from the Health Resources and Services Administration (HRSA), US Department of Health and Human Services. The views expressed herein are those of the authors and not necessarily those of the US Government. This is a US-Government-sponsored work. There are no restrictions on its use. This study was approved by HRSA's SRTR Project Officer. HRSA has determined that this study satisfies the criteria for the IRB exemption described in the ‘Public Benefit and Service Program’ provisions of 45 CFR 46.101(b)(5) and HRSA Circular 03.
Conflict of interest statement. A.O.O. received grant support from Pfizer, USA, for a separate investigator-initiated research project. A.O.O. received consulting fees and speaking honoraria from Pfizer, Genzyme, Roche and Novartis. J.M.M. has been the principal investigator in several trials from Astellas, Novartis, Roche and Wyeth. He has also received honoraria from these companies for lectures and advisory board duties. M.G.-M., D.E.S. and F.L.L. have no conflicts of interest. R.M.M., T.O., F.M., M.A., J.M.C., D.H. and D.S. also have no potential conflicts of interest. *The results presented in this paper have not been published previously in whole or part, except in abstract form.
(See related article by Yost and Kaplan. Comparing kidney transplant outcomes; caveats and lessons. Nephrol Dial Transplant 2013; 28: 9–11.)
References
- 1.Wolfe RA, Ashby VB, Milford EL, et al. Comparison of mortality in all patients on dialysis, patients on dialysis awaiting transplantation, and recipients of a first cadaveric transplant.[see comment] N Engl J Med. 1999;341:1725–1730. doi: 10.1056/NEJM199912023412303. doi:10.1056/NEJM199912023412303. [DOI] [PubMed] [Google Scholar]
- 2.Satayathum S, Pisoni RL, McCullough KP, et al. Kidney transplantation and wait-listing rates from the international Dialysis Outcomes and Practice Patterns Study (DOPPS) Kidney Int. 2005;68:330–337. doi: 10.1111/j.1523-1755.2005.00412.x. doi:10.1111/j.1523-1755.2005.00412.x. [DOI] [PubMed] [Google Scholar]
- 3.Owen WF., Jr Patterns of care for patients with chronic kidney disease in the United States: dying for improvement. J Am Soc Nephrol. 2003;14:S76–S80. doi: 10.1097/01.asn.0000070145.00225.ec. doi:10.1097/01.ASN.0000070145.00225.EC. [DOI] [PubMed] [Google Scholar]
- 4.Alexander GC, Sehgal AR. Barriers to cadaveric renal transplantation among blacks, women and the poor. J Am Med Assoc. 1998;280:1148–1152. doi: 10.1001/jama.280.13.1148. doi:10.1001/jama.280.13.1148. [DOI] [PubMed] [Google Scholar]
- 5.Goodkin DA, Bragg-Gresham JL, Koenig KG, et al. Association of comorbid conditions and mortality in hemodialysis patients in Europe, Japan, and the United States: the Dialysis Outcomes and Practice Patterns Study (DOPPS) J Am Soc Nephrol. 2003;14:3270–3277. doi: 10.1097/01.asn.0000100127.54107.57. doi:10.1097/01.ASN.0000100127.54107.57. [DOI] [PubMed] [Google Scholar]
- 6.Held PJ, Brunner F, Michio O, et al. Five-year survival for end-stage renal disease patients in the United States, Europe, and Japan, 1982–1987. Am J Kidney Dis. 1990;15:451–457. doi: 10.1016/s0272-6386(12)70363-3. [DOI] [PubMed] [Google Scholar]
- 7.Pisoni RL, Young EW, Dykstra DM, et al. Vascular access use in Europe and the United States: results from the DOPPS. Kidney Int. 2002;61:305–316. doi: 10.1046/j.1523-1755.2002.00117.x. doi:10.1046/j.1523-1755.2002.00117.x. [DOI] [PubMed] [Google Scholar]
- 8.Magee JC, Barr ML, Basadonna GP, et al. Repeat organ transplantation in the United States, 1996 to 2005. Am J Transplant. 2007;7:1424–1433. doi: 10.1111/j.1600-6143.2007.01786.x. doi:10.1111/j.1600-6143.2007.01786.x. [DOI] [PubMed] [Google Scholar]
- 9.Brennan DC, Daller JA, Lake KD, et al. Rabbit antithymocyte globulin versus basiliximab in renal transplantation. N Engl J Med. 2006;355:1967–1977. doi: 10.1056/NEJMoa060068. doi:10.1056/NEJMoa060068. [DOI] [PubMed] [Google Scholar]
- 10.Lorber MI, Mulgaonkar S, Butt KM, et al. Everolimus versus mycophenolate mofetil in the prevention of rejection in de novo renal transplant recipients: a 3-year randomized, multicenter, phase III study. Transplantation. 2005;80:244–252. doi: 10.1097/01.tp.0000164352.65613.24. doi:10.1097/01.TP.0000164352.65613.24. [DOI] [PubMed] [Google Scholar]
- 11.Womer KL, Kaplan B. Recent developments in kidney transplantation-A critical assessment. Am J Transplant. 2009;9:1265–1271. doi: 10.1111/j.1600-6143.2009.02639.x. doi:10.1111/j.1600-6143.2009.02639.x. [DOI] [PMC free article] [PubMed] [Google Scholar]
- 12.Kim SJ, Schaubel DE, Fenton SS, et al. Mortality after kidney transplantation: a comparison between the United States and Canada. Am J Transplant. 2006;6:109–114. doi: 10.1111/j.1600-6143.2005.01141.x. doi:10.1111/j.1600-6143.2005.01141.x. [DOI] [PubMed] [Google Scholar]
- 13.Merion RM, Moore J, Johnson RJ, et al. A tricontinental analyses of kidney transplant outcomes from three national registries. Transplantation. 2008;86:169. doi:10.1097/01.tp.0000332301.80616.fa. [Google Scholar]
- 14.Dickinson DM, Dykstra DM, Levine GN, et al. Transplant data: sources, collection and research considerations, 2004. Am J Transplant. 2005;5:850–861. doi: 10.1111/j.1600-6135.2005.00840.x. doi:10.1111/j.1600-6135.2005.00840.x. [DOI] [PubMed] [Google Scholar]
- 15.Seron D, Arias M, Campistol JM, et al. Late renal allograft failure between 1990 and 1998 in Spain: a changing scenario. Transplantation. 2003;76:1588–1594. doi: 10.1097/01.TP.0000092495.07385.3C. doi:10.1097/01.TP.0000092495.07385.3C. [DOI] [PubMed] [Google Scholar]
- 16.Morales JM, Dominguez-Gil B, Sanz-Guajardo D, et al. The influence of hepatitis B and hepatitis C virus infection in the recipient on late renal allograft failure. Nephrol Dial Transplant. 2004;19(Suppl 3):iii72–iii76. doi: 10.1093/ndt/gfh1020. doi:10.1093/ndt/gfh1020. [DOI] [PubMed] [Google Scholar]
- 17.Levey AS, Bosch JP, Lewis JB, et al. A more accurate method to estimate glomerular filtration rate from serum creatinine: a new prediction equation. Ann Int Med. 1999;130:461–470. doi: 10.7326/0003-4819-130-6-199903160-00002. [DOI] [PubMed] [Google Scholar]
- 18.von Elm E, Altman DG, Egger M, et al. STROBE Initiative. The Strengthening the Reporting of Observational Studies in Epidemiology (STROBE) statement: guidelines for reporting observational studies. Lancet. 2007;370:1453–1457. doi: 10.1016/S0140-6736(07)61602-X. doi:10.1016/S0140-6736(07)61602-X. [DOI] [PubMed] [Google Scholar]
- 19.Spanish Nephrology Association Registry Committee. 1997 Spanish Nephrology Association (Sociedad Española de Nefrologia) report on dialysis and transplantation. Nephrol Dial Transplant. 1999;14:2841–2845. doi: 10.1093/ndt/14.12.2841. doi:10.1093/ndt/14.12.2841. [DOI] [PubMed] [Google Scholar]
- 20.Amenabar JJ, Garcia Lopez F, Robles NR, et al. Informe de diálisis y trasplante de la Sociedad Española de Nefrología y Registros Autonómicos, año 2000. Nefrología. 2002;XXII:310–317. [PubMed] [Google Scholar]
- 21.Bethesda, MD: National Institutes of Health, National Institute of Diabetes and Digestive and Kidney Diseases; 2004. Table H.4 Annual Mortality Rates per 1000 Patient Years at Risk: Hemodialysis Patients, by Primary Diagnosis, Adjusted, period prevalent patients, 2001 ESRD patients as reference. U.S. Renal Data System, USRDS 2004 Annual Data Report: Atlas of End-Stage Renal Disease in the United States. [Google Scholar]
- 22.CDC/NCHS, National Vital Statistics System, Mortality. Unpublished table NEWSTAN 79–98S created on 2000/03/02 http://www.cdc.gov/nchs/data/mortab/aadr7998s.pdf. 13 February 2012, date last accessed)
- 23.Howard AD. Long-term management of the renal transplant recipient: optimizing the relationship between the transplant center and the community nephrologist. Am J Kidney Dis. 2001;38:S51–S57. doi: 10.1053/ajkd.2001.28926. doi:10.1053/ajkd.2001.28926. [DOI] [PubMed] [Google Scholar]
- 24.Israni AK, Snyder JJ, Skeans MA, et al. Who is caring for kidney transplant patients? Variation by region, transplant center, and patient characteristics. Am J Nephrol. 2009;30:430–439. doi: 10.1159/000239220. doi:10.1159/000239220. [DOI] [PubMed] [Google Scholar]
- 25.Djamali A, Samaniego M, Muth B, et al. Medical care of kidney transplant recipients after the first posttransplant year. Clin J Am Soc Nephrol. 2006;1:623–640. doi: 10.2215/CJN.01371005. doi:10.2215/CJN.01371005. [DOI] [PubMed] [Google Scholar]
- 26.Kasiske BL, Vazquez MA, Harmon WE, et al. Recommendations for the outpatient surveillance of renal transplant recipients. J Am Soc Nephrol. 2000;11:S1–S86. [PubMed] [Google Scholar]
- 27.Kasiske BL, Cohen D, Lucey MR, et al. for the American Society of Transplantation. Payment for immunosuppression after organ transplantation. J Am Med Assoc. 2000;283:2445–2450. doi: 10.1001/jama.283.18.2445. doi:10.1001/jama.283.18.2445. [DOI] [PubMed] [Google Scholar]
- 28.Butkus DE, Meydrech EF, Raju SS. Racial differences in the survival of cadaveric renal allografts. Overriding effects of HLA matching and socioeconomic factors [see comments] N Engl J Med. 1992;327:840–845. doi: 10.1056/NEJM199209173271203. doi:10.1056/NEJM199209173271203. [DOI] [PubMed] [Google Scholar]
- 29.Butler JA, Roderick P, Mullee M, et al. Frequency and impact of nonadherence to immunosuppressants after renal transplantation: a systematic review. Transplantation. 2004;77:769–776. doi: 10.1097/01.tp.0000110408.83054.88. doi:10.1097/01.TP.0000110408.83054.88. [DOI] [PubMed] [Google Scholar]