Abstract
Previous studies in mice and rats have shown that selective breeding for high and low ethanol preference results in divergence of circadian phenotype in the selected lines. These results indicate that some alleles influencing ethanol preference also contribute to circadian rhythm regulation. Selective breeding has also been used to produce lines of mice differing in a number of other ethanol-related traits, while studies of phenotypic and genetic correlation indicate that diverse ethanol-related traits are influenced by both shared and unshared genetics. In the present study, we examined several features of circadian activity rhythms in a mouse line selected for binge-like drinking and in mouse lines selected for high and low sensitivity to ethanol withdrawal convulsions. Specifically, Experiment 1 compared High Drinking in the Dark (HDID-1) mice to their genetically heterogeneous progenitor line (HS/Npt), and Experiment 2 compared Withdrawal Seizure-Prone (WSP-2) and Withdrawal Seizure-Resistant (WSR-2) mice. Both line pairs displayed differences in their daily activity patterns under light-dark conditions. In addition, HDID-1 mice showed shorter free-running periods in constant light and less coherent activity rhythms across lighting conditions relative to HS/Npt controls, while WSP-2 mice showed longer free-running periods in constant darkness relative to WSR-2 mice. These results strengthen the evidence for genetic linkages between responsiveness to ethanol and circadian regulation, and extend this evidence to include ethanol-related phenotypes other than preference drinking. However, the present results also indicate that the nature of genetic correlations between and within phenotypic domains is highly complex.
Keywords: binge drinking, ethanol withdrawal, circadian activity rhythms, selective breeding
Introduction
Several lines of research have revealed bidirectional interactions between alcohol (ethanol) intake and circadian clock function at both the physiological and genetic levels. Thus, ethanol exposure alters free-running circadian period and responsiveness to phase-shifting stimuli (Mistlberger and Nadeau, 1992; Rosenwasser et al, 2005a, 2005b; Seggio et al., 2007, 2009), in part via ethanol-induced alterations in neurotransmission (McElroy et al., 2009; Ruby et al., 2009a, 2009b; Brager et al., 2010, 2011a) and gene expression (Sanna et al., 1993; Madeira et al., 1997; Chen et al., 2004) within the suprachiasmatic nucleus (SCN) circadian pacemaker. Conversely, both environmental perturbation of circadian rhythms (Gauvin et al., 1997; Clark et al., 2007; Rosenwasser et al., 2010) and clock gene mutations (Spanagel et al., 2005; Dong et al., 2011; Brager et al., 2011b) alter voluntary ethanol intake.
Selectively-bred lines of rats and mice have been used widely to reveal genetic influences on various responses to ethanol, including preference drinking, withdrawal severity, and three responses to acute ethanol--hypothermia, sedation, and locomotor stimulation (Phillips et al., 1989). Of particular importance, selected lines can help elucidate genetic correlations among diverse ethanol-related traits. Thus, if selection for a specific phenotype also results in correlated line differences in another, non-selected trait, this suggests that the two traits share partially overlapping genetic determinants, especially if the phenotypic relationship can be replicated in multiple independently derived replicate lines (Crabbe et al., 1990). For example, mice selected for high and low ethanol preference also show differential severity to ethanol withdrawal (low and high, respectively), while conversely, selection for high and low withdrawal results in differential ethanol preference (Metten et al., 1998). While these results are consistent with the inverse genetic correlation between ethanol preference and withdrawal seen among inbred mouse strains (Metten et al., 1998; Metten and Crabbe, 2005), the effects of selection for withdrawal severity on ethanol preference have been somewhat inconsistent across studies (Kosobud et al., 1988; Hitzemann et al., 2009; Ford et al., 2011).
A similar approach can also be employed to explore possible genetic correlations between ethanol-related phenotypes and neurobehavioral traits other than those directly related to ethanol responsiveness. For example,Hofstetter et al. (2003a) examined free-running circadian activity rhythms in selectively-bred High Alcohol Preferring (HAP) and Low Alcohol Preferring (LAP) mice (now referred to as HAP-1 and LAP-1 respectively, due to the subsequent derivation of replicate lines), and found that HAP mice displayed shorter circadian periods in constant darkness (DD) than did LAP mice. While a more recent study failed to replicate this finding in the HAP-2 and LAP-2 lines, HAP-2 mice did display shorter free-running period during free-choice ethanol availability (Trujillo et al., 2011). Together, these results suggest that selection for ethanol preference results in the segregation of alleles influencing a fundamental property of the underlying circadian pacemaker, its inherent period.
Rosenwasser et al. (2005c) examined circadian activity rhythms in two sets of selectively bred ethanol-preferring and non-preferring rat lines: the high drinking P (Preferring) and HAD-2 (High Alcohol Drinking, replicate 2) lines, and their corresponding low drinking NP (Non-Preferring) and LAD-2 (Low Alcohol Drinking) lines. While both line pairs were generated using identical selection criteria, the P and NP animals were derived from different progenitor stock and thus have dissimilar genetic backgrounds (Murphy et al., 2002). While HAD-2 rats expressed shorter freerunning periods in DD than LAD-2 rats, P rats displayed shorter free-running periods than NP rats only in constant light (LL), but not in DD. Further, P rats were less able than NP rats to entrain their circadian rhythms to non-24-hour light-dark (LD) cycles. Taken together, these results indicate selection for ethanol preference altered the inherent pacemaker period in HAD-2/LAD-2 rats but modified the light-responsiveness of the circadian pacemaker in P/NP rats.
In the present study, we explored possible effects of selection for ethanol-related traits other than preference drinking on circadian phenotype, including ethanol withdrawal severity and binge-like drinking to intoxication. Withdrawal Seizure Prone (WSP-1, WSP-2) and Withdrawal Seizure Resistant (WSR-1, WSR-2) replicate lines were selected for high and low severity of handling-induced convulsions following ethanol vapor exposure (Kosobud and Crabbe, 1986; Crabbe and Phillips, 1993). While initial reports indicated that WSP mice display reduced ethanol preference drinking relative to WSR mice (Kosobud et al., 1988), this difference seems to have largely disappeared in the current descendents of these animals, despite persistence of differential withdrawal severity (Ford et al., 2011; Rosenwasser et al., 2012).
Recently, replicate lines of High Drinking in the Dark (HDID-1, HDID-2) mice have been selected based on achievement of high blood ethanol concentrations (BECs) in the “Drinking in the Dark” (DID) protocol, a putative model of binge-like drinking (Rhodes et al., 2005; Crabbe et al., 2009, 2010). In the typical DID test, animals are offered 20% ethanol as their only fluid for a 2–4 hour period during the early dark phase of the LD cycle and achieve intoxicating BECs (Crabbe et al, 2009). Across a panel of inbred strains, differences in DID correlate positively with differences in 24-hour preference drinking, indicating that these two traits partially depend on shared genes (Rhodes et al., 2006). Nevertheless, despite the dramatic difference in DID drinking between HDID mice and the genetically heterogeneous HS/Npt (HS) progenitor line, these two lines display little or no difference in either 24-hour preference drinking (Crabbe et al., 2011; Rosenwasser et al., 2012) or acute and chronic withdrawal severity (Crabbe et al., 2012).
In the present experiments, we assayed several parameters of circadian activity rhythms under LD, DD, and LL conditions in HDID-1 and HS mice (Experiment 1) and in WSP-2 and WSR-2 mice (Experiment 2). We found that selection for both ethanol withdrawal severity and binge-like drinking results in differences in circadian phenotype, thus strengthening the evidence for genetic linkages between ethanol responsiveness and circadian regulation.
Materials and Methods
Subjects and apparatus
All mice employed in these experiments were shipped to the University of Maine from breeding colonies maintained at the Oregon Health & Science University. Experiment 1 used male HDID-1and HS mice (N = 15 per line) whereas Experiment 2 used male WSP-2 and WSR-2 mice (N = 13 per line); the two experiments were otherwise identical. HDID-1 mice were from the 18th selection generation (S18), and HS/Npt mice were from the 70th generation (G70). WSP-2 and WSR-2 mice were initially selected for 26 generations, followed by long-term unselected breeding (S26G120 and S26G121, respectively). Mice arrived in the laboratory at 6–8 weeks of age and were immediately placed individually into running-wheel cages (Coulbourn Instruments, Lafayette, IN; wheel diameter = 11.5 cm) housed within light-controlled and sound-shielded cabinets. Wheel turns were monitored continuously by microswitches mounted outside of the cage body, and running-wheel activity was recorded and analyzed using the ClockLab interface system (Coulbourn Instruments, Lafayette, IN). Food (Prolab RMH 3000) and tap water were available ad libitum.
Procedures
Animals were maintained initially under a standard LD 12:12 cycle for 3 weeks, followed by an abrupt 6-hour phase-advance of the LD cycle, and followed 3 weeks later by an abrupt 6-hour phase-delay of the LD cycle. These conditions allowed us to determine the overall shape of the circadian activity waveform under stable LD conditions, and to evaluate the number of transient cycles required for animals to adapt to LD phase-shifts. Next, after 3 additional weeks of LD entrainment, animals were exposed to DD for 3 weeks and finally to LL for 3 weeks. These procedures allowed us to evaluate the free-running circadian period and to determine the spectral magnitude (“coherence”) of the activity rhythm in both DD and LL. Analyses of days required for phase-shifting and free-running period were performed by two independent observers in a semi-automated manner using ClockLab’s onset-detection algorithm, while spectral magnitude was determined using the Lomb-Scargle periodogram. Circadian parameters were compared across lighting conditions and breeding lines using 2-factor repeated-measures ANOVA with lighting conditions as the repeated factor, and pair-wise comparisons were performed using the LSD test (SPSS, Chicago IL, USA).
Ethics
These experiments were pre-approved by the University of Maine Institutional Animal Care and Use Committee (IACUC), and were conducted in accordance with all applicable regulations including the NIH Guide to the Care and Use of Laboratory Animals.
Results
Experiment 1: HDID vs. HS
Qualitative features of activity patterns
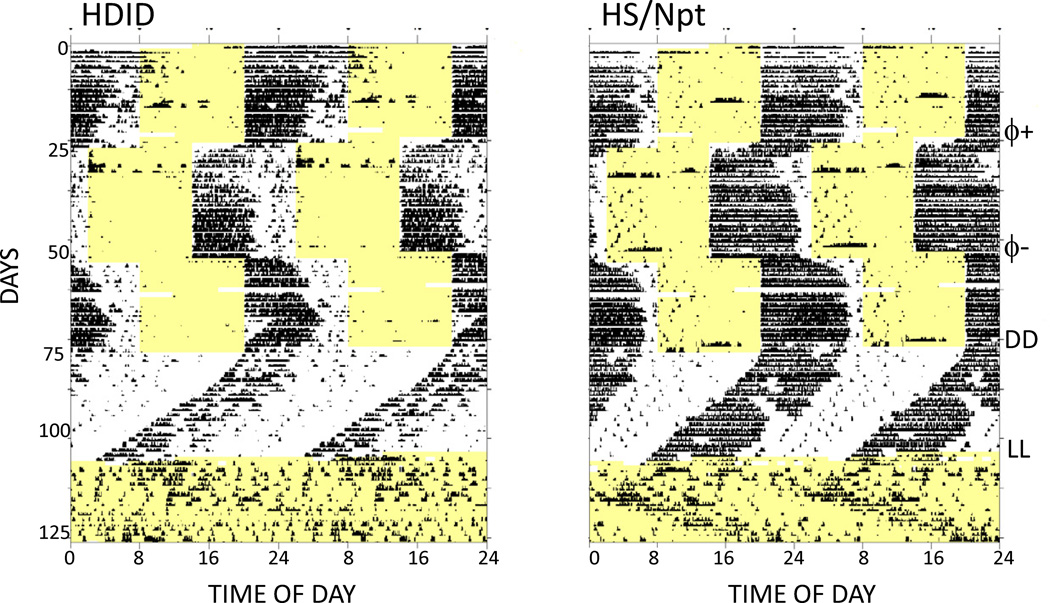
HDID and HS mice displayed circadian activity patterns that were generally similar to one another, and typical of those seen in other nocturnal rodents (Fig. 1). Under initial LD conditions, animals of both lines mainly confined their running-wheel activity to the hours of darkness, with the highest activity levels occurring in the first half of the dark phase. Further, both lines adapted readily to advance and delay phase-shifts of the LD cycle, and as is typical, advance phase shifts required a more extended adaptation period than delay shifts. Under DD, both lines displayed well-organized free-running activity rhythms with periods less than 24 hours, whereas both lines displayed generally less coherent rhythms with periods longer than 24 hours in LL.
Figure 1.
Double-plotted, raster-style circadian actograms from one representative HDID-1 and one representative HS/Npt mouse. Each 10-minute bin is represented by a bar whose height is proportional to the amount of activity occurring within that time bin. Time of day (48-hour span) and successive days are indicated along the X- and Y-axes respectively. Yellow shaded areas show times that the lights were on. Animals were initially maintained under a light-dark 12:12 cycle, and experimental manipulations are indicated at the far right, as follows: 6-hour phase advance, ϕ+; phase delay, ϕ-; first day of constant darkness, DD; first day of constant light, LL.
Circadian waveforms
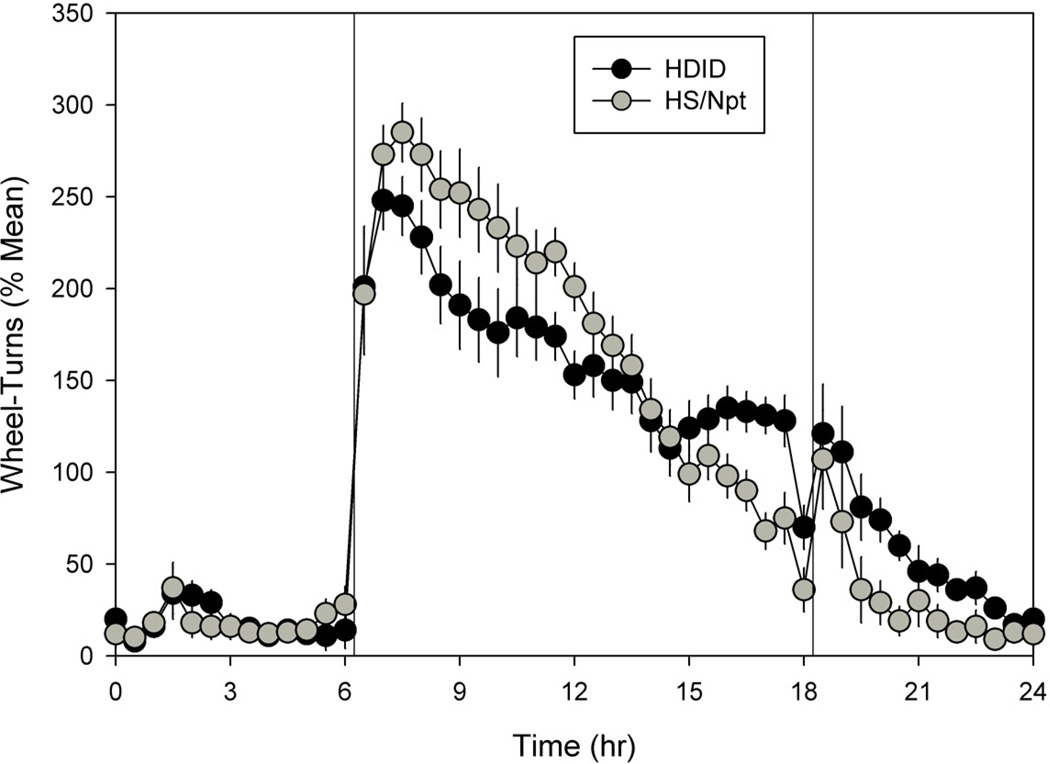
Analysis of averaged circadian waveforms revealed subtle differences in the daily temporal organization of running-wheel activity between lines (Fig. 2). Thus, HDIDs generally showed lower activity during the early dark phase of the LD cycle and higher activity during the late dark phase and early light phase, relative to HS mice. These observations were confirmed by two-factor repeated-measures ANOVA (breeding line, time of day), which revealed a significant line by time interaction (F[47,1316] = 2.139, p < 0.001), and by pair-wise comparisons for each time-point, which showed significant line differences at hours 8.5, 9.0, 9.5, 11.5, 12.0, 16.5, 17.0, 20.0, 20.5, 22.0 and 23.0.
Figure 2.
Daily activity pattern (waveform) for HDID-1 (black symbols) and HS/Npt mice (grey symbols), averaged across animals and across days of the initial light-dark condition; error bars show SEMs. Data were normalized to each individual’s mean prior to averaging; this procedure removes variance due to individual differences in overall activity levels. Vertical lines indicate the beginning and end of the daily dark phase.
Phase shifts
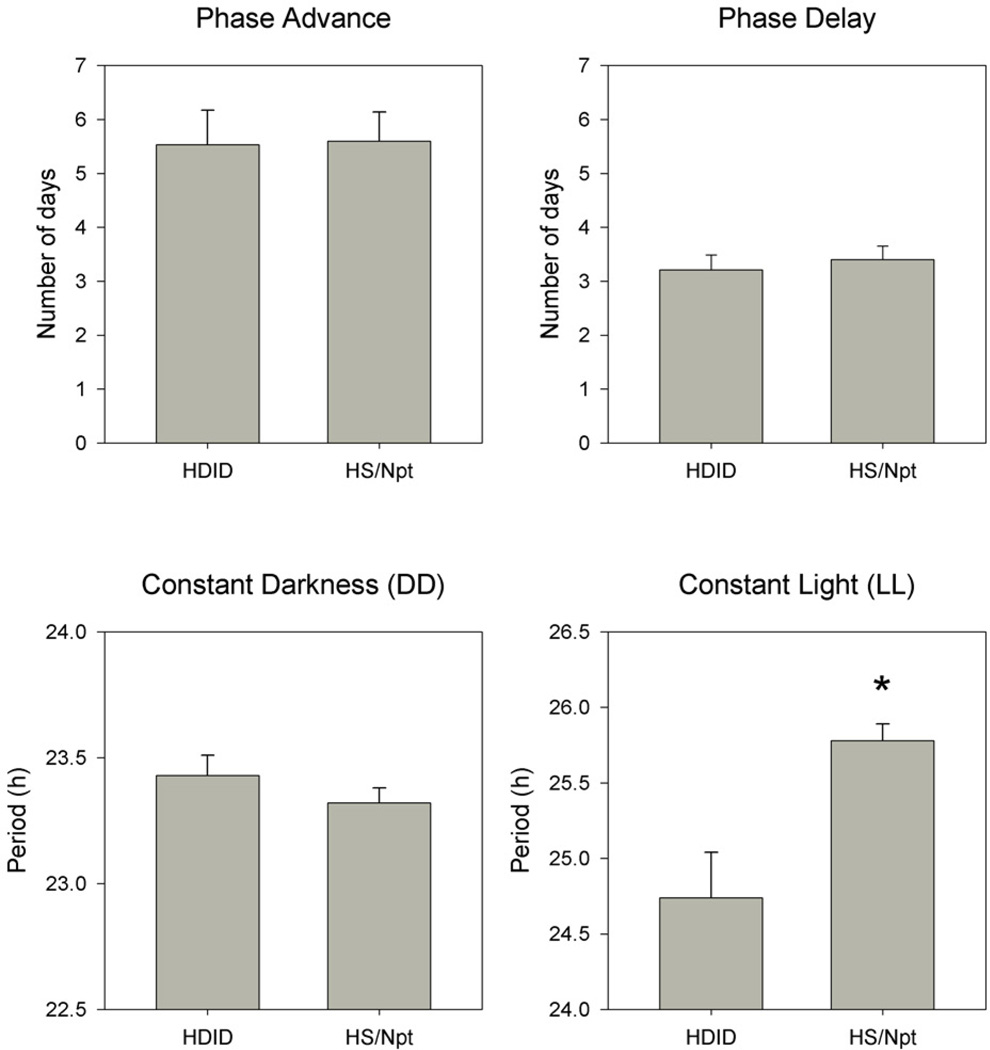
As suggested by inspection of the activity records, LD phase advances required more days for adaptation than did phase delays (Fig. 3). Two-factor repeatedmeasures ANOVA (breeding line, shift direction) on the number of days required for complete adaptation revealed a significant effect of shift direction (F[1,27] = 18.508, p < 0.001) but no effect of line nor any line by direction interaction.
Figure 3.
Mean (+ SEM) number of days required to fully adapt to light-dark phase advance (upper left) and light-dark phase delay (upper right), and free-running period in constant darkness (DD, lower left) and constant light (LL, lower right), in HDID-1 and HS/Npt mice. Asterisk indicates significant difference between breeding lines.
Free-running period
In LL, three animals from each line did not show clearly identifiable free-running activity rhythms and were thus excluded from the statistical analysis of free-running period. Two-factor repeated-measures ANOVA (breeding line, DD vs. LL) confirmed that free-running periods were shorter in DD than LL (F[1,17] = 79.046, p < 0.001) and also revealed a significant main effect of line (F[1,17] = 7.781, p = 0.013) and a significant line by lighting interaction (F[1,17] = 6.947, p = 0.017) (Fig. 3). Thus, while HDID mice showed shorter free-running periods than HS mice overall, this difference was only significant in LL.
Spectral magnitude
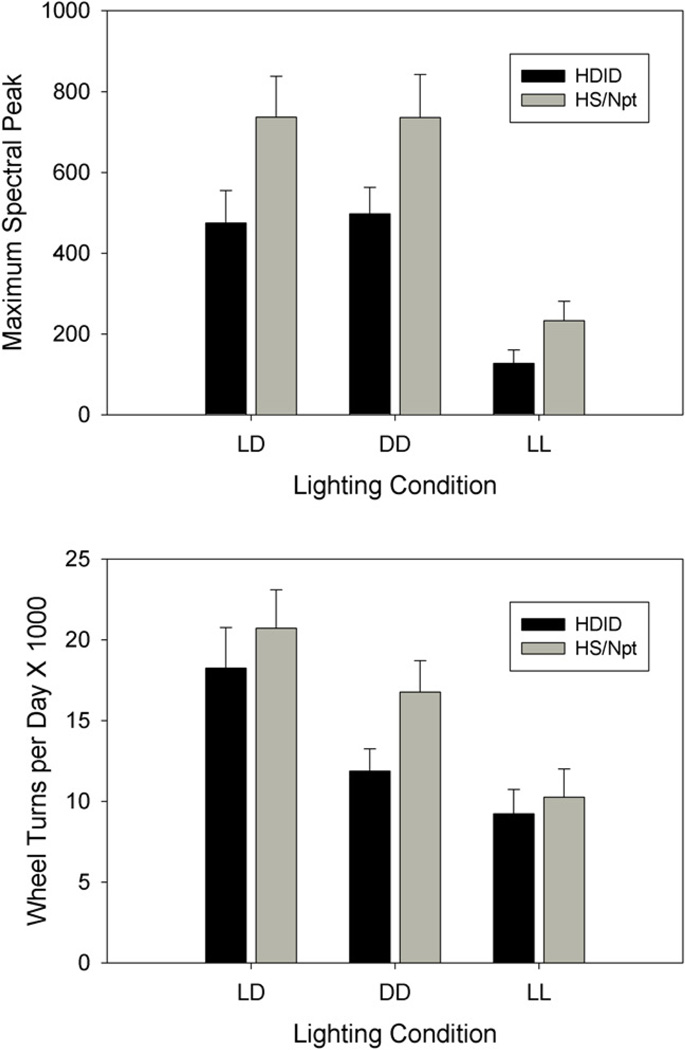
Analysis of spectral peak magnitude showed main effects of breeding line (F[1,21] = 4.786, p = 0.040) and lighting condition (F[2,42] = 26.077, p < 0.001), but no line by condition interaction (Fig. 4). Thus, HDID mice displayed reduced spectral magnitude relative to HS mice across the experiment, but the two lines showed similar changes across lighting conditions.
Figure 4.
Mean (+ SEM) maximum circadian spectral peak (top) and total daily wheel turns (bottom) under light-dark (LD), constant darkness (DD) and constant light (LL) conditions, in HDID-1 and HS/Npt mice.
Activity level
Analysis of activity levels showed a significant main effect of lighting (F[2,44] = 10.970, p < 0.001), in that activity levels progressively decreased from LD to DD to LL (Fig. 4). Despite the fact that HDIDs were somewhat less active than HS mice across the experiment, there was no significant effect of line, nor any line by lighting condition interaction.
Experiment 2: WSP vs. WSR
Qualitative features of activity patterns
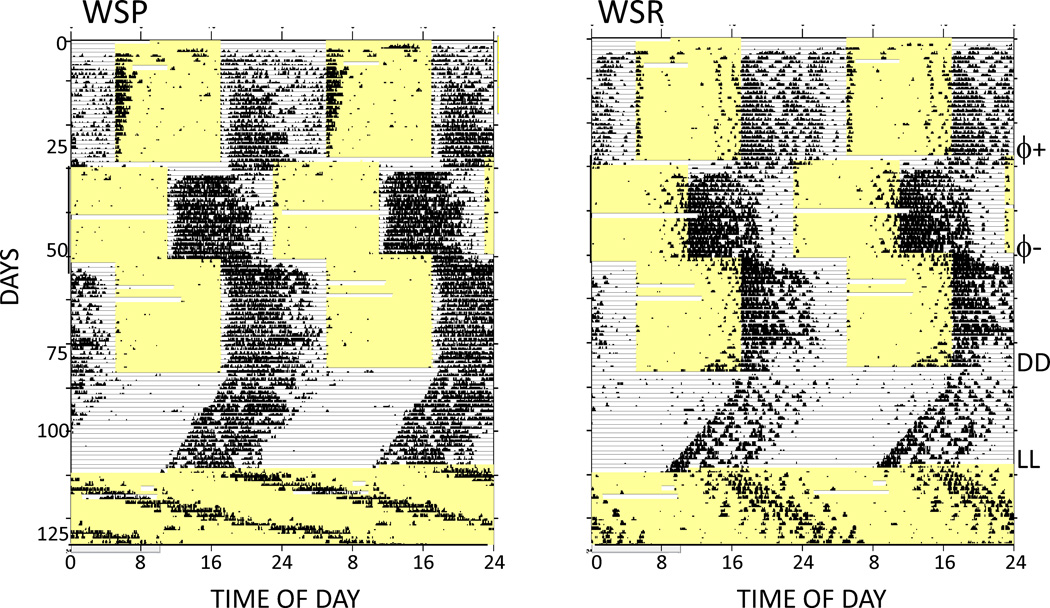
Activity patterns seen in WSP and WSR mice were generally similar to those typically observed in nocturnal rodents (Fig. 5). Activity occurred largely during the dark phase of the LD cycle, readily adapted to both advance and delay phase shifts, and free-ran with shorter than 24 hour periods in DD and with longer than 24 hour periods in LL. Nevertheless, activity patterns in these lines did present a few unusual features as well. Thus, WSP mice typically showed little or no activity for the first 1–2 hours of the dark phase of the LD cycle, as well as high levels of activity during the first 1–2 hours of the light phase, features that were not noted in WSR mice. In contrast, WSRs showed scattered bouts of activity during the last few hours of the light phase that were not seen in WSP mice.
Figure 5.
Double-plotted, raster-style circadian actograms from one representative WSP-2 and one representative WSR-2 mouse. All other conventions are as in Figure 1.
Circadian waveforms
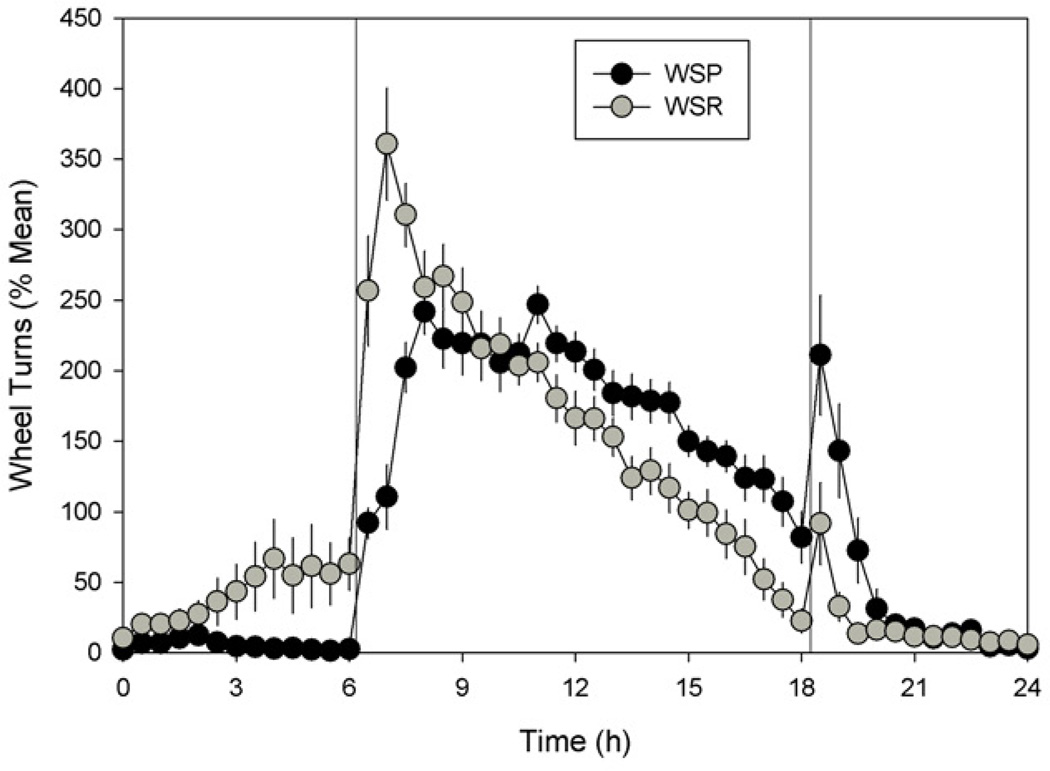
Analysis of averaged circadian waveforms (Fig. 6) confirmed that WSP and WSR mice exhibit reliable differences in daily activity patterns under LD cycles. There was a significant line by time-point interaction (F[47,1175] = 7.197, p < 0.001), while pair-wise comparisons at each time point showed that WSRs were more active than WSPs both before and after lights-on (i.e., at times 5.5, 6.0, 6.5, 7.0 and 7.5), while WSPs were more active than WSRs from mid-dark through the early light phase (i.e., at times 13.5, 14.0, 14.5, 15.0, 16.5, 17.0, 17.5, 18.0, 18.5, 19.0 and 19.5).
Figure 6.
Daily activity pattern (waveform) for WSP-2 (black symbols) and WSR-2 mice (grey symbols), averaged across animals and across days of the initial light-dark condition; error bars show SEMs. All other conventions as in Figure 2.
Phase shifts
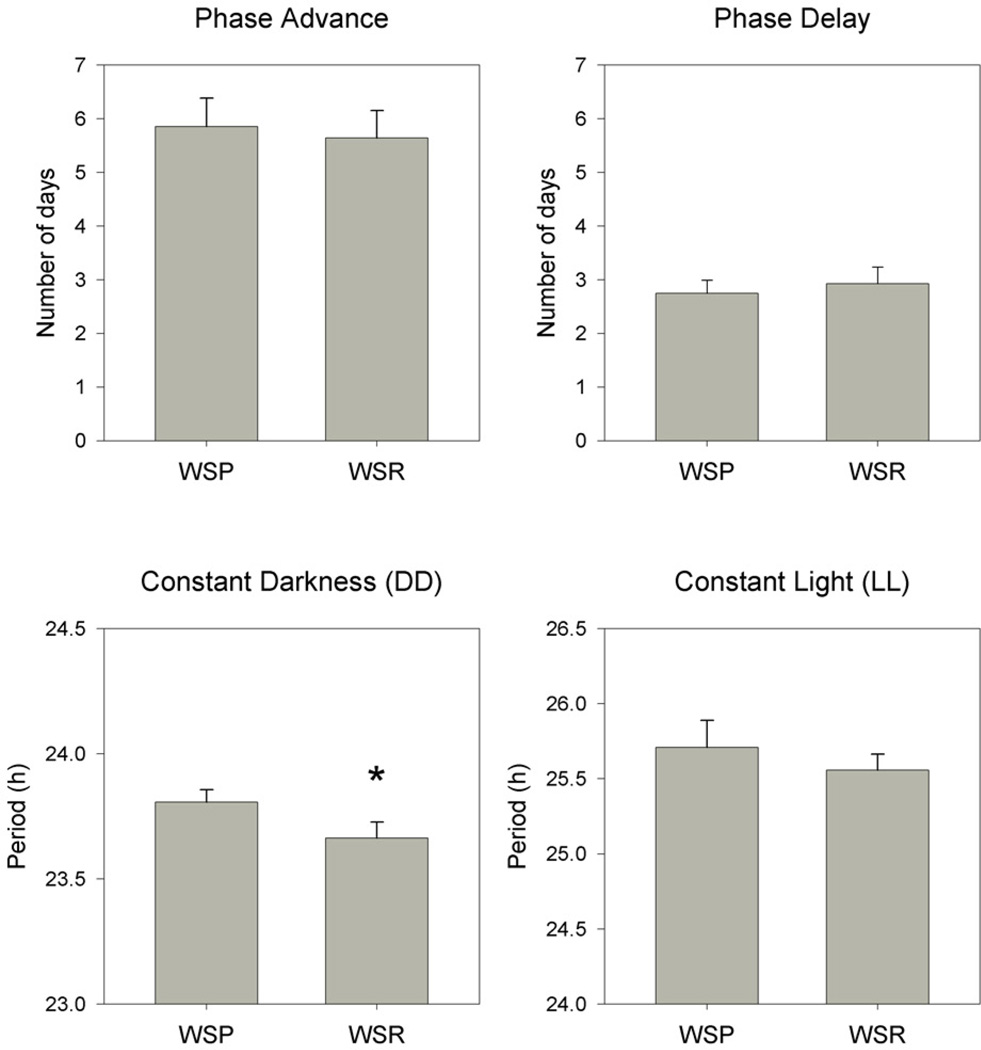
As is typical, LD phase advances required more days time for adaptation than did phase delays, but no line differences were seen in the number of days required for complete adaptation (Fig. 7). There was a significant effect of shift direction (F[1,26]= 66.585, p < 0.001) but no effect of line nor any line by direction interaction.
Figure 7.
Mean (+ SEM) number of days required to fully adapt to light-dark phase advance (upper left) and light-dark phase delay (upper right), and free-running period in constant darkness (DD, lower left) and constant light (LL, lower right), in WSP-2 and WSR-2 mice. Asterisk indicates significant difference between breeding lines.
Free-running period
Free-running periods were shorter in DD than LL (F[1,24] = 250.861, p < 0.001), but there was no significant main effect of breeding line nor any line by lighting conditions interaction (Fig. 7). Nevertheless, pair-wise comparison revealed a non-significant trend (p = 0.050) towards longer periods in WSPs than in WSRs under DD.
Spectral magnitude
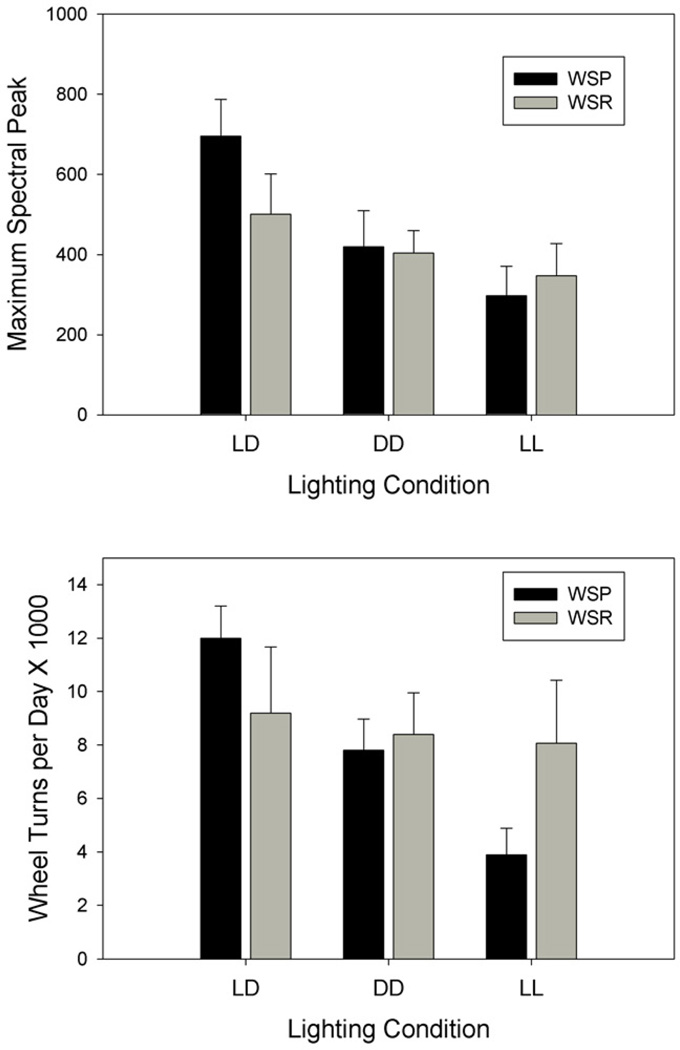
Analysis of spectral peak magnitude showed a main effect of lighting condition (F[2,46] = 6.166, p =0.004), but no line effect or line by condition interaction (Fig. 8). Thus, WSP and WSR mice displayed similar spectral magnitudes across lighting conditions.
Figure 8.
Mean (+ SEM) maximum circadian spectral peak (top) and total daily wheel turns (bottom) under light-dark (LD), constant darkness (DD) and constant light (LL) conditions, in WSP-2 and WSR-2 mice.
Activity level
Analysis of activity levels revealed a significant main effect of lighting (F[2,44] = 6.389, p = 0.004) and a significant line by lighting interaction (F[2,44] = 4.505, p = 0.17) (Fig. 8). These results indicate that while WSP mice showed the expected reduction in running-wheel activity under LL relative to LD and DD, activity levels in WSR mice did not vary across lighting conditions. Despite the significant interaction, however, pair-wise tests failed to detect a significant line difference in any lighting condition.
Discussion
The present results indicate that selective breeding for binge-like ethanol drinking or for high and low ethanol withdrawal severity results in differences in the expression of circadian activity rhythms. These results complement and extend those of previous studies demonstrating alterations in circadian phenotype in selectively bred high and low ethanol-preferring mice (Hofstetter et al., 2003) and rats (Rosenwasser et al., 2005c). Taken together, these studies indicate that a number of genetic loci exert pleiotropic effects on both ethanol-related and circadian phenotypes. It should be noted, however, that virtually nothing is known regarding the mechanisms regulating daily activity waveforms, or the relative roles played by the circadian pacemaker and by non-circadian processes in producing these patterns. In contrast, alterations in freerunning period are widely accepted to directly reflect changes in circadian pacemaker function. Nevertheless, we refer here to both circadian waveform and period as “circadian phenotypes”, since these both characterize aspects of circadian expression.
While selected for different phenotypes, HDID and WSP mice may each be considered to be more “ethanol-responsive” than their respective HS and WSR comparison lines. It is interesting, therefore, that HDID and WSP mice displayed reduced activity in the early dark phase and increased activity in the late dark and early light phase, relative to their respective HS and WSR comparison lines. Since HDID mice showed reduced activity during the specific hours that the DID test is administered (i.e., 2–4 hours after lights-off), reduced activity at this time could conceivably contribute to the drinking patterns in HDID mice that lead to their elevated BECs, especially if activity during the DID test competes with ethanol drinking. Indeed, experiments are currently underway to evaluate the circadian pattern of food and water intake in HDID mice, which could help elucidate functional relationships among these behaviors.
It seems unlikely, however, that differences in locomotor activity contributed to the differential handling-induced convulsions for which WSP and WSR mice were bred. It is therefore noteworthy that some features of the daily activity waveforms were unique to particular lines. For example, WSR mice showed gradually increasing activity during the second half of the light phase that was not seen in WSPs or in either HDIDs or HS mice. And while alterations in free-running period were also detected in both line pairs, these effects were not correlated with changes in circadian waveforms. Thus, while HDID and WSP mice had similar activity patterns, HDIDs showed shorter free-running periods than HS mice only in LL, while WSPs showed a (non-significant) trend towards longer free-running periods than WSRs only in DD. Similar complexity emerges when considering the effects of selective breeding on spectral magnitude and daily activity levels. Thus, while HDIDs showed lower spectral magnitudes than HS mice, this parameter did not differ between WSPs and WSRs, and while WSPs and WSRs exhibited light-dependent line differences in daily activity levels, this parameter did not differ between HDIDs and HS mice. This pattern of results is reminiscent of our previous study of selectively-bred ethanol-preferring and non-preferring rat lines (Rosenwasser et al., 2005c). In that study, selection for ethanol preference was associated with differences in circadian waveform, and free-running period, spectral magnitude and daily activity level in both P/NP and HAD/LAD rats, but the pattern of results differed between the two line pairs as well as across lighting conditions, even though both line pairs were selected for the same ethanol-related trait.
Withdrawal severity, high BECs after binge-like drinking and 24-hour preference drinking are all complex polygenic traits, and subtle differences in such traits are often seen between replicate breeding lines, presumably due to the fixation of partially distinct gene sets. In the present experiments, we used HDID mice from the first replicate line (HDID-1) because at the time of these experiments, HDID-1 mice had undergone 18 generations of selection, whereas the more recently derived HDID-2 line had only been selected for 11 generations. In addition, we tested WSP-2 and WSR-2 mice but did not test WSP-1 or WSR-1 mice due to the unavailability of the replicate-1 animals at the time of these experiments. Nevertheless, the positive findings from these experiments indicate that it could indeed prove fruitful to repeat our observations using WSP-1, WSR-1 and HDID-2 mice. Similar findings with these additional genotypes would strengthen the evidence for genetic relationships between the selected ethanol-related traits and the specific circadian phenotypes studied here.
Comparisons among inbred strains have revealed robust genetic correlations among various ethanol-related traits [i.e., preference drinking is negatively correlated with withdrawal severity as assessed by handling-induced convulsions (Metten et al., 1998) and positively correlated with DID (Rhodes et al., 2006)], but these relationships are generally less reliable in selected lines than in inbred strains (Crabbe et al., 2010). Similarly, despite the identification of several large-effect circadian clock genes (Ko and Takahashi, 2006), circadian phenotypes are also complex polygenic traits, each influenced by partially distinct genetic loci (Shimomura et al., 2001). The genetic complexity of both ethanol-related and circadian phenotypes means that identifying which specific genes may contribute to genetic linkages between specific ethanol-related and circadian traits is likely to be very difficult.
The best current candidates for such pleiotropic effects would appear to be GABA-A receptor subunit genes. GABA-A receptors represent a primary target for ethanol action within the central nervous system, and contribute to several ethanol-related traits, including withdrawal severity and binge-like drinking (Lovinger, 2008; Clapp et al., 2008; Sprow and Thiele, 2012). Further, GABA-A receptors are highly expressed in the SCN, and play a major role in regulating circadian clock function (Gao et al., 1995; Ehlen et al., 2010), including mediation of ethanol effects on light-induced phase shifting (McElroy et al., 2009). Extensive effort has been invested in detecting quantitative trait loci (QTLs) for ethanol withdrawal in a number of reference populations, including in WSP×WSR F2 hybrids (Buck et al., 1997; 2002; Buck and Finn, 2001; Bergeson et al., 2003). These studies have identified a QTL region on chromosome 11 influencing withdrawal from ethanol and other GABA-A agonists, and harboring the genes for the α6, β2, and γ2 subunits. In addition, comparisons of null mutant and wild type mice have suggested a role for several GABA-A receptor-related genes in acute and/or chronic alcohol withdrawal (Crabbe et al., 2006). A number of QTLs for various circadian traits have been identified in diverse mapping populations, including a region of chromosome 11 contributing to the effects of light on free-running period in both the CXB and BXD recombinant inbred panels (Hofstetter et al., 1995; 2003b; Hofstetter and Mayeda, 1998). While this QTL does not overlap with that identified for withdrawal severity, it does include two additional GABA-A subunit genes (α1, α4), as well as the circadian clock gene, per1 (Hofstetter and Mayeda, 1998; Shimomura et al., 2001).
While little is known regarding specific genetic contributions to binge drinking in HDID mice, a recent study offers some initial data on ventral striatal gene expression in these lines (Iancu et al., submitted). While gene-by-gene analysis did not detect differential expression of GABA-A subunits in association with selection for DID, coexpression analysis detected numerous clusters of coexpressed genes (“expression modules”). For two of these modules, the degree of within-module correlation was markedly enhanced in both HDID-1 and HDID-2 lines as compared with the unselected HS control line. Among the handful of genes whose coordinated expression was greatly enhanced in one of these modules was Gabarg1, which encodes the γ1 subunit of the GABA-A receptor complex.
In summary, these results strengthen the evidence for genetic linkages between responsiveness to ethanol and circadian regulation, and extend this evidence to include ethanol-related phenotypes other than preference drinking. Since distinct ethanol-related and circadian traits are regulated by both shared and unshared genetic determinants as well as by distinct physiological mechanisms, it will be very difficult to identify specific genes and alleles with pleiotropic effects across these two phenotypic domains, but GABA-A receptor genes merit further exploration.
Acknowledgement
This research was supported by NIH grants AA10760, AA13519, and a grant from the Department of Veterans Affairs, to JCC.
Footnotes
Publisher's Disclaimer: This is a PDF file of an unedited manuscript that has been accepted for publication. As a service to our customers we are providing this early version of the manuscript. The manuscript will undergo copyediting, typesetting, and review of the resulting proof before it is published in its final citable form. Please note that during the production process errors may be discovered which could affect the content, and all legal disclaimers that apply to the journal pertain.
References
- Bergeson SE, Warren RK, Crabbe JC, Metten P, Erwin VG, Belknap JK. Chromosomal loci influencing chronic alcohol withdrawal severity. Mamm. Genome. 2003;14:454–463. doi: 10.1007/s00335-002-2254-4. [DOI] [PubMed] [Google Scholar]
- Brager AJ, Prosser RA, Glass JD. Circadian and acamprosate modulation of elevated ethanol drinking in mPer2 clock gene mutant mice. Chronobiol. Int. 2011b;28:664–672. doi: 10.3109/07420528.2011.601968. [DOI] [PMC free article] [PubMed] [Google Scholar]
- Brager AJ, Ruby CL, Prosser RA, Glass JD. Chronic ethanol disrupts circadian photic entrainment and daily locomotor activity in the mouse. Alcohol. Clin. Exp. Res. 2010;34:1266–1273. doi: 10.1111/j.1530-0277.2010.01204.x. [DOI] [PMC free article] [PubMed] [Google Scholar]
- Brager AJ, Ruby CL, Prosser RA, Glass JD. Acute ethanol disrupts photic and serotonergic circadian clock phase-resetting in the mouse. Alcohol. Clin. Exp. Res. 2011a;35:1467–1474. doi: 10.1111/j.1530-0277.2011.01483.x. [DOI] [PMC free article] [PubMed] [Google Scholar]
- Buck KJ, Finn DA. Genetic factors in addiction: QTL mapping and candidate gene studies implicate GABAergic genes in alcohol and barbiturate withdrawal in mice. Addiction. 2001;96:139–149. doi: 10.1046/j.1360-0443.2001.96113910.x. [DOI] [PubMed] [Google Scholar]
- Buck KJ, Metten P, Belknap JK, Crabbe JC. Quantitative trait loci involved in genetic predisposition to acute alcohol withdrawal in mice. J. Neurosci. 1997;17:3946–3955. doi: 10.1523/JNEUROSCI.17-10-03946.1997. [DOI] [PMC free article] [PubMed] [Google Scholar]
- Buck KJ, Rademacher BS, Metten P, Crabbe JC. Mapping murine loci for physical dependence on ethanol. Psychopharmacology (Berl) 2002;160:398–407. doi: 10.1007/s00213-001-0988-8. [DOI] [PubMed] [Google Scholar]
- Chen CP, Kuhn P, Advis JP, Sarkar DK. Chronic ethanol consumption impairs the circadian rhythm of pro-opiomelanocortin and period genes mRNA expression in the hypothalamus of the male rat. J. Neurochem. 2004;88:1547–1554. doi: 10.1046/j.1471-4159.2003.02300.x. [DOI] [PubMed] [Google Scholar]
- Clapp P, Bhave SV, Hoffman PL. How adaptation of the brain to alcohol leads to dependence. Alcohol Res. Health. 2008;31:310–339. [PMC free article] [PubMed] [Google Scholar]
- Clark JW, Fixaris MC, Belanger GV, Rosenwasser AM. Repeated light-dark phase shifts modulate voluntary ethanol intake in male and female high alcohol-drinking (HAD1) rats. Alcohol. Clin. Exp. Res. 2007;31:1699–1706. doi: 10.1111/j.1530-0277.2007.00476.x. [DOI] [PubMed] [Google Scholar]
- Crabbe JC, Colville AM, Kruse LC, Cameron AJ, Spence SE, Schlumbohm JP, Huang LC, Metten P. Ethanol tolerance and withdrawal severity in High Drinking in the Dark selectively bred mice. Alcohol. Clin. Exp. Res. 2012;36:1152–1161. doi: 10.1111/j.1530-0277.2011.01715.x. [DOI] [PMC free article] [PubMed] [Google Scholar]
- Crabbe JC, Metten P, Rhodes JS, Yu CH, Brown LL, Phillips TJ, Finn DA. A line of mice selected for high blood ethanol concentrations shows drinking in the dark to intoxication. Biol. Psychiatry. 2009;65:662–670. doi: 10.1016/j.biopsych.2008.11.002. [DOI] [PMC free article] [PubMed] [Google Scholar]
- Crabbe JC, Phillips TJ. Selective breeding for alcohol withdrawal severity. Behav. Genet. 1993;23:171–177. doi: 10.1007/BF01067422. [DOI] [PubMed] [Google Scholar]
- Crabbe JC, Phillips TJ, Belknap JK. The complexity of alcohol drinking: studies in rodent genetic models. Behav. Genet. 2010;40:737–750. doi: 10.1007/s10519-010-9371-z. [DOI] [PMC free article] [PubMed] [Google Scholar]
- Crabbe JC, Phillips TJ, Harris RA, Arends MA, Koob GF. Alcohol-related genes: contributions from studies with genetically engineered mice. Addict. Biol. 2006;11:195–269. doi: 10.1111/j.1369-1600.2006.00038.x. [DOI] [PubMed] [Google Scholar]
- Crabbe JC, Phillips TJ, Kosobud A, Belknap JK. Estimation of genetic correlation: interpretation of experiments using selectively bred and inbred animals. Alcohol. Clin. Exp. Res. 1990;14:141–151. doi: 10.1111/j.1530-0277.1990.tb00461.x. [DOI] [PubMed] [Google Scholar]
- Crabbe JC, Spence SE, Brown LL, Metten P. Alcohol preference drinking in a mouse line selectively bred for high drinking in the dark. Alcohol. 2011;45:427–440. doi: 10.1016/j.alcohol.2010.12.001. [DOI] [PMC free article] [PubMed] [Google Scholar]
- Dong L, Bilbao A, Laucht M, Henriksson R, Yakovleva T, Ridinger M, Desrivieres S, Clarke TK, Lourdusamy A, Smolka MN, et al. Effects of the circadian rhythm gene period 1 (per1) on psychosocial stress-induced alcohol drinking. Am. J. Psychiatry. 2011;168:1090–1098. doi: 10.1176/appi.ajp.2011.10111579. [DOI] [PubMed] [Google Scholar]
- Ehlen JC, Hummer DL, Paul KN, Albers HE. GABA involvement in the circadian regulation of sleep. In: Monti JM, Pandi-Perumal SR, Mohler H, editors. GABA and Sleep: Molecular, Functional and Clinical Aspects. Basel, Switzerland: Springer Basel; 2010. pp. 303–321. [Google Scholar]
- Ford MM, Fretwell AM, Anacker AM, Crabbe JC, Mark GP, Finn DA. The influence of selection for ethanol withdrawal severity on traits associated with ethanol self-administration and reinforcement. Alcohol. Clin. Exp. Res. 2011;35:326–337. doi: 10.1111/j.1530-0277.2010.01348.x. [DOI] [PMC free article] [PubMed] [Google Scholar]
- Gao B, Fritschy JM, Moore RY. GABAA-receptor subunit composition in the circadian timing system. Brain Res. 1995;700:142–156. doi: 10.1016/0006-8993(95)00944-l. [DOI] [PubMed] [Google Scholar]
- Gauvin DV, Baird TJ, Vanecek SA, Briscoe RJ, Vallett M, Holloway FA. Effects of time-of-day and photoperiod phase shifts on voluntary ethanol consumption in rats. Alcohol. Clin. Exp. Res. 1997;21:817–825. [PubMed] [Google Scholar]
- Hitzemann R, Edmunds S, Wu W, Malmanger B, Walter N, Belknap J, Darakjian P, McWeeney S. Detection of reciprocal quantitative trait loci for acute ethanol withdrawal and ethanol consumption in heterogeneous stock mice. Psychopharmacology (Berl) 2009;203:713–722. doi: 10.1007/s00213-008-1418-y. [DOI] [PMC free article] [PubMed] [Google Scholar]
- Iancu OD, Oberbeck D, Darakjian P, Metten P, McWeeney S, Crabbe JC, Hitzemann R. Selection for elevated blood alcohol levels after drinking in the dark alters brain gene coexpression networks. doi: 10.1111/acer.12100. Submitted. [DOI] [PMC free article] [PubMed] [Google Scholar]
- Hofstetter JR, Grahame NJ, Mayeda AR. Circadian activity rhythms in high-alcohol-preferring and low-alcohol-preferring mice. Alcohol. 2003a;30:81–85. doi: 10.1016/s0741-8329(03)00095-8. [DOI] [PubMed] [Google Scholar]
- Hofstetter JR, Mayeda AR. Provisional quantitative trait loci (QTL) for the Aschoff effect in RI mice. Physiol. Behav. 1998;64:97–101. doi: 10.1016/s0031-9384(98)00031-6. [DOI] [PubMed] [Google Scholar]
- Hofstetter JR, Mayeda AR, Possidente B, Nurnberger JI., Jr Quantitative trait loci (QTL) for circadian rhythms of locomotor activity in mice. Behav. Genet. 1995;25:545–556. doi: 10.1007/BF02327578. [DOI] [PubMed] [Google Scholar]
- Hofstetter JR, Trofatter JA, Kernek KL, Nurnberger JI, Mayeda AR. New quantitative trait loci for the genetic variance in circadian period of locomotor activity between inbred strains of mice. J. Biol. Rhythms. 2003b;18:450–462. doi: 10.1177/0748730403259468. [DOI] [PubMed] [Google Scholar]
- Ko CH, Takahashi JS. Molecular components of the mammalian circadian clock. Hum. Mol. Genet. 2006;15(Spec No 2):R271–R277. doi: 10.1093/hmg/ddl207. [DOI] [PubMed] [Google Scholar]
- Kosobud A, Bodor AS, Crabbe JC. Voluntary consumption of ethanol in WSP, WSC and WSR selectively bred mouse lines. Pharmacol. Biochem. Behav. 1988;29:601–607. doi: 10.1016/0091-3057(88)90026-3. [DOI] [PubMed] [Google Scholar]
- Kosobud A, Crabbe JC. Ethanol withdrawal in mice bred to be genetically prone or resistant to ethanol withdrawal seizures. J. Pharmacol. Exp. Ther. 1986;238:170–177. [PubMed] [Google Scholar]
- Lovinger DM. Communication networks in the brain: neurons, receptors, neurotransmitters, and alcohol. Alcohol Res. Health. 2008;31:196–214. [PMC free article] [PubMed] [Google Scholar]
- Madeira MD, Andrade JP, Lieberman AR, Sousa N, Almeida OF, Paula-Barbosa MM. Chronic alcohol consumption and withdrawal do not induce cell death in the suprachiasmatic nucleus, but lead to irreversible depression of peptide immunoreactivity and mRNA levels. J. Neurosci. 1997;17:1302–1319. doi: 10.1523/JNEUROSCI.17-04-01302.1997. [DOI] [PMC free article] [PubMed] [Google Scholar]
- McElroy B, Zakaria A, Glass JD, Prosser RA. Ethanol modulates mammalian circadian clock phase resetting through extrasynaptic GABA receptor activation. Neuroscience. 2009;164:842–848. doi: 10.1016/j.neuroscience.2009.08.020. [DOI] [PMC free article] [PubMed] [Google Scholar]
- Metten P, Crabbe JC. Alcohol withdrawal severity in inbred mouse (Mus musculus) strains. Behav. Neurosci. 2005;119:911–925. doi: 10.1037/0735-7044.119.4.911. [DOI] [PubMed] [Google Scholar]
- Metten P, Phillips TJ, Crabbe JC, Tarantino LM, McClearn GE, Plomin R, Erwin VG, Belknap JK. High genetic susceptibility to ethanol withdrawal predicts low ethanol consumption. Mamm. Genome. 1998;9:983–990. doi: 10.1007/s003359900911. [DOI] [PubMed] [Google Scholar]
- Mistlberger RE, Nadeau J. Ethanol and circadian rhythms in the Syrian hamster: effects on entrained phase, reentrainment rate, and period. Pharmacol. Biochem. Behav. 1992;43:159–165. doi: 10.1016/0091-3057(92)90652-v. [DOI] [PubMed] [Google Scholar]
- Murphy JM, Stewart RB, Bell RL, Badia-Elder NE, Carr LG, McBride WJ, Lumeng L, Li TK. Phenotypic and genotypic characterization of the Indiana University rat lines selectively bred for high and low alcohol preference. Behav. Genet. 2002;32:363–388. doi: 10.1023/a:1020266306135. [DOI] [PubMed] [Google Scholar]
- Phillips TJ, Feller DJ, Crabbe JC. Selected mouse lines, alcohol and behavior. Experientia. 1989;45:805–827. doi: 10.1007/BF01954056. [DOI] [PubMed] [Google Scholar]
- Rhodes JS, Best K, Belknap JK, Finn DA, Crabbe JC. Evaluation of a simple model of ethanol drinking to intoxication in C57BL/6J mice. Physiol. Behav. 2005;84:53–63. doi: 10.1016/j.physbeh.2004.10.007. [DOI] [PubMed] [Google Scholar]
- Rhodes JS, Ford MM, Yu CH, Brown LL, Finn DA, Garland T, Jr, Crabbe JC. Mouse inbred strain differences in ethanol drinking to intoxication. Genes Brain Behav. 2007;6:1–18. doi: 10.1111/j.1601-183X.2006.00210.x. [DOI] [PubMed] [Google Scholar]
- Rosenwasser AM, Clark JW, Fixaris MC, Belanger GV, Foster JA. Effects of repeated light-dark phase shifts on voluntary ethanol and water intake in male and female Fischer and Lewis rats. Alcohol. 2010;44:229–237. doi: 10.1016/j.alcohol.2010.03.002. [DOI] [PubMed] [Google Scholar]
- Rosenwasser AM, Fecteau ME, Logan RW. Effects of ethanol intake and ethanol withdrawal on free-running circadian activity rhythms in rats. Physiol. Behav. 2005a;84:537–542. doi: 10.1016/j.physbeh.2005.01.016. [DOI] [PubMed] [Google Scholar]
- Rosenwasser AM, Fecteau ME, Logan RW, Reed JD, Cotter SJ, Seggio JA. Circadian activity rhythms in selectively bred ethanol-preferring and nonpreferring rats. Alcohol. 2005c;36:69–81. doi: 10.1016/j.alcohol.2005.07.001. [DOI] [PubMed] [Google Scholar]
- Rosenwasser AM, Fixaris MC, Crabbe JC, Brooks PC, Ascheid S. Escalation of intake under intermittent ethanol access in diverse mouse genotypes. Addict. Biol. 2012;22:1369–1600. doi: 10.1111/j.1369-1600.2012.00481.x. [DOI] [PMC free article] [PubMed] [Google Scholar]
- Rosenwasser AM, Logan RW, Fecteau ME. Chronic ethanol intake alters circadian period-responses to brief light pulses in rats. Chronobiol. Int. 2005b;22:227–236. doi: 10.1081/cbi-200053496. [DOI] [PubMed] [Google Scholar]
- Ruby CL, Brager AJ, DePaul MA, Prosser RA, Glass JD. Chronic ethanol attenuates circadian photic phase resetting and alters nocturnal activity patterns in the hamster. Am. J. Physiol. Regul. Integr. Comp. Physiol. 2009a;297:R729–R737. doi: 10.1152/ajpregu.00268.2009. [DOI] [PMC free article] [PubMed] [Google Scholar]
- Ruby CL, Prosser RA, DePaul MA, Roberts RJ, Glass JD. Acute ethanol impairs photic and nonphotic circadian phase resetting in the Syrian hamster. Am. J. Physiol. Regul. Integr. Comp. Physiol. 2009b;296:R411–R418. doi: 10.1152/ajpregu.90782.2008. [DOI] [PMC free article] [PubMed] [Google Scholar]
- Sanna PP, Folsom DP, Barizo MJ, Hirsch MD, Melia KR, Maciejewski-Lenoir D, Bloom FE. Chronic ethanol intake decreases vasopressin mRNA content in the rat hypothalamus: a PCR study. Brain Res. Mol. Brain Res. 1993;19:241–245. doi: 10.1016/0169-328x(93)90035-n. [DOI] [PubMed] [Google Scholar]
- Seggio JA, Fixaris MC, Reed JD, Logan RW, Rosenwasser AM. Chronic ethanol intake alters circadian phase shifting and free-running period in mice. J. Biol. Rhythms. 2009;24:304–312. doi: 10.1177/0748730409338449. [DOI] [PMC free article] [PubMed] [Google Scholar]
- Seggio JA, Logan RW, Rosenwasser AM. Chronic ethanol intake modulates photic and non-photic circadian phase responses in the Syrian hamster. Pharmacol. Biochem. Behav. 2007;87:297–305. doi: 10.1016/j.pbb.2007.05.001. [DOI] [PMC free article] [PubMed] [Google Scholar]
- Shimomura K, Low-Zeddies SS, King DP, Steeves TD, Whiteley A, Kushla J, Zemenides PD, Lin A, Vitaterna MH, Churchill GA, Takahashi JS. Genome-wide epistatic interaction analysis reveals complex genetic determinants of circadian behavior in mice. Genome Res. 2001;11:959–980. doi: 10.1101/gr.171601. [DOI] [PubMed] [Google Scholar]
- Spanagel R, Pendyala G, Abarca C, Zghoul T, Sanchis-Segura C, Magnone MC, Lascorz J, Depner M, Holzberg D, Soyka M, et al. The clock gene Per2 influences the glutamatergic system and modulates alcohol consumption. Nat. Med. 2005;11:35–42. doi: 10.1038/nm1163. [DOI] [PubMed] [Google Scholar]
- Sprow GM, Thiele TE. The neurobiology of binge-like ethanol drinking: evidence from rodent models. Physiol. Behav. 2012;100:325–331. doi: 10.1016/j.physbeh.2011.12.026. [DOI] [PMC free article] [PubMed] [Google Scholar]
- Trujillo JL, Do DT, Grahame NJ, Roberts AJ, Gorman MR. Ethanol consumption in mice: relationships with circadian period and entrainment. Alcohol. 2011;45:147–159. doi: 10.1016/j.alcohol.2010.08.016. [DOI] [PMC free article] [PubMed] [Google Scholar]


