Abstract
We performed a genome wide association analysis of maternally-mediated genetic effects and parent-of-origin effects on risk of orofacial clefting using over 2,000 case-parent triads collected through an international cleft consortium. We used log-linear regression models to test individual SNPs. For SNPs with a p-value <10−5 for maternal genotypic effects, we also applied a haplotype-based method, TRIMM, to extract potential information from clusters of correlated SNPs. None of the SNPs were significant at the genome wide level. Our results suggest neither maternal genome nor parent of origin effects play major roles in the etiology of orofacial clefting in our sample. This finding is consistent with previous genetic studies and recent population-based cohort studies in Norway and Denmark, which showed no apparent difference between mother-to-offspring and father-to-offspring recurrence of clefting. We, however, cannot completely rule out maternal genome or parent of origin effects as risk factors because very small effects might not be detectable with our sample size, they may influence risk through interactions with environmental exposures or may act through a more complex network of interacting genes. Thus the most promising SNPs identified by this study may still be worth further investigation.
Keywords: GWAS, CL/P, CP, maternal genes, parent-of-origin, family-based study, association study
Introduction
Orofacial clefting (OC) is a common birth defect occurring 1 to 2 per 1000 live births. This malformation can be subdivided into cleft lip with or without cleft palate (CL/P) and cleft palate only (CP). Orofacial clefting has complex and heterogeneous etiologies involving genes, environmental factors, and their potential interactions. Despite extensive research into investigating the genetic and environmental risk factors for OC, only a few risk factors have been conclusively documented [Dixon et al., 2011]. While most studies focus on the role of alleles in genes carried by affecteds, other biological mechanisms have been proposed. One such mechanism involves maternally-mediated genetic effects. The mother not only contributes half of her genome to the offspring, she also provides the environment for the fetus. Variation in the mother’s genome could affect the intrauterine environment essential to the development of the fetus. Parent-of-origin (POO) effects, where the effect of inherited DNA depends on whether it is transmitted from the mother or the father, may be another mechanism in the etiology of birth defects such as OC. While these unconventional mechanisms may be hard to study with a case-control design, they can be tested using the case-parents design, where affected cases and their parents are genotyped.
We conducted a genome wide association study (GWAS) of OC using over 2,000 case-parents triads collected in an international consortium. We applied log-linear models to investigate if maternal genes or POO effects influence risk of OC in the offspring. A haplotype-based method, TRIMM [Shi et al., 2007], was also applied to SNPs showing the most significant evidence of maternal effects in single point analyses. We analyzed four phenotypic subgroups: CL/P, cleft lip (CL), cleft lip and palate (CLP) and cleft palate alone (CP). The CLP and CL groups were analyzed separately because these two forms of clefting can have different etiologies. This is supported by population data [Grosen et al., 2009; Marazita et al., 2009; Sivertsen et al., 2008] as well as molecular data [Rahimov et al., 2008] recently summarized by Jugessur et al.[2011].
Samples and Methods
Samples
Families with an offspring with isolated OC (either CL/P or CP) were recruited by independent research groups comprising an international cleft consortium. The majority of the OC cases were of European or Asian origin. Cases were examined by a clinician and/or medical records were reviewed to identify and exclude individuals with other congenital anomalies or developmental delays. Family history of cleft and other malformations, pregnancy history, parental medical history, and maternal prenatal exposures were collected through personal interviews. DNA samples were collected from cases and their parents from a variety of biological specimens including whole blood (80.87%), buccal brush/swab (11.17%), saliva (2.66%), mouthwash (1.83%) and dried blood spots (1.07%). The samples included 543 CL triads, 1,365 CLP triads and 550 CP triads. Each participating institution reviewed and approved research protocols for research on human subjects, and US institutions reviewed and approved protocols of their foreign collaborators. Table I lists the number of triads by recruitment site. Trios of European and Asian ancestry contributed the two largest groups of samples with 1,094 and 1,277 trios, respectively. Table II summarizes the gender of the cases and family history by phenotype. As expected, more females (56.2%) were affected with CP while more males (64.7%) were affected with CL/P. Approximately 13.9% of individuals with CP had positive family history and 22.5% of individuals with CL/P had positive history. Additional details of these samples were described in Beaty et al. [2010].
Table I.
Number of cleft triads by recruitment site.
| Site | Number of Triads (%)
|
|||
|---|---|---|---|---|
| CL | CLP | CL/P | CP | |
| Denmark | 21 (3.9) | 27 (5) | 48 (8.8) | 13 (2.4) |
| Norway | 110 (20.3) | 182 (33.5) | 292 (53.8) | 110 (20) |
| Iowa | 25 (4.6) | 40 (7.4) | 65 (12) | 41 (7.5) |
| Maryland | 31 (5.7) | 113 (20.8) | 144 (26.5) | 43 (7.8) |
| Pittsburgh | 28 (5.2) | 98 (18) | 126 (23.2) | 15 (2.7) |
| Utah | 84 (15.5) | 116 (21.4) | 200 (36.8) | 64 (11.6) |
| Singapore | 16 (2.9) | 52 (9.6) | 68 (12.5) | 57 (10.4) |
| Taiwan | 46 (8.5) | 187 (34.4) | 233 (42.9) | 79 (14.4) |
| Chinese | 163 (30) | 410 (75.5) | 573 (105.5) | 123 (22.4) |
| Korea | 19 (3.5) | 42 (7.7) | 61 (11.2) | 5 (0.9) |
| Philippines | 0 (0) | 98 (18) | 98 (18) | 0 (0) |
Table II.
Summary of samples by family history, gender, and phenotype.
| Family history | Gender | Phenotype | ||
|---|---|---|---|---|
| CP | CL | CLP | ||
| No | Male | 174 | 202 | 641 |
| Female | 236 | 157 | 288 | |
| Yes | Male | 29 | 48 | 190 |
| Female | 37 | 33 | 103 | |
| Unknown | Male | 38 | 69 | 85 |
| Female | 36 | 38 | 54 | |
Quality Control of Genotypes
The Center for Inherited Disease Research (CIDR) genotyped samples using the Illumina Human610-Quad v.1_B BeadChip (Illumina). We used the following quality-control criteria beyond those set by CIDR. We excluded SNPs if they i) had >5% missing genotypes over all trios, ii) showed a MAF < 0.01 in either European or Asian individuals, iii) had >5% Mendelian errors over all trios or iv) deviated from HWE at P < 10−5. Genotypes were released for 589,945 SNPs (99.56% of those attempted). Genotype success rates depended on the DNA source: 99.5% for samples from whole blood, 96.4% for samples from buccal brushes or swabs and 100% for samples from saliva or dried blood spots. Refer to Beaty et al. [2010] for details.
Statistical Analyses
We used the log-linear modeling approach [Wilcox et al., 1998] to study maternally-mediated genetic effects based on assuming symmetry of allele counts between mothers and fathers in the source population, as defined by Schaid and Sommer [1993]. Under the null hypothesis of no maternal genotypic effects, we expect the observed genotype distribution to be the same for mothers and fathers. Deviation from symmetry raises the potential for maternal genotypic effects. We used a log-additive relative risk model in testing maternal genotypic effects. To study POO effects, we used the extension of the log-linear models proposed by Weinberg et al. [1998]. The POO effects can be confounded by maternal genotypic effects. To ensure a robust POO test, we included in this model two offspring and two maternal genotypic risk parameters to saturate genetic main effects. A significant test of POO effects implies differential transmission of alleles to an affected offspring from mothers compared to alleles transmitted from fathers. The expectation maximization algorithm was applied to incorporate families with missing parental genotypes. We used the LEM software [van Den Oord and Vermunt, 2000] to fit these log-linear models. Point estimates for relative risks (as well as the 95% confidence intervals) were calculated for all autosomal SNPs yielding p<10−5. We used the Bonferroni approach to correct for multiple testing. We performed analyses in four sub-phenotype groups (CL, CLP, CL/P and CP) using all triads. For maternal effects we also performed analysis within the two major ethnic groups: Asian and Caucasian in two sub-phenotype groups (CL/P and CP).
To visually inspect the test results across the whole genome we generated “Manhattan” plots by graphing the −log10(p-values) of each autosomal SNP on the y-axis against their physical position along the x-axis. The quantile-quantile (Q-Q) plots were also used to show whether our results were more significant than would have been expected by chance alone.
We also performed haplotype-based tests of maternal genotypic effects using the TRIMM method [Shi et al., 2007]. To reduce computational burden and multiple-testing issues, we only carried out haplotype-based tests for SNPs with p<10−5 (15 SNPs). TRIMM is a nonparametric method for testing multiple SNPs simultaneously. It constructs a difference vector by taking genotype differences between the mother and the father. Under the null hypothesis of no maternal genotypic effects, this difference vector has an expected value of zero. TRIMM combines the SNP-wise test (Max Z2) with the multivariate test (Hotelling’s T2) and evaluates these test statistics via permutation testing. To account for correlation between SNPs, alleles at all SNPs are permuted simultaneously. TRIMM is robust to bias from population stratification or deviation from Hardy-Weinberg equilibrium, and it can accommodate multiple SNPs, missing genotypes, and non-negligible recombination rates. We included SNPs located 20 kb up- and downstream of the most significant SNPs for maternal effects (p<10−5) in the haplotype analysis.
Results
Maternal genotypic effects
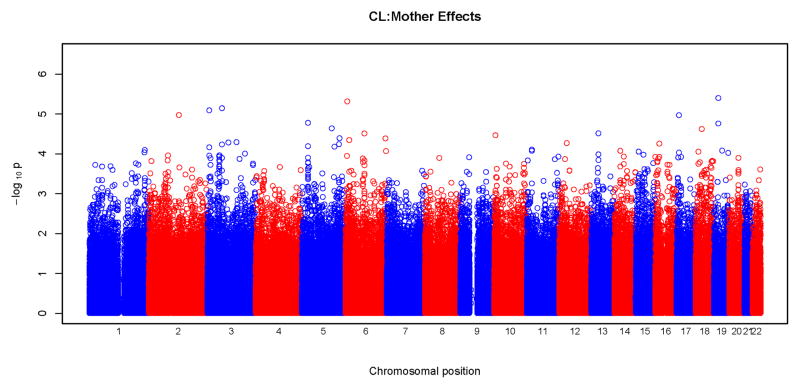
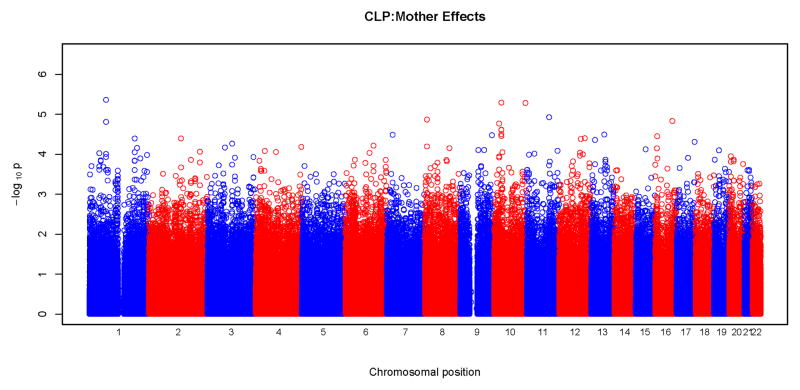
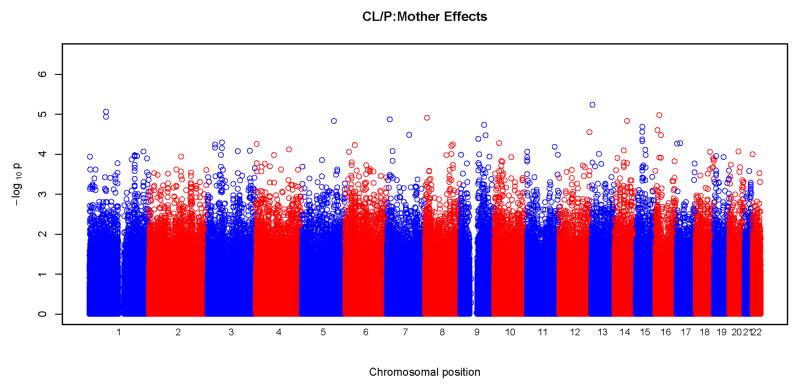
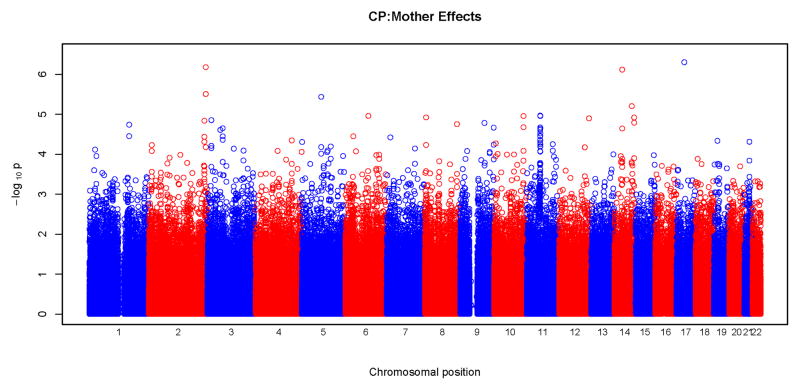
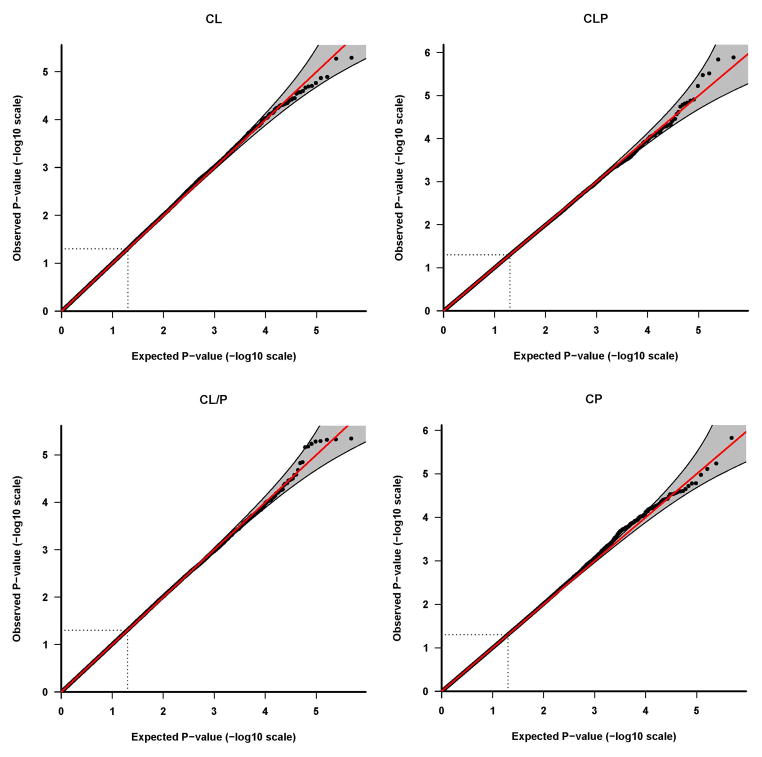
Results of tests for maternal genotypic effects for the four phenotypic groups (CL, CLP, CL/P and CP) are summarized in the “Manhattan” plots (Figures 1) and QQ plots (Figure 2). No SNPs remained significant after Bonferroni correction for any of the phenotypic groups (Figure 1). For CL, CLP, and CL/P, p-values fell around the diagonal lines in these QQ plots, supporting the null hypotheses of no maternal genotypic effects (Figure 2).
Figure 1.
Physical locations of the GWAS p-values for maternal genotypic effects on risk. Observed p-values on the logarithmic scale are sorted by physical location on the 22 autosomes. Results of analysis of the four phenotypes are plotted separately: a) CL, b) CLP, c) CL/P and d) CP.
Figure 2.
Quantile-quantile (Q-Q) plots of maternal genotypic effect tests. The Q-Q plots are based on the p-values (in log 10 scale) of tests for maternal genotypic effects. Results of the four phenotypes are plotted separately: a) CL, b) CLP, c) CL/P and d) CP. The shaded region is the 95% concentration band, calculated using the 2.5 and 97.5 percentile of the distribution of the respective order statistics for the p-values, assuming independent test statistics. The dotted lines indicate the expected ranked p-value of 0.05.
We observed some potentially interesting peaks at chromosomes 2, 11, and 14 in the “Manhattan” plot for the CP group (Figure 1) and the corresponding QQ plot shows deviation from the null at the significant end of the scale (Figure 2). As summarized in Table III, a total of 15 SNPs gave a p<10−5 for maternal effects, four for CL, three for CLP, two for CL/P and six for CP. Estimated relative risks ranged from 0.52 to 2.38 for each minor allele. None of these SNPs were located in recognized candidate genes. SNP rs17138064 located in an intergenic region on chromosome 17 produced the most significant p-value (p=5×10⁻⁷) in the CP group, followed by SNPs rs10174126 on chromosome 2 and rs745080 on chromosome 14 both also in the CP group and giving p<10−6. Supplemental Table I lists all SNPs with a p<10−4.
Table III.
Summary of SNPs with p<10−5 in tests of maternal genetic effect tests.
| Marker | Chr | Coordinate | MAF* | Gene symbol | p value | Estimate** |
|---|---|---|---|---|---|---|
| CL | ||||||
| rs1450100 | 3 | 7513202 | 0.35 | GRM7 | 8.16E-06 | 0.65 (0.79,0.54) |
| rs212016 | 3 | 59956565 | 0.31 | FHIT | 7.22E-06 | 0.65 (0.79,0.53) |
| rs2068361 | 6 | 7681742 | 0.23 | BMP6 | 4.87E-06 | 1.64 (2.04,1.32) |
| rs3764628 | 19 | 18608605 | 0.12 | intergenic | 4.01E-06 | 1.89 (2.50,1.43) |
|
| ||||||
| CLP | ||||||
| rs1417437 | 1 | 69927029 | 0.36 | LRRC7 | 4.39E-06 | 0.77 (0.86,0.68) |
| rs3006564 | 10 | 30217894 | 0.48 | intergenic | 5.15E-06 | 1.32 (1.47,1.16) |
| rs1329189 | 10 | 1.3E+08 | 0.38 | intergenic | 5.26E-06 | 0.77 (0.86,0.68) |
|
| ||||||
| CL/P | ||||||
| rs1417437 | 1 | 69927029 | 0.35 | LRRC7 | 8.65E-06 | 0.80 (0.88,0.73) |
| rs17079928 | 13 | 23552228 | 0.18 | SPATA13 | 5.81E-06 | 0.75 (0.85,0.66) |
|
| ||||||
| CP | ||||||
| rs4505466 | 2 | 2.36E+08 | 0.48 | SH3BP4 | 3.13E-06 | 0.65 (0.78,0.54) |
| rs10174126 | 2 | 2.36E+08 | 0.43 | SH3BP4 | 6.69E-07 | 1.59 (1.92,1.32) |
| rs4703822 | 5 | 80446977 | 0.28 | RASGRF2 | 3.69E-06 | 0.63 (0.77,0.52) |
| rs745080 | 14 | 52058978 | 0.45 | TXNDC16 | 7.72E-07 | 0.63 (0.76,0.52) |
| rs17807815 | 14 | 91625808 | 0.07 | ATXN3 | 6.31E-06 | 2.38 (3.57,1.59) |
| rs17138064 | 17 | 32263204 | 0.16 | intergenic | 5.03E-07 | 0.52 (0.68,0.40) |
MAF: minor allele frequency in all samples
Estimate is the relative risk of a heterozygous as compared to a common homozygous genotype
We next used a haplotype-based method to investigate if we can capture these associations by taking into account neighboring SNPs. For each of these 15 SNPs, we included SNPs 20 kb up- and downstream in a haplotype analysis using TRIMM. The number of actual SNPs included varied from three to 36 SNPs (Table IV). TRIMM generated p-values all less significant than those seen in analysis of single SNPs, indicating these possible association signals were not well captured by these haplotypes. The most significant TRIMM test (p=2.3×10⁻⁵) was produced by 14 SNPs flanking rs2068361 located in the BMP6 gene on chromosome 6 in the CL group.
Table IV.
TRIMM analysis of maternal genetic effects for SNPs yielding p<10−5 in tests of individual SNPs.
| Marker | p value | No. of SNPs included in TRIMM | ||||
|---|---|---|---|---|---|---|
| CL | ||||||
| rs1450100 | 9.30E-05 | 17 | ||||
| rs212016 | 5.74E-02 | 36 | ||||
| rs2068361 | 2.30E-05 | 14 | ||||
| rs3764628 | 5.10E-05 | 5 | ||||
|
| ||||||
| CLP | ||||||
| rs1417437 | 4.00E-04 | 6 | ||||
| rs3006564 | 3.00E-04 | 11 | ||||
| rs1329189 | 7.00E-04 | 4 | ||||
|
| ||||||
| CL/P | ||||||
| rs1417437 | 1.10E-03 | 6 | ||||
| rs17079928 | 3.00E-04 | 32 | ||||
|
| ||||||
| CP | ||||||
| rs4505466 | 9.00E-04 | 22 | ||||
| rs10174126 | 5.00E-04 | 22 | ||||
| rs4703822 | 8.00E-04 | 14 | ||||
| rs745080 | 2.69E-04 | 3 | ||||
| rs17807815 | 5.90E-05 | 6 | ||||
| rs17138064 | 1.52E-04 | 11 | ||||
Since different genes (or alleles of certain genes) may be involved in different ethnic groups, we also tested for maternal effects in Asian and Caucasian triads separately. These analyses were based on smaller sample sizes and again did not produce genome-wide significant findings. Supplemental Table II lists the results of population-specific analysis for markers with a p< 10−5 for maternal effects in the combined samples. Supplemental Tables III and IV list the results of markers with a p< 10−5 in either population-specific or combined sample analysis. As observed for the affected case genetic effects [Beaty et al., 2010], distinct genes seemed to be important for maternal genetic effects in the Caucasian and Asian populations.
POO effects
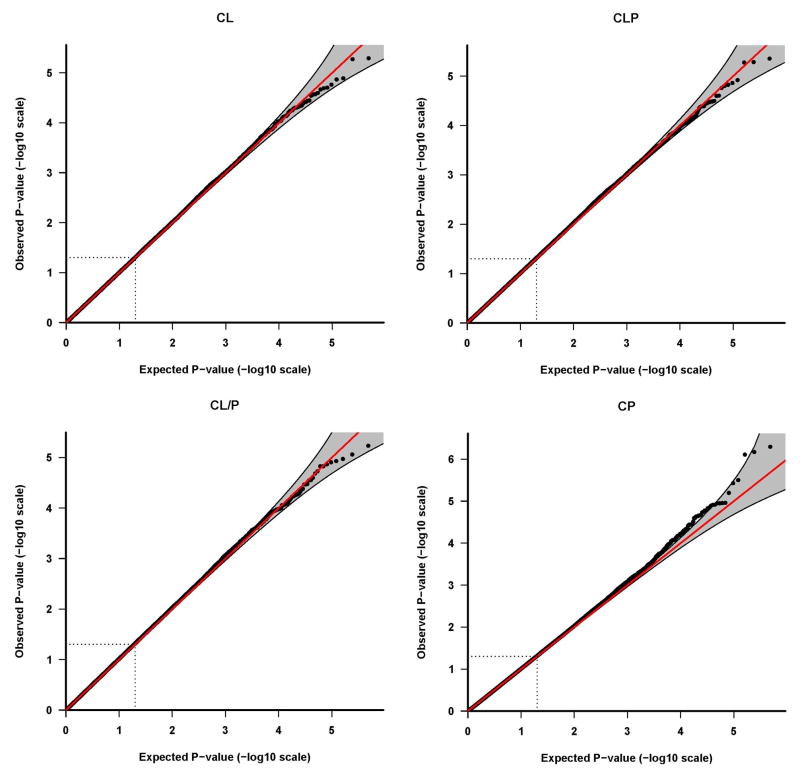
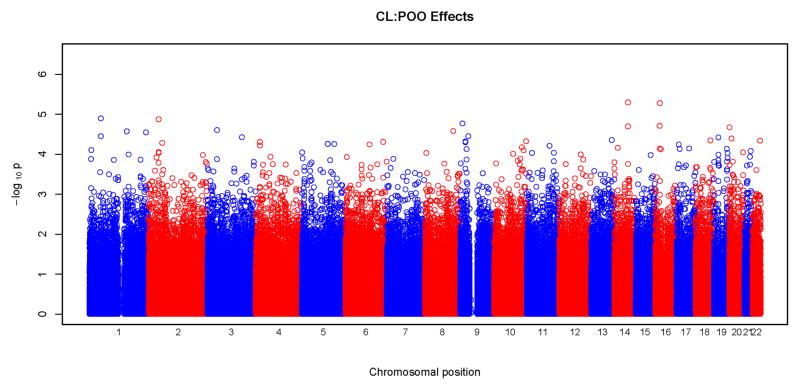
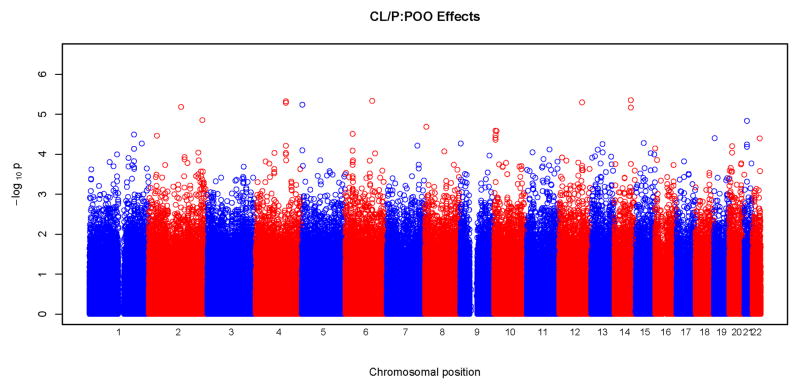
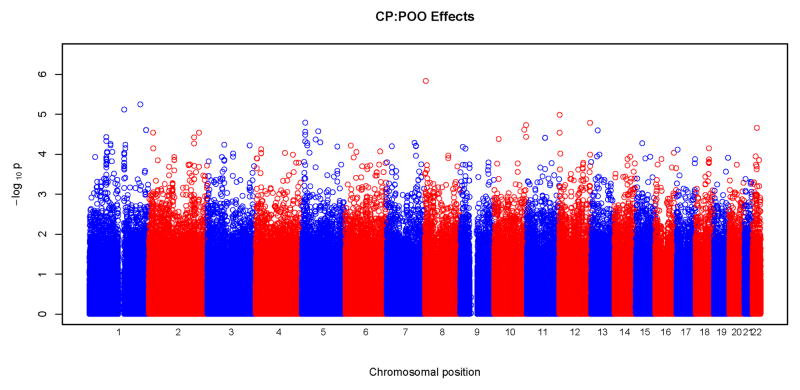
Figures 3 and 4 show results of POO tests. Similar to what was seen with tests for maternal effects, we did not observe any significant SNPs surviving correction for multiple testing at the genome wide level. From these Manhattan plots, the most significant SNPs were scattered randomly throughout the genome (Figure 3). The Q-Q plots were also consistent with the null hypothesis, with all the points falling on or close to the diagonal line. Plots for CLP and CL/P showed some deviation from the null hypothesis at the upper end of the scale. A total of 18 SNPs gave a p<10−5 for POO effects: two for CL, five for CLP, eight for CL/P and three for CP. Again, none of these SNPs were in recognized candidate genes. The characteristics of the SNPs, their p-values and the relative risk estimates are listed in Table V. The most significant test occurred in the CLP group for rs2383658 (p=1.3×10⁻⁶). Estimated relative risks (and their 95% confidence interval) of inheriting a maternal copy of the allele compared to the risk of inheriting a paternal copy are given in the last column of Table V. SNP rs1834570 had the largest relative risk estimate (RR=20). However, this estimate was not reliable considering the relative low minor allele frequency (MAF=0.04) at this SNP. The relative risks associated with minor alleles ranged from 0.26 to 4.76, after excluding rs1834570. SNPs with a p<10−4 for POO effects are listed in Supplemental Table V.
Figure 3.
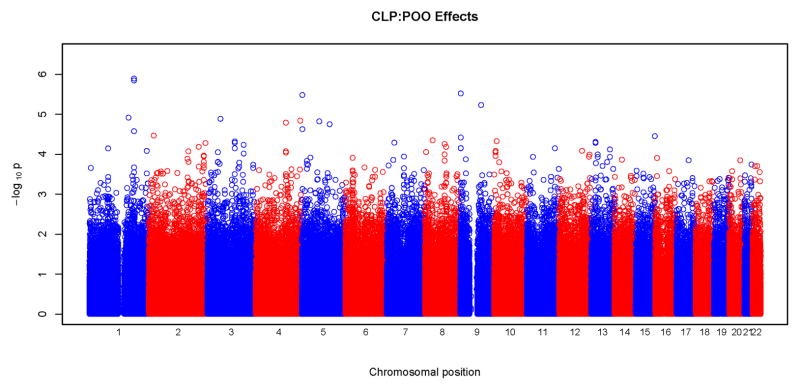
Physical locations of GWAS p-values for parent-of-origin (differential transmission from fathers and mothers) effects. Observed p-values on the logarithmic scale are sorted by physical location on the 22 autosomes. Results of the four phenotypes are plotted separately: a) CL, b) CLP, c) CL/P and d) CP.
Figure 4.
Quantile-quantile (Q-Q) plots of parent-of-origin effect tests. The Q-Q plots are based on the p-values (in log 10 scale) of tests for POO effects. Results of the four phenotypes are plotted separately: a) CL, b) CLP, c) CL/P and d) CP. The shaded region is the 95% concentration band, calculated using the 2.5 and 97.5 percentile of the distribution of the respective order statistics for the p-values, assuming independent test statistics. The dotted lines indicate the expected ranked p-value of 0.05.
Table V.
Summary of SNPs with p<10−5 in tests of parent-of-origin effect tests.
| Marker | Chr | Coordinate | MAF* | Gene symbol | p value | Estimate |
|---|---|---|---|---|---|---|
| CL | ||||||
| rs2591089 | 14 | 75657553 | 0.15 | BCYRN1 | 5.076E-06 | 0.26 (0.47,0.14) |
| rs8054408 | 16 | 19154025 | 0.19 | SYT17 | 5.298E-06 | 4.76 (9.09,2.38) |
| CLP | ||||||
| rs1339083 | 1 | 1.86E+08 | 0.28 | intergenic | 1.437E-06 | 0.45 (0.62,0.32) |
| rs2383658 | 1 | 1.86E+08 | 0.30 | intergenic | 1.289E-06 | 0.45 (0.62,0.33) |
| rs92833 | 5 | 2391908 | 0.26 | intergenic | 3.31E-06 | 0.46 (0.64,0.33) |
| rs10811366 | 9 | 2055892 | 0.05 | SMARCA2 | 3.033E-06 | 0.26 (0.47,0.15) |
| rs1662695 | 9 | 86595032 | 0.12 | NTRK2 | 5.913E-06 | 2.44 (3.57,1.67) |
| CL/P | ||||||
| rs1437903 | 2 | 1.33E+08 | 0.30 | NAP5 | 6.601E-06 | 1.89 (2.50,1.43) |
| rs6834028 | 4 | 1.25E+08 | 0.48 | intergenic | 5.187E-06 | 1.85 (2.38,1.41) |
| rs960925 | 4 | 1.25E+08 | 0.48 | intergenic | 4.766E-06 | 1.85 (2.38,1.41) |
| rs92833 | 5 | 2391908 | 0.26 | intergenic | 5.801E-06 | 0.53 (0.70,0.40) |
| rs11153238 | 6 | 1.11E+08 | 0.23 | intergenic | 4.658E-06 | 0.51 (0.68,0.38) |
| rs2196457 | 12 | 94798821 | 0.22 | CCDC38 | 5.07E-06 | 0.49 (0.67,0.36) |
| rs10150163 | 14 | 87789351 | 0.31 | KCNK10 | 4.482E-06 | 1.92 (2.56,1.47) |
| rs2401756 | 14 | 87790661 | 0.31 | KCNK10 | 6.836E-06 | 1.92 (2.50,1.45) |
| CP | ||||||
| rs7516430 | 1 | 1.45E+08 | 0.21 | CHD1L | 7.66E-06 | 3.45 (5.88,1.96) |
| rs12144639 | 1 | 2.12E+08 | 0.21 | intergenic | 5.699E-06 | 0.29 (0.51,0.17) |
| rs1834570 | 8 | 3775138 | 0.04 | CSMD1 | 1.477E-06 | 20 (100,5) |
MAF: minor allele frequency in all samples
Discussion
Despite substantial efforts in researching the etiology of this common birth defect, only a handful of genes have been reliably associated with risk of OC [Dixon et al., 2011]. Maternally-mediated genetic effects or POO effects have been proposed as alternative mechanisms, and a number of studies have focused on these. A study of the CBS gene using 134 Italian triads suggested POO effect of an insertion polymorphism [Rubini et al., 2005]. Reutter et al. [2008] tested for POO effects using three SNPs in TGFB3 in 204 triads of central European origin, and one SNP showed a statistical significance. Sull et al. [2009b] studied maternal and POO effects using 17 SNPs in theTGFA gene on CL/P in 297 case-parent triads from four populations, and reported two SNPs showing significant POO effects. These same triads were also used to study POO effects with 34 SNPs in four paired box transcript factor (PAX) genes (PAX3, PAX6, PAX7 and PAX9) [Sull et al., 2009a] and 24 SNPs in the RUNX2 gene [Sull et al., 2008a]. Tests of POO were significant for two SNPs in PAX7, four SNPs in PAX3 and three SNPs in RUNX2. Sull et al. [2008b] also studied four SNPs in TCOF1 using 81 CP triads, but failed to identify any significant POO effects. A recent study of 29 genes in the folate one-carbon metabolism pathway using samples from 425 Norwegian triad families with a child with OC failed to show evidence of association and linkage between variants in these genes in the mother’s genotype and risk of OC [Boyles et al., 2009]. Jugessur et al. [2010] performed a candidate gene study for maternal genotype effects using 797 triads from two European populations. The authors reported three genes, FLNB), HIC1, and ZNF189, out of the 1,536 candidate genes showed suggestive evidence for association, but none remained significant after correcting for multiple-testing. Furthermore, these positive findings are yet to be confirmed. In this study, none of the SNPs (360 SNPs) in these prior proposed genes had p values more significant than 10−3.
Our study, using over 2,000 triads collected through an international consortium, is the largest and most comprehensive clefting study performed to date. Nevertheless, we found little evidence for maternal genotypic or POO effects on the risk of OC. The lack of significant findings may be because maternal genotypic or POO effects are too weak to be detected even with the sample size in this analysis, or it could be such effects only manifest when specific environmental exposures are present or when a particular variant is carried by developing fetus. For instance, a defect in the maternal detoxification mechanisms may adversely affect the intrauterine environment only when the mother is exposed to specific environmental exposures; or an incompatibility between the maternal and fetal genomes may disrupt normal fetal development. For complex and heterogeneous diseases (as OC), genes may interact with exposures where each gene contributes only an incremental amount to overall risk. Analyses of individual SNPs or haplotypes, as performed in this study, may fail to identify such biological mechanisms and more comprehensive approaches, such as gene-gene interaction or pathway-based analysis, may be needed. The POO effects are higher order effects compared to the main effects of genes carried by the developing fetus, and we may need even larger sample sizes to capture such effects. We used samples from different populations, which also creates limitations. Different ethnic groups may have different prevalent susceptibility variants. In addition, due to the variation in linkage disequilibrium structure across ethnic groups the same marker in LD with the susceptibility mutation may appear to have a different effect in a different population. At the extreme, the same marker may appear to be causative in one population while protective in another, the so called “flip-flop” scenario [Lin et al., 2007; Zaykin and Shibata, 2008]. When this happens combining samples from different populations for analysis may not improve power. One way to handle such inconsistency issues is to perform analyses within each sub-population and only pool data for analysis when the SNP shows similar effects in the population-specific analysis. Procedures like this, however, also require additional adjustment for multiple testing. Power may be another issue for population-specific analysis. When the sample size from individual populations is relatively small, results may not be reliable. In the future, additional samples available through collaborations for each sub-population may enable a more powerful test. Nevertheless, despite the largely negative results, the most promising SNPs identified in this study may still be etiologically important and worth further investigation.
SNPs identified as potentially interesting (p<10−5) were located in 18 different genes and 12 intergenic regions. None of the genes closest to the risk SNPs identified here have been previously associated with risk of OC. As currently understood, the functions of most of these genes do not argue for a causal role in the etiology of OC. One exception may be the chromosomal region 6p23, where BMP6 resides, which showed evidence of harboring a gene influencing risk to CL/P in a previous genome wide linkage study [Marazita et al., 2004]. The BMPs are a family of secreted signaling molecules that can induce ectopic bone growth, and the BMP pathway has been shown to be involved in palatogenesis [Liu et al., 2005a; Liu et al., 2005b; Zhang et al., 2002]. Recently, Suzuki et al. [2009] implicated BMP4 in the etiology of both sub-epithelial, microform, and overt CL. Bmp6-deficient mice were, however, viable and fertile without craniofacial anomalies, although they did show massive accumulation of iron in the liver [Meynard et al., 2009]. Other associations may be surrogates for genes or regulatory regions at some distance from the associated SNP and be difficult to detect. Finally, the associated SNP in the 2q35 region does have precedent in that deletions of terminal 2q have a high frequency of clefts in individuals [Casas et al., 2004]. If it could be shown that mothers of cleft cases also have higher carrier frequencies of the 2q deletion, it would support a maternal genetic role for this region.
The Manhattan plot of maternal effects in CP (Figure 1) showed an interesting peak on chromosome 11. Analysies of SNPs yielding p<10−4 in this region showed these SNPs are located in the human olfactory receptor gene families 5 and 8 regions, spanning approximately 400 kb. The olfactory receptor gene family is one of the largest multigene families in the genome. Olfactory receptors interacting with odorant molecules can trigger a neural signal to interpret smell. No other functions of this gene family have been reported, and this association may represent a coincidental finding or association of some untyped causative SNPs in LD with an unrecognized causal gene.
Our study failed to find major contributions of maternal genetic effects or POO effects to OC and this is consistent with earlier studies [Bingle and Niswander, 1977; Ching and Chung, 1974]. Recent population-based cohort studies also supported our finding that maternal genotypes contributed minimally, if at all, to risk of OC in the offspring. In a population-based cohort study carried out in Norway, Sivertsen et al. [2008] reported similar mother-offspring and father-offspring recurrences for OC. If the maternal genome played a major role in congenital malformations during pregnancy, one would expect the mother-offspring recurrence rate be higher compared to father-offspring. This has also been confirmed by a population-based cohort study in Denmark [Grosen et al., 2009].
Association between genetic variations in offspring genomes at several genes/regions, e.g., IRF6 [Beaty et al., 2010; Zucchero et al., 2004] and 8p24 [Beaty et al., 2010; Birnbaum et al., 2009; Grant et al., 2009] has been well established. Nevertheless, we did not observe promising p-value peaks in these regions, indicating these genes may not act through maternal or parent-of-origin mechanisms.
In conclusion, this GWAS to search for maternal genotypic effects and possible POO effects on risk to OC suggests neither maternal genome nor POO effects play major roles in the causes of isolated OC in our sample. This is also consistent with previous genetic studies and the recent population-based cohort studies in Norway and Denmark. The maternal genome or POO effects, however, may still influence the risk to OC through interactions with environmental exposures or through a more complex network of interacting genes. We are currently performing further analyses to study possible gene-environment or gene-gene effects.
Supplementary Material
Acknowledgments
We sincerely thank all of the families at each recruitment site for participating in this study, and we gratefully acknowledge the invaluable assistance of clinical, field and laboratory staff who contributed to making this work possible. The International Cleft Consortium including genotyping and analysis was supported by the National Institute for Dental and Craniofacial Research through U01-DE-004425; “International Consortium to Identify Genes & Interactions Controlling Oral Clefts”, 2007–2009; TH Beaty, PI. This research was supported by R21–DE–013707, R37- DE-08559, R01–DE–014581 from the National Institute of Dental & Craniofacial Research. TW is supported by the International Collaborative Genetics Research Training Program (ICGRTP), NIH D43 TW06176. This research was also supported by the Intramural Research Program of the NIH, National Institute of Environmental Health Sciences. We thank the Smile Train Foundation for supporting cleft research in China and Operation Smile for research in the Philippines.
Footnotes
Conflict of interest:
The authors declare no conflict of interest.
References
- Beaty TH, Murray JC, Marazita ML, Munger RG, Ruczinski I, Hetmanski JB, Liang KY, Wu T, Murray T, Fallin MD, Redett RA, Raymond G, Schwender H, Jin SC, Cooper ME, Dunnwald M, Mansilla MA, Leslie E, Bullard S, Lidral AC, Moreno LM, Menezes R, Vieira AR, Petrin A, Wilcox AJ, Lie RT, Jabs EW, Wu-Chou YH, Chen PK, Wang H, Ye X, Huang S, Yeow V, Chong SS, Jee SH, Shi B, Christensen K, Melbye M, Doheny KF, Pugh EW, Ling H, Castilla EE, Czeizel AE, Ma L, Field LL, Brody L, Pangilinan F, Mills JL, Molloy AM, Kirke PN, Scott JM, Arcos-Burgos M, Scott AF. A genome-wide association study of cleft lip with and without cleft palate identifies risk variants near MAFB and ABCA4. Nat Genet. 2010;42:525–529. doi: 10.1038/ng.580. [DOI] [PMC free article] [PubMed] [Google Scholar]
- Bingle GJ, Niswander JD. Maternal effects in human cleft lip and palate. American Journal of Human Genetics. 1977;29:605–609. [PMC free article] [PubMed] [Google Scholar]
- Birnbaum S, Ludwig KU, Reutter H, Herms S, Steffens M, Rubini M, Baluardo C, Ferrian M, Almeida de Assis N, Alblas MA, Barth S, Freudenberg J, Lauster C, Schmidt G, Scheer M, Braumann B, Berge SJ, Reich RH, Schiefke F, Hemprich A, Potzsch S, Steegers-Theunissen RP, Potzsch B, Moebus S, Horsthemke B, Kramer FJ, Wienker TF, Mossey PA, Propping P, Cichon S, Hoffmann P, Knapp M, Nothen MM, Mangold E. Key susceptibility locus for nonsyndromic cleft lip with or without cleft palate on chromosome 8q24. Nat Genet. 2009;41:473–477. doi: 10.1038/ng.333. [DOI] [PubMed] [Google Scholar]
- Boyles AL, Wilcox AJ, Taylor JA, Shi M, Weinberg CR, Meyer K, Fredriksen A, Ueland PM, Johansen AM, Drevon CA, Jugessur A, Trung TN, Gjessing HK, Vollset SE, Murray JC, Christensen K, Lie RT. Oral facial clefts and gene polymorphisms in metabolism of folate/one-carbon and vitamin A: a pathway-wide association study. Genet Epidemiol. 2009;33:247–255. doi: 10.1002/gepi.20376. [DOI] [PMC free article] [PubMed] [Google Scholar]
- Casas KA, Mononen TK, Mikail CN, Hassed SJ, Li S, Mulvihill JJ, Lin HJ, Falk RE. Chromosome 2q terminal deletion: report of 6 new patients and review of phenotype-breakpoint correlations in 66 individuals. Am J Med Genet A. 2004;130A:331–339. doi: 10.1002/ajmg.a.30156. [DOI] [PubMed] [Google Scholar]
- Ching GH, Chung CS. A genetic study of cleft lip and palate in Hawaii. I. Interracial crosses. American Journal of Human Genetics. 1974;26:162–176. [PMC free article] [PubMed] [Google Scholar]
- Dixon MJ, Marazita ML, Beaty TH, Murray JC. Cleft lip and palate: understanding genetic and environmental influences. Nat Rev Genet. 2011;12:167–178. doi: 10.1038/nrg2933. [DOI] [PMC free article] [PubMed] [Google Scholar]
- Grant SF, Wang K, Zhang H, Glaberson W, Annaiah K, Kim CE, Bradfield JP, Glessner JT, Thomas KA, Garris M, Frackelton EC, Otieno FG, Chiavacci RM, Nah HD, Kirschner RE, Hakonarson H. A genome-wide association study identifies a locus for nonsyndromic cleft lip with or without cleft palate on 8q24. J Pediatr. 2009;155:909–913. doi: 10.1016/j.jpeds.2009.06.020. [DOI] [PubMed] [Google Scholar]
- Grosen D, Chevrier C, Skytthe A, Bille C, Molsted K, Sivertsen A, Murray JC, Christensen K. A cohort study of recurrence patterns among more than 54,000 relatives of oral cleft cases in Denmark: support for the multifactorial threshold model of inheritance. J Med Genet. 2009;47:162–168. doi: 10.1136/jmg.2009.069385. [DOI] [PMC free article] [PubMed] [Google Scholar]
- Jugessur A, Shi M, Gjessing HK, Lie RT, Wilcox AJ, Weinberg CR, Christensen K, Boyles AL, Daack-Hirsch S, Nguyen TT, Christiansen L, Lidral AC, Murray JC. Maternal genes and facial clefts in offspring: a comprehensive search for genetic associations in two population-based cleft studies from Scandinavia. PLoS One. 2010;5:e11493. doi: 10.1371/journal.pone.0011493. [DOI] [PMC free article] [PubMed] [Google Scholar]
- Jugessur A, Shi M, Gjessing HK, Lie RT, Wilcox AJ, Weinberg CR, Christensen K, Boyles AL, Daack-Hirsch S, Nguyen TT, Christiansen L, Lidral AC, Murray JC. Fetal genetic risk of isolated cleft lip only versus isolated cleft lip and palate: a subphenotype analysis using two population-based studies of orofacial clefts in scandinavia, Birth defects research Part A. Clinical and molecular teratology. 2011;91:85–92. doi: 10.1002/bdra.20747. [DOI] [PMC free article] [PubMed] [Google Scholar]
- Lin PI, Vance JM, Pericak-Vance MA, Martin ER. No gene is an island: the flip-flop phenomenon. Am J Hum Genet. 2007;80:531–538. doi: 10.1086/512133. [DOI] [PMC free article] [PubMed] [Google Scholar]
- Liu W, Selever J, Murali D, Sun X, Brugger SM, Ma L, Schwartz RJ, Maxson R, Furuta Y, Martin JF. Threshold-specific requirements for Bmp4 in mandibular development. Dev Biol. 2005a;283:282–293. doi: 10.1016/j.ydbio.2005.04.019. [DOI] [PubMed] [Google Scholar]
- Liu W, Sun X, Braut A, Mishina Y, Behringer RR, Mina M, Martin JF. Distinct functions for Bmp signaling in lip and palate fusion in mice. Development. 2005b;132:1453–1461. doi: 10.1242/dev.01676. [DOI] [PubMed] [Google Scholar]
- Marazita ML, Lidral AC, Murray JC, Field LL, Maher BS, Goldstein McHenry T, Cooper ME, Govil M, Daack-Hirsch S, Riley B, Jugessur A, Felix T, Morene L, Mansilla MA, Vieira AR, Doheny K, Pugh E, Valencia-Ramirez C, Arcos-Burgos M. Genome scan, fine-mapping, and candidate gene analysis of non-syndromic cleft lip with or without cleft palate reveals phenotype-specific differences in linkage and association results. Hum Hered. 2009;68:151–170. doi: 10.1159/000224636. [DOI] [PMC free article] [PubMed] [Google Scholar]
- Marazita ML, Murray JC, Lidral AC, Arcos-Burgos M, Cooper ME, Goldstein T, Maher BS, Daack-Hirsch S, Schultz R, Mansilla MA, Field LL, Liu YE, Prescott N, Malcolm S, Winter R, Ray A, Moreno L, Valencia C, Neiswanger K, Wyszynski DF, Bailey-Wilson JE, Albacha-Hejazi H, Beaty TH, McIntosh I, Hetmanski JB, Tuncbilek G, Edwards M, Harkin L, Scott R, Roddick LG. Meta-analysis of 13 genome scans reveals multiple cleft lip/palate genes with novel loci on 9q21 and 2q32–35. Am J Hum Genet. 2004;75:161–173. doi: 10.1086/422475. [DOI] [PMC free article] [PubMed] [Google Scholar]
- Meynard D, Kautz L, Darnaud V, Canonne-Hergaux F, Coppin H, Roth MP. Lack of the bone morphogenetic protein BMP6 induces massive iron overload. Nat Genet. 2009;41:478–481. doi: 10.1038/ng.320. [DOI] [PubMed] [Google Scholar]
- Rahimov F, Marazita ML, Visel A, Cooper ME, Hitchler MJ, Rubini M, Domann FE, Govil M, Christensen K, Bille C, Melbye M, Jugessur A, Lie RT, Wilcox AJ, Fitzpatrick DR, Green ED, Mossey PA, Little J, Steegers-Theunissen RP, Pennacchio LA, Schutte BC, Murray JC. Disruption of an AP-2alpha binding site in an IRF6 enhancer is associated with cleft lip. Nat Genet. 2008;40:1341–1347. doi: 10.1038/ng.242. [DOI] [PMC free article] [PubMed] [Google Scholar]
- Reutter H, Birnbaum S, Mende M, Lauster C, Schmidt G, Henschke H, Saffar M, Martini M, Lauster R, Schiefke F, Reich RH, Braumann B, Scheer M, Knapp M, Nothen MM, Kramer FJ, Mangold E. TGFB3 displays parent-of-origin effects among central Europeans with nonsyndromic cleft lip and palate. J Hum Genet. 2008;53:656–661. doi: 10.1007/s10038-008-0296-9. [DOI] [PubMed] [Google Scholar]
- Rubini M, Brusati R, Garattini G, Magnani C, Liviero F, Bianchi F, Tarantino E, Massei A, Pollastri S, Carturan S, Amadori A, Bertagnin E, Cavallaro A, Fabiano A, Franchella A, Calzolari E. Cystathionine beta-synthase c.844ins68 gene variant and non-syndromic cleft lip and palate. Am J Med Genet A. 2005;136A:368–372. doi: 10.1002/ajmg.a.30812. [DOI] [PubMed] [Google Scholar]
- Schaid DJ, Sommer SS. Genotype relative risks: methods for design and analysis of candidate-gene association studies. Am J Hum Genet. 1993;53:1114–1126. [PMC free article] [PubMed] [Google Scholar]
- Shi M, Umbach DM, Weinberg CR. Identification of Risk-Related Haplotypes with the Use of Multiple SNPs from Nuclear Families. Am J Hum Genet. 2007;81:53–66. doi: 10.1086/518670. [DOI] [PMC free article] [PubMed] [Google Scholar]
- Sivertsen A, Wilcox AJ, Skjaerven R, Vindenes HA, Abyholm F, Harville E, Lie RT. Familial risk of oral clefts by morphological type and severity: population based cohort study of first degree relatives. Bmj. 2008;336:432–434. doi: 10.1136/bmj.39458.563611.AE. [DOI] [PMC free article] [PubMed] [Google Scholar]
- Sull JW, Liang KY, Hetmanski JB, Fallin MD, Ingersoll RG, Park J, Wu-Chou YH, Chen PK, Chong SS, Cheah F, Yeow V, Park BY, Jee SH, Jabs EW, Redett R, Jung E, Ruczinski I, Scott AF, Beaty TH. Differential parental transmission of markers in RUNX2 among cleft case-parent trios from four populations. Genet Epidemiol. 2008a;32:505–512. doi: 10.1002/gepi.20323. [DOI] [PMC free article] [PubMed] [Google Scholar]
- Sull JW, Liang KY, Hetmanski JB, Fallin MD, Ingersoll RG, Park J, Wu-Chou YH, Chen PK, Chong SS, Cheah F, Yeow V, Park BY, Jee SH, Jabs EW, Redett R, Scott AF, Beaty TH. Maternal transmission effects of the PAX genes among cleft case-parent trios from four populations. Eur J Hum Genet. 2009a;17:831–839. doi: 10.1038/ejhg.2008.250. [DOI] [PMC free article] [PubMed] [Google Scholar]
- Sull JW, Liang KY, Hetmanski JB, Fallin MD, Ingersoll RG, Park JW, Wu-Chou YH, Chen PK, Chong SS, Cheah F, Yeow V, Park BY, Jee SH, Jabs EW, Redett R, Scott AF, Beaty TH. Excess maternal transmission of markers in TCOF1 among cleft palate case-parent trios from three populations. Am J Med Genet A. 2008b;146A:2327–2331. doi: 10.1002/ajmg.a.32302. [DOI] [PMC free article] [PubMed] [Google Scholar]
- Sull JW, Liang KY, Hetmanski JB, Wu T, Fallin MD, Ingersoll RG, Park JW, Wu-Chou YH, Chen PK, Chong SS, Cheah F, Yeow V, Park BY, Jee SH, Jabs EW, Redett R, Scott AF, Beaty TH. Evidence that TGFA influences risk to cleft lip with/without cleft palate through unconventional genetic mechanisms. Hum Genet. 2009b;126:385–394. doi: 10.1007/s00439-009-0680-3. [DOI] [PMC free article] [PubMed] [Google Scholar]
- Suzuki S, Marazita ML, Cooper ME, Miwa N, Hing A, Jugessur A, Natsume N, Shimozato K, Ohbayashi N, Suzuki Y, Niimi T, Minami K, Yamamoto M, Altannamar TJ, Erkhembaatar T, Furukawa H, Daack-Hirsch S, L’Heureux J, Brandon CA, Weinberg SM, Neiswanger K, Deleyiannis FW, de Salamanca JE, Vieira AR, Lidral AC, Martin JF, Murray JC. Mutations in BMP4 are associated with subepithelial, microform, and overt cleft lip. Am J Hum Genet. 2009;84:406–411. doi: 10.1016/j.ajhg.2009.02.002. [DOI] [PMC free article] [PubMed] [Google Scholar]
- van Den Oord EJ, Vermunt JK. Testing for linkage disequilibrium, maternal effects, and imprinting with (In)complete case-parent triads, by use of the computer program LEM. Am J Hum Genet. 2000;66:335–338. doi: 10.1086/302708. [DOI] [PMC free article] [PubMed] [Google Scholar]
- Weinberg CR, Wilcox AJ, Lie RT. A log-linear approach to case-parent-triad data: assessing effects of disease genes that act either directly or through maternal effects and that may be subject to parental imprinting. Am J Hum Genet. 1998;62:969–978. doi: 10.1086/301802. [DOI] [PMC free article] [PubMed] [Google Scholar]
- Wilcox AJ, Weinberg CR, Lie RT. Distinguishing the effects of maternal and offspring genes through studies of “case-parent triads”. Am J Epidemiol. 1998;148:893–901. doi: 10.1093/oxfordjournals.aje.a009715. [DOI] [PubMed] [Google Scholar]
- Zaykin DV, Shibata K. Genetic flip-flop without an accompanying change in linkage disequilibrium. Am J Hum Genet. 2008;82:794–796. doi: 10.1016/j.ajhg.2008.02.001. author reply 796–797. [DOI] [PMC free article] [PubMed] [Google Scholar]
- Zhang Z, Song Y, Zhao X, Zhang X, Fermin C, Chen Y. Rescue of cleft palate in Msx1-deficient mice by transgenic Bmp4 reveals a network of BMP and Shh signaling in the regulation of mammalian palatogenesis. Development. 2002;129:4135–4146. doi: 10.1242/dev.129.17.4135. [DOI] [PubMed] [Google Scholar]
- Zucchero TM, Cooper ME, Maher BS, Daack-Hirsch S, Nepomuceno B, Ribeiro L, Caprau D, Christensen K, Suzuki Y, Machida J, Natsume N, Yoshiura K, Vieira AR, Orioli IM, Castilla EE, Moreno L, Arcos-Burgos M, Lidral AC, Field LL, Liu YE, Ray A, Goldstein TH, Schultz RE, Shi M, Johnson MK, Kondo S, Schutte BC, Marazita ML, Murray JC. Interferon regulatory factor 6 (IRF6) gene variants and the risk of isolated cleft lip or palate. N Engl J Med. 2004;351:769–780. doi: 10.1056/NEJMoa032909. [DOI] [PubMed] [Google Scholar]
Associated Data
This section collects any data citations, data availability statements, or supplementary materials included in this article.


