Abstract
Levulinic acid (LA) can be cost-effectively produced from a vast array of renewable carbohydrate-containing biomaterials. LA could facilitate the commercialization of the polymer poly(hydroxybutyrate-co-hydroxyvalerate) (PHBV) and PHBV-based products as carbon substrates. Therefore, this paper focused on the production of PHBV by Ralstonia eutropha with LA for hydroxyvalerate (HV) production, which plays an important role in enhancing the thermal properties of PHBV. Accordingly, the HV content of PHBV varied from 0–40.9% at different concentrations of LA. Stimulation of cell growth and PHBV accumulation were observed when 2–6 g L−1 LA was supplied to the culture. The optimal nitrogen sources were determined to be 0.5 g L−1 ammonium chloride and 2 g L−1 casein peptone. It was determined that the optimal pH for cell growth and PHBV accumulation was 7.0. When the cultivation was performed in large scale (2 L fermenter) with a low DO concentration of 30% and a pH of 7.0, a high maximum dry cell weight of 15.53 g L−1 with a PHBV concentration of 12.61 g L−1 (53.9% HV), up to 81.2% of the dry cell weight, was obtained. The melting point of PHBV found to be decreased as the fraction of HV present in the polymer increased, which resulted in an improvement in the ductility and flexibility of the polymer. The results of this study will improve the understanding of the PHBV accumulation and production by R. eutropha and will be valuable for the industrial production of biosynthesized polymers.
Introduction
Biosynthesized polyhydroxyalkanoate (PHA) polymers are currently attracting much interest from researchers because of their physical properties, which are similar to those of conventional thermoplastics, such as polyethylene (PE) and polypropylene (PP) [1]–[3]. A variety of bacteria are known to use various carbon substrates to synthesize PHAs under limiting growth conditions [4]–[9], including Ralstonia eutropha, a model bacterium for PHA synthesis [10]–[11].
PHB is the first PHA that was identified and is most likely the best-characterized PHA. However, the degradation temperature of PHB is just a few degrees above its melting temperature, which results in instability during the melting stage. Additionally, the brittleness, hardness and crystalline nature of PHB limit its applications [12]. The incorporation of other monomeric units into HB polymer chains can lead to copolymers with improved properties [13]–[14]. Work focused on improving the properties of PHB has led to the copolymer of HB and 3-hydroxyvalerate (HV), namely poly(3-hydroxybutyrate/3-hydroxyvalerate) (PHBV) [15]. When compared to PHB homopolymer, the PHBV copolymer has better physical properties such as impact resistance, toughness, flexibility and other properties involved in the manufacturing process. Additionally, the performance of PHBV can vary greatly when this polymer contains different proportions of the HV monomer. Increasing the HV content in PHBV from 0 to 50% can significantly lower the melting point of the resulting polymer.
The structure of PHBV can be manipulated by the types of carbon sources supplemented into the medium. Dionisi et al. obtained a homopolymer of polyhydroxyvalerate (PHV) from propionate and a copolymer (34% HB and 66% HV) from a mixture of acetate and propionate [16]. Beccari et al. obtained a copolymer of HB and HV (50% HB and 50% HV) from a mixture of acetate, propionate, butyrate and valerate [17]. Several odd-numbered carbon sources (e.g., propionate and valerate) were supplemented into the medium to incorporate HV units into PHBV.
Although PHBV could be produced by different types of carbon sources, the main obstacle hindering the economical production of PHBV is the cost of the carbon substrate, which accounts for 28–50% of the total production cost during microbial fermentation [18]–[19]. Therefore, it is important to manipulate the substrate composition so that synthetic PHBV production by microbial fermentation is inexpensive. Levulinic acid (LA) is a renewable co-product that has drawn interest as substrates for PHA biopolymer synthesis. LA can be produced cost-effectively from a vast array of carbohydrate-containing renewable biomaterials, including cellulose-containing forest and agricultural waste residues, paper mill sludge, and cellulose fines from paper production processes. Because of this, economic projections indicate that LA production costs could fall to as low as $0.04–$0.10/lb depending on the scale of operation [20]–[22]. Several studies have demonstrated the use of LA as a sole carbon source or a co-substrate for cell growth and PHA biosynthesis [23]–[24]. LA can serve as a cheap alternative to conventional fermentation substrates. However, problems remain in using LA for PHA biosynthesis. A maximal PHA content of only 38.3% (w/w) was achieved when Alcaligenes sp. SH-69 was cultivated on glucose and LA [25]. Shaking-flask fermentation of Burkholderia cepacia (formerly Pseudomonas cepacia) containing 2.2% (w/v) xylose and concentrations of LA ranging from 0.07% to 0.67% (w/v) yielded 4.4–5.3 g L−1 of dry cell biomass, containing 42–56% (w/w) PHBV [26]. The low content of PHBV in biomass leads to a high cost for both production processes and downstream processing and thus restricts the use of LA for PHBV biosynthesis.
In this work, the effects of different constituents of the medium and other culture conditions for PHBV production by R. eutropha on LA during shaking-flask fermentation were investigated. Then, the optimal medium for PHBV production was applied in 2-L fermentation. Finally, the thermal properties of PHBV were analyzed using differential scanning calorimetry (DSC) and thermogravimetry (TG). The results of this study will improve the understanding of PHBV accumulation and production by microbes and be valuable for industrial polymer biosynthesis.
Materials and Methods
Bacterial Strain
Ralstonia eutropha H16 was used in all experiments. The strain was maintained on nutrient agar slants at 4°C and sub-cultured monthly.
Media and Cultivation Conditions
Nutrient broth consisting of 10 g L−1 beef extract, 10 g L−1 tryptone and 2.0 g L−1 yeast extract was used for seed cultures. For the nutrient agar slants, 2% agar was added to this medium. The fermentation medium (MSM) contained 3.0 g L−1 Na2HPO4·12H2O, 0.5 g L−1 KH2PO4, 0.5 g L−1 NH4Cl, 0.1 g L−1 MgSO4·7H2O, 1.2 mg L−1 Fe(III)NH4-citrate and 10 mL L−1 trace element solution. The trace element solution consisted of 10 mg L−1 ZnSO4·7H2O, 3 mg L−1 MnCl2·4H2O, 30 mg L−1 H3BO3, 20 mg L−1 CoCl2·6H2O, 1 mg L−1 CuCl2·6H2O, 2 mg L−1 NiCl2·6H2O and 3 mg L−1 NaMoO4·2H2O. The initial pH of all media was adjusted to 7.0 (unless otherwise indicated) with NaOH (1 M) and HCl (0.5 M). The effects of using different LA co-carbon sources, including 20 g L−1 fructose, glucose, sucrose, lactose, dextrin, soluble starch, and molasses, on PHBV production were investigated. A series of nitrogen sources was also investigated. All media were prepared with distilled water and sterilized at 121°C for 30 min.
Shaking-flask Fermentation
Overnight culture (16h) of R. eutropha was prepared using nutrient broth medium for inoculum. 50 mL of the same media in 250 mL flask were used for ferment of PHBV with 2.5 mL (5%, v/v) of inoculum under shaking conditions for 72 h at 30°C and 200 rpm.
2-L Fermentation
Batch cultivation was also carried out in a 2-L fermenter (Applikon BioBundle, Holland) containing 1.2 L of fermentation medium (MSM) with 5% (v/v) inoculum at 30°C and aeration (500 rpm and 2 vvm air volume/culture volume/min). The pH was maintained at 7.0 by adding 1 M LA or 1 M NaOH.
PHBV Quantification
PHBV quantification was carried out according to the propanolysis method proposed by Riis and Mai [27], and Chen and Li [28] with modifications. Sealed tubes containing 2 mL of dichloroethane, 1.6 mL of propanol, 0.4 mL of hydrochloric acid, 200 µL of a propyl benzoate solution (internal standard) and the lyophilized bacterial pellets recovered from fermented solids were heated at 100°C for 4–6 h. After cooling to room temperature, 4 mL of distilled water was added for extraction. Thereafter, 0.6 µL of the organic phase was injected into a gas chromatograph at 220°C, which was equipped with a flame ionization detector (FID) and a SE-30 capillary column (30 m×0.25 mm×0.5 µm). N2 was used as the carrier gas. The temperature of the oven was programmed for the efficient separation of peaks. First, the oven temperature was held constant at 100°C for 1 min. Then, the temperature was increased to 170°C at a rate of 10°C/min, and this temperature was maintained for 5 min. The detector temperature was then increased to 250°C. Calibrations for PHB and PHV were performed with a standard of poly(3-hydroxybutyric-co-hydroxyvaleric acid) (12 wt. % PHV) of natural origin (Sigma-Aldrich Chem.).
Thermal Properties of PHBV
The thermal properties of PHBV were analyzed by DSC (DSC204, Netzsch) and TG (TG209F1, Netzsch). Specimens weighing approximately 3 mg were used for the DSC study. Heating and cooling rates were maintained at 10°C/min during the DSC runs. The specimens were heated from −30 to 200°C for 3 min. The melting temperature (Tm), melting enthalpy (▵Hf), and crystallinity (Xc) were obtained from the thermograms. Specimens weighing approximately 4 mg were used for the thermogravimetry (TG) study. The initial thermal decomposition temperature (Teoi), onset temperature (Tem), finished thermal decomposition temperature (Teof), and thermal weight loss (Wt-loss) were obtained. The specimens were heated from 0 to 400°C at a rate of 10°C/min during the TG runs in order to test the temperature of thermal degradation.
Statistical Analysis
All data were analyzed using Microsoft Excel, Origin and SPSS. The treatment effects were carried out with one-way ANOVA and the LSD multiple range test was used to determine the statistical significance (P<0.05) between pairs with SPSS.
Results
Growth of R. eutropha and PHBV Yield with different Carbon Sources
There was no significant difference in DCW and PHBV production from R. eutropha with increasing inoculum size (Fig. S1). So 5% (v/v) of inoculum was used in following shaking flask and fermenter experiments.
Although R. eutropha could grow when LA was used as the sole carbon source, the production of dry cell weight (DCW) and PHBV were lower (1.29 and 0.03 g L−1, respectively) than that in the presence of additional carbon source (4.39 and 3.18 g L−1, respectively) (Table 1). However, only PHB accumulated when glucose was used as sole carbon source, which indicated the possibility of use of LA as a precursor for PHV production. Even though, sucrose, lactose, dextrin, soluble starch, and molasses supported the growth of R. eutropha, but insignificant PHBV accumulation were observed. Thus, in the present study, R. eutropha produced significantly higher amounts of PHBV from LA in the presence of glucose as a co-substrate.
Table 1. Dry cell weight (DCW) and PHBV obtained on different carbon sources in flask fermentation.
| Carbon sources | DCW(g L−1) | PHBV(g L−1) | HV content (%) |
| LAa | 1.29±0.05 | 0.03±0.01 | 52.7±4.6 |
| Glucose+LA | 4.39±0.44 | 3.18±0.25 | 21.4±1.7 |
| Maltose+LA | 0.00±0.00 | – | – |
| Sucrose+LA | 1.86±0.12 | 0.09±0.02 | 18.6±2.1 |
| Lactose+LA | 1.98±0.16 | 0.39±0.04 | 22.5±1.3 |
| Fructose+LA | 0.00±0.00 | – | – |
| Dextrin+LA | 2.01±0.47 | 0.03±0.01 | 15.9±1.6 |
| Soluble starch+LA | 1.80±0.32 | 0.05±0.05 | 16.3±1.1 |
| Molasses+LA | 2.68±0.54 | 0.66±0.27 | 21.9±2.8 |
| Glucose (no LA)b | 3.90±0.39 | 2.44±0.59 | 0 |
50 mL (pH 7.0) of media was in 250 mL flask with 5% (v/v) inoculum under shaking conditions at 200 rpm for 72 h at 30°C.
5 g L−1 LA was added as sole carbon source.
20 g L−1 glucose was added as sole carbon source.
Effect of different Concentrations of Glucose and LA on PHBV Accumulation by R. eutropha
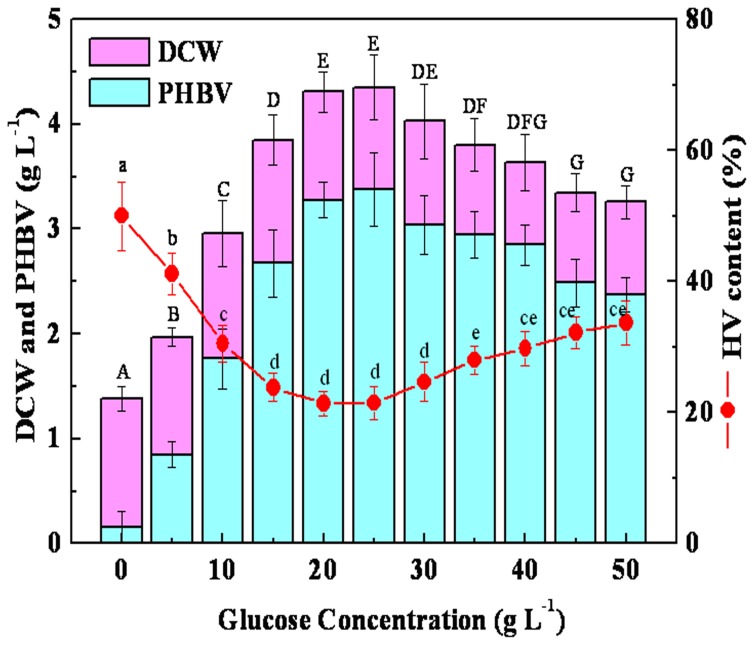
According to the experimental data with different concentration of glucose as a co-substrate in the presence of constant amount of LA (5 g L−1), DCW and PHBV concentration showed increasing trend with concentration of glucose up to 25 g L−1 followed by progressive fall of production. In contrast, concentration of HV decreased with an increasing concentration of glucose (0–25 g L−1) and increased with an increasing concentration of glucose (25–35 g L−1). However, the concentration of HV remained nearly constant at glucose concentrations greater than 35 g L−1 (Fig. 1).
Figure 1. Effect of different glucose concentrations on DCW, PHBV and HV production.
Sharing a common lowercase are not significantly different in the HV content and the same capital are not significantly different in the concentration of DCW and PHBV (P<0.05). 50 mL (pH 7.0) of media was in 250 mL flask with 5% (v/v) inoculum under shaking conditions at 200 rpm for 72 h at 30°C.
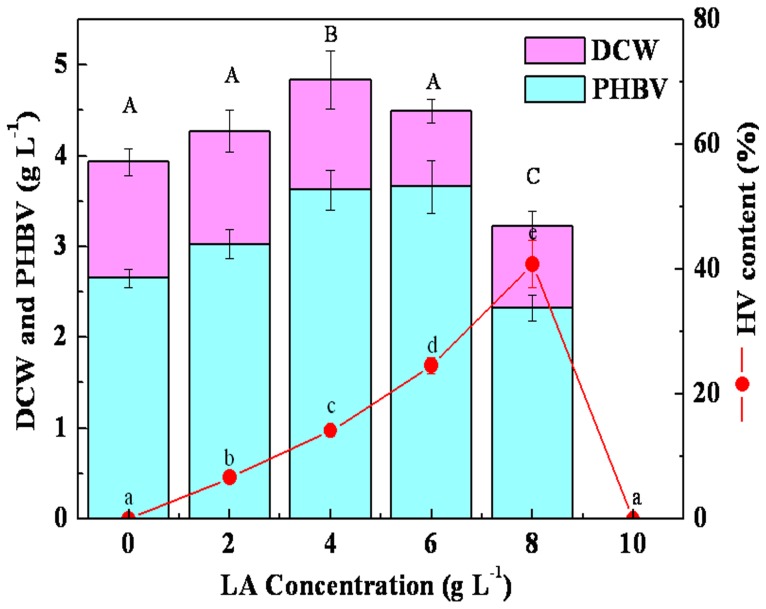
DCW and PHBV were also affected by the amount of LA in the medium. Increment of DCW and PHBV production were observed during the raise of LA concentration up to 6 g L−1 beyond which showed significant reduction and complete inhibition of DCW and PHBV with 10 g L−1 LA. (Fig. 2).
Figure 2. Effect of different LA concentrations on DCW, PHBV and HV production.
Sharing a common lowercase are not significantly different in the HV content and the same capital are not significantly different in the concentration of DCW and PHBV (P<0.05). 50 mL (pH 7.0) of media was in 250 mL flask with 5% (v/v) inoculum under shaking conditions at 200 rpm for 72 h at 30°C.
Effects of Nitrogen Sources on PHBV Accumulation by R. eutropha
Production of PHBV by R. eutropha was found to be significantly affected by the nitrogen concentration. Accordingly, there was a significant increase in DCW after the addition of ammonium chloride, ammonium sulfate and urea as a source of inorganic nitrogen, however, a higher PHBV production observed with the addition of ammonium chloride compared to other inorganic nitrogen source used (Table S1). Similar experimental evidences also reviled that casein peptone found to be better source of organic nitrogen source. Supporting the fact that, a maximum DCW (5.74 g L−1) and PHBV (3.86 g L−1) were obtained with the combination of those two organic and inorganic nitrogen sources (Table S2).
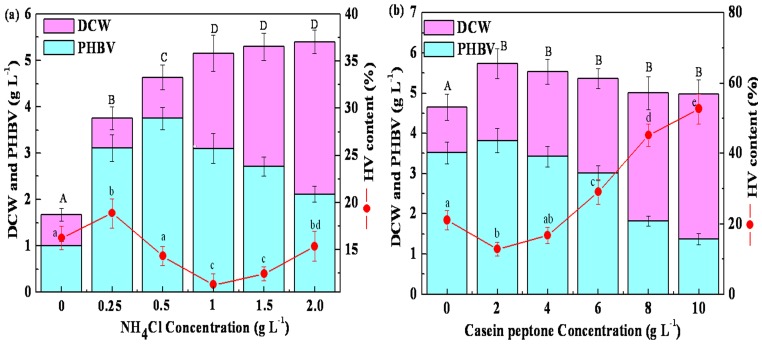
According to our experimental data revealed in Fig. 3a, cell growth showed increasing with the concentration of NH4Cl, whereas the PHBV production increased up to 0.5 g L−1 and then progressively decreased. Thus, the optimized NH4Cl concentration was found to be 0.5 g L−1. Likewise, the cell growth and PHBV production with different concentrations of casein peptone were also investigated. As shown in Fig. 3b, PHBV production decreased with an increase in casein peptone concentration while the cell growth remained almost the same. Thus, the optimized casein peptone concentration was found to be 2.0 g L−1.
Figure 3. Effects of NH4Cl (a) and casein peptone (b) concentration on DCW, PHBV and HV production.
Sharing a common lowercase are not significantly different in the HV content and the same capital are not significantly different in the concentration of DCW and PHBV (P<0.05). 50 mL (pH 7.0) of media was in 250 mL flask with 5% (v/v) inoculum under shaking conditions at 200 rpm for 72 h at 30°C.
Effects of the Initial pH on PHBV Accumulation by R. eutropha
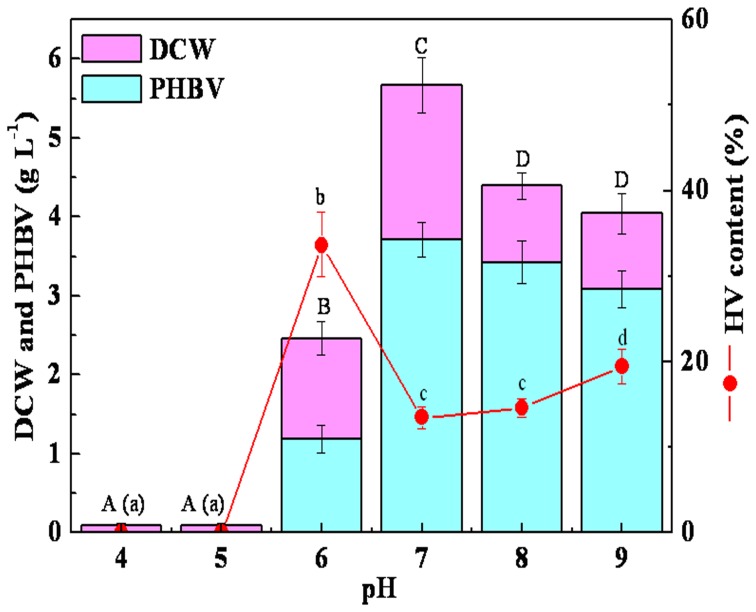
Cell growth was completely inhibited under pH 5.0. However, a maximum DCW of 5.67 g L−1 and PHBV concentration of 3.71 g L−1 was obtained when the pH was 7.0 (Fig. 4). Although the final pH of the culture broth ranged from 8.20∼8.90 throughout all experiments, an initial pH of 8.0 or 9.0 resulted in decreased PHBV accumulation by R. eutropha compared to that of cultures with an initial pH of 7.0.
Figure 4. Effects of initial pH on DCW, PHBV and HV production.
Sharing a common lowercase are not significantly different in the HV content and the same capital are not significantly different in the concentration of DCW and PHBV(P<0.05). 50 mL of media was in 250 mL flask with 5% (v/v) inoculum under shaking conditions at 200 rpm for 72 h at 30°C.
Accumulation of PHBV in a 2-L Fermenter
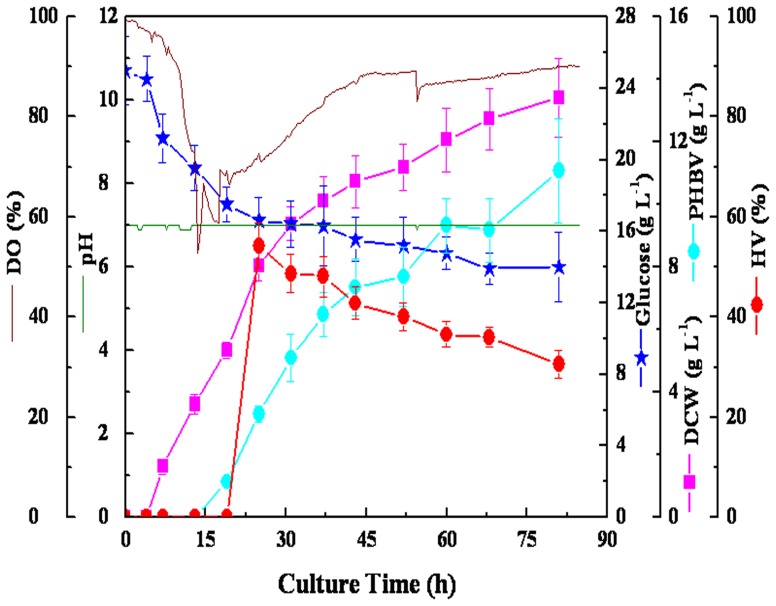
The 250 mL flask experiment proved that the pH value is an important parameter for PHBV production and that PHBV production can be significantly improved by controlling the pH. Therefore, 25 g L−1 glucose and 4 g L−1 LA were added at the beginning as the carbon sources in a 2-L fermenter, and the culture was automatically fed to keep the pH at 7.0. Fig. 5 shows the time course of R. eutropha growth in a 2-liter fermenter at pH 7.0. At 16 h, there was a significant decrease in the concentration of DO, which was followed by an increase in DO to a concentration of 90%. The dry cell weight increased to 13.41 g L−1 at 81 h. PHBV reached a final concentration of 11.08 g L−1, up to 82.6% of the cell weight. However, the HV content was only 30.6% (w/w).
Figure 5. Batch cultivation of R. eutropha for PHBV accumulation under the condition of stable pH, which was automatically fed to keep the pH of the culture at 7.0. 1.2 L (pH 7.0) of media was in 2 L fermenter with 5% (v/v) inoculum at 30°C and aeration/agitation (500 rpm and 2 vvm air volume/culture volume/min).
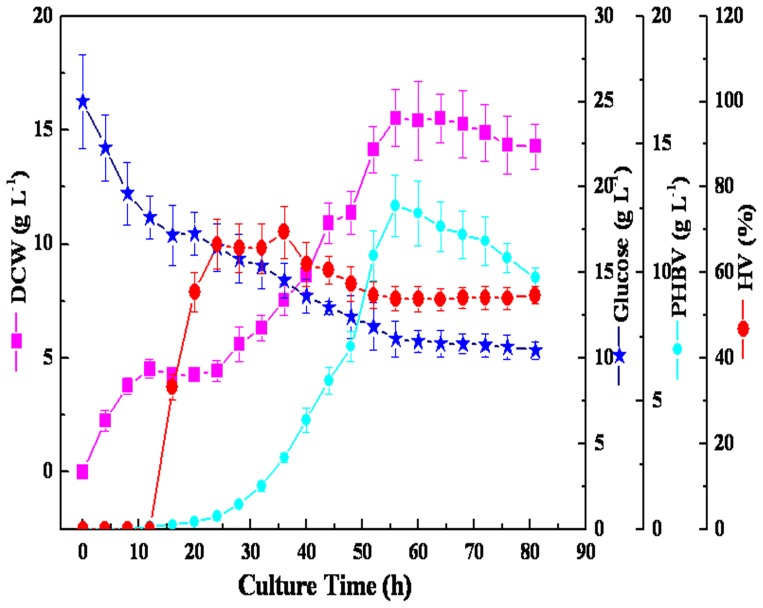
To enhance the HV content in PHBV, the 2-L fermenter was programmed to automatically keep the DO of the culture at 30% at pH 7.0 (Fig. S2). Aliquots of 25 g L−1 glucose and 4 g L−1 LA were also added as carbon sources. Fig. 6 shows the growth curve of R. eutropha in a 2-Lfermenter. The dry cell weight increased to 15.53 g L−1 in 56 h, and PHBV reached a final concentration of 12.61 g L−1, up to 81.2% of the cell weight. The highest HV content obtained was 53.9% (w/w).
Figure 6. Batch cultivation of R. eutropha for PHBV accumulation under the condition of stable pH and DO, which was automatically kept at 7.0 and 30%, respectively.
1.2 L (pH 7.0) of media was in 2 L fermenter with 5% (v/v) inoculum at 30°C and aeration.
HV Fractions and Thermal Properties
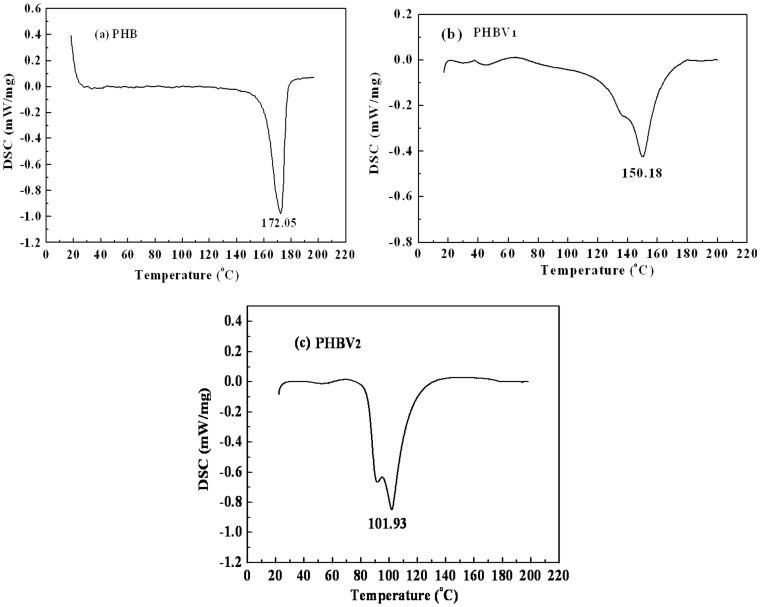
The thermal properties of PHBV (containing 0, 16 and 53% of HV monomer, respectively) were analyzed by DSC and TG. Fig. 7 shows the DSC thermograms of the different PHBV specimens. The degree of crystallinity (Xc), melting point (Tm), and melting enthalpy (▵Hf) of the PHBV specimens are summarized in Table 2. The data in Table 2 suggest that the degree of crystallinity of PHBV increased with decreasing HV content in the polymer, which might mean that the three polymers exhibited obvious differences in crystallinity. The melting point of PHBV also decreased with an increase in the amount of HV, which potentially resulted in an improvement in the ductility and flexibility of the polymer.
Figure 7. DSC thermograms of PHB (a), PHBV1 (b) and PHBV2 (c) samples.
Table 2. Thermal properties of PHBV samples with different fractions of HV.
| DSC | TG | |||||||
| Sample | HV | XC | Tm | ▵Hf | Teoi | Tem | Teof | Wt-Loss |
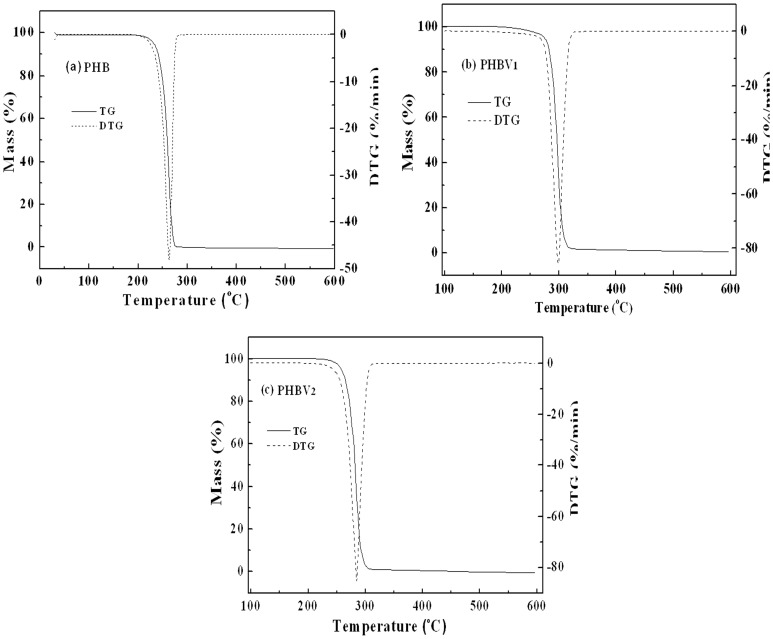
| PHB | 0 | 61.44 | 172.05 | 89.7 | 249.6 | 263.4 | 269.8 | 88.72 |
| PHBV1 | 16% | 50.34 | 150.18 | 73.5 | 266.6 | 298.3 | 315.9 | 85.60 |
| PHBV2 | 53% | 51.92 | 101.93 | 75.8 | 252.3 | 284.4 | 303.6 | 85.87 |
Xc: crystallinity, Tm: melting point, ▵Hf: melting enthalpy, Teoi: initial thermal decomposition temperature, Tem: onset temperature, Teof: finished thermal decomposition temperature, Wt-loss: thermal weight loss.
Fig. 8 shows the TG graph of the different PHBV specimens. The results of a TG graph analysis are also listed in Table 2. It can be seen that the thermal decomposition temperatures of three PHBV specimens were in the range of 240–290°C, and there were no significant decreases in Teoi, Tem, Teof with increasing HV content.
Figure 8. TG-DTG curve of PHB (a), PHBV1 (b) and PHBV2 (c) samples.
Discussion
Recent studies have shown that PHB is commonly produced at an industrial level from Cupriavidus necator, Alcaligenes latus and R. eutropha [11], [29]–[30]. However, a melting temperature that is close to the degradation temperature and the brittle, hard and crystalline nature of PHB limits its applications [12]. In this study, the bacterium R. eutropha was able to use LA as the co-carbon source to synthesize the copolymer PHBV in shaking-flask and 2-L fermentations.
LA can be produced cost-effectively from a vast array of carbohydrate-containing renewable biomaterials. Because of this, economic projections indicate that LA production costs could fall to as low as $0.04–$0.10/lb depending on the scale of operation [20]–[22]. Since LA is cheap and is a structural analog of pentanoic acid, it has been assessed as a secondary substrate in PHA biosynthesis. In present study, the optimized PHBV yield in a 2-L fermenter was 12.61 g L−1, up to 81.2% of the cell weight when LA was the co-carbon source (Fig. 6). The PHBV content was much higher than that achieved by Burkholderia sp. IS-01 in a 7-L fermenter, which contained gluconate (20 g L−1) and LA (5 to 12.5 g L−1) as the co-substrates [31]. Additionally, although high concentration of LA is known to be toxic to microorganisms and to lead to a decrease in growth, there was a significant increase in the DCW of R. eutropha as the concentration of LA was increased from 2 to 8 g L−1 in this study (Fig. 2). This result was quite different from that obtained with R. eutropha KHB-8862, in which LA addition showed no stimulatory effect on cell growth [32]. Although a stimulatory effect of LA addition has been observed [25], it has been restricted to a relatively low concentration (0.5 g L−1) of LA. Conversely, the maximum cell growth and, consequently, the maximum PHBV production were highly dependent on the nitrogen source and the initial pH. Even though previous studies have described urea as the best nitrogen source for PHA production by R. eutropha [33]–[34], our experimental evidence reviled that using NH4Cl and casein peptone, 70% more PHBV was produced compared to the batch fermentation using urea as the initial nitrogen source (Fig. 3, Table S1).
Although LA can act as co-carbon source for PHBV production, no significant PHBV was accumulated when sucrose, lactose, dextrin, soluble starch, and molasses were used as carbon sources (Table 1). More importantly, when glucose was chosen as the sole carbon source, only PHB accumulated, which indicated that LA was the precursor for PHV and might be an effective means by which to control the HV content in the copolyesters. In this study, as the concentration of LA varied from 2 to 8 g L−1, the HV content significantly increased (Fig. 2). It was suggested that LA is first activated to form levulinyl-CoA and then split into propionyl-CoA and acetyl-CoA. The two intermediates are either used for cell growth via the main metabolism pathway or condensed into 3-ketovaleryl-CoA for HV via the well-established PHA biosynthesis pathway (Fig. S3). This might be the reason for the increase in the HV content when the LA concentration was increased because more propionyl-CoA was formed. It was also shown that the percentage of HV reached a maximum at 36 h before the most active PHBV biosynthesis occurred (Fig. 6). Thereafter, the percentage of HV declined while PHBV production increased. This may be due to the higher synthesis rate of HB because the synthesis of HV depends on the level of metabolism needed to convert the precursor substrates into their corresponding hydroxyacyl-CoA thioesters [35].
In addition to the initial LA concentration, the concentrations of the nitrogen source and DO also have important roles in determining the HV content of PHBV. There was a significant increase in the HV content with an increasing concentration of casein peptone (Fig. 3). It has been proposed that HV production was significantly influenced by suitable C:N ratio [28], [31]. More importantly, 54% HV content could be produced at a low concentration of DO; however, only 30.6% HV content was synthesized at a high concentration of DO (Figs. 5 and 6). A previous study also demonstrated that HV was easily accumulated by microorganisms under such unbalanced growth conditions of DO that combined intermittent aeration and nutrient limitation [2]. Accordingly, obtaining the desired fraction of HV in PHBV requires the proper ration of C:N and stress resistance conditions.
The fraction of HV present in PHBV had a significant effect on the melting point, which decreased with an increase in the amount of HV in PHBV. This resulted in an improvement in the ductility and flexibility of the polymer. In this study, three PHBV specimens did not begin thermal decomposition until 220°C (Fig. 8 and Table 2), which is in agreement with a previous report [14], [36]. Because the melting temperatures of three PHBV specimens were approximately 100–150°C and their thermal decomposition temperatures were above 220°C, it is clear that increasing the HV content in the PHBV polymer greatly improved its workability.
To conclude, biodegradable polymers, especially PHBV, will certainly play an important role in the plastics market in the future due to their biodegradability and to the use of renewable resources for their production. Although their manufacturing costs today are still too high to compete with conventional petroleum-based polymers, LA has great potential for large-scale production of the polymer as it can be produced cost-effectively. When batch cultivation was conducted in a 2-L lab scale fermenter, a significantly higher maximum dry cell weight of 15.53 g L−1 with a PHBV concentration of 12.61 g L−1 (53.9% HV), up to 81.2% of the dry cell weight, was obtained. More importantly, a desired fraction of HV in the PHBV could be obtained with the proper C:N ratio and stress resistance conditions, which will certainly improve PHBV competitiveness and make the broad use of these biopolymers possible in the future.
Supporting Information
Effect of inoculum size on cell growth and PHBV production from R. eutropha.
(DOC)
Online data of batch cultivation under DO-stat control along with pH-stat control.
(DOC)
Metabolic pathway of PHBV synthesis from levulinic acid (CoA, coenzyme-A; ATP, adenosine triphosphate; PhaA, β-ketothiolase A; BktB, β-ketothiolase B; PhaB, NADPH-dependent acetoacetyl-CoA reductase; NADPH, nicotinamide adenine dinucleotide phosphate; PhaC, PHA synthase).
(DOC)
Dry cell weight (DCW) and PHBV obtained on different nitrogen sources.
(DOC)
Dry cell weight (DCW) and PHBV obtained on different organic nitrogen sources with or without ammonium chloride.
(DOC)
(DOC)
Funding Statement
This work was supported by the National Basic Research Program of China (2013CB733505), National Natural Science Foundation of China (41071302), Xiamen Science and Technology committee (3502Z20121021, 3502Z20126005), Fujian Development and Reform Commission ([2011]1598) and Natural Science Foundation of Fujian Province of China (2010J05121). The funders had no role in study design, data collection and analysis, decision to publish, or preparation of the manuscript.
References
- 1. Guo W, Tao J, Yang C, Song C, Geng W, et al. (2012) Introduction of Environmentally Degradable Parameters to Evaluate the Biodegradability of Biodegradable Polymers. PLoS ONE 7(5): e38341. [DOI] [PMC free article] [PubMed] [Google Scholar]
- 2. Fernando MS, Anton K, Peter J, Steven P, Nico B, et al. (2010) Production of polyhydroxyalkanoates in open, mixed cultures from a waste sludge stream containing high levels of soluble organics, nitrogen and phosphorus. Water Res 44: 5196–5211. [DOI] [PubMed] [Google Scholar]
- 3. Chang HF, Chang WC, Tsai CY (2012) Synthesis of poly(3-hydroxybutyrate/3-hydroxyvalerate) from propionate-fed activated sludge under various carbon sources. Bioresource Technol 113: 51–59. [DOI] [PubMed] [Google Scholar]
- 4. Anderson AJ, Dawes EA (1990) Occurrence, Metabolism, Metabolic Role, and Industrial Uses of Bacterial Polyhydroxyalkanoates. Microbiol Rev 54: 450–472. [DOI] [PMC free article] [PubMed] [Google Scholar]
- 5. Grothe E, Chisti Y (2000) Poly(beta-hydroxybutyric acid) thermoplastic production by Alcaligenes lotus: Behavior of fed-batch cultures. Bioprocess Eng 22 (5): 441–449. [Google Scholar]
- 6. Lee SY, Wong HH, Choi JI, Lee SH, Lee SC, et al. (2000) Production of medium-chain-length polyhydroxyalkanoates by high-cell-density cultivation of Pseudomonas putida under phosphorus limitation. Biotechnol Bioeng 68: 466–470. [PubMed] [Google Scholar]
- 7. Luengo JM, Garcia B, Sandoval A, Naharro G, Olivera ER (2003) Bioplastics from microorganisms. Curr Opin Microbiol 6 (3): 251–260. [DOI] [PubMed] [Google Scholar]
- 8. Li R, Zhang HX, Qi QS (2007) The production of polyhydroxyalkanoates in recombinant Escherichia coli . Bioresource Technol 98: 2313–2320. [DOI] [PubMed] [Google Scholar]
- 9. Park SJ, Lee TW, Lim SC, Kim TW, Lee H, et al. (2012) Biosynthesis of polyhydroxyalkanoates containing 2-hydroxybutyrate from unrelated carbon source by metabolically engineered Escherichia coli . Appl Microbiol Biot 93: 273–283. [DOI] [PubMed] [Google Scholar]
- 10. Kim JS, Lee BH, Kim BS (2005) Production of poly(3-hydroxybutyrate-co-4-hydroxybutyrate) by Ralstonia eutropha . Biochem Eng J 23 (2): 169–174. [Google Scholar]
- 11. Riedel SL, Bader J, Brigham CJ, Budde CF, Yusof ZAM, et al. (2012) Production of poly(3-hydroxybutyrate-co-3-hydroxyhexanoate) by Ralstonia eutropha in high cell density palm oil fermentations. Biotechnol Bioeng 109: 74–83. [DOI] [PubMed] [Google Scholar]
- 12. Kenny ST, Runic JN, Kaminsky W, Woods T, Babu RP, et al. (2012) Development of a bioprocess to convert PET derived terephthalic acid and biodiesel derived glycerol to medium chain length polyhydroxyalkanoate. Appl Microbiol Biot 95: 623–633. [DOI] [PubMed] [Google Scholar]
- 13. Haddouche R, Poirier Y, Delessert S, Sabirova J, Pagot Y, et al. (2011) Engineering polyhydroxyalkanoate content and monomer composition in the oleaginous yeast Yarrowia lipolytica by modifying the beta-oxidation multifunctional protein. Appl Microbiol Biot 91: 1327–1340. [DOI] [PubMed] [Google Scholar]
- 14. Sheu DS, Chen WM, Lai YW, Chang RC (2012) Mutations Derived from the Thermophilic Polyhydroxyalkanoate Synthase PhaC Enhance the Thermo stability and Activity of PhaC from Cupriavidus necator H16. J Bacteriol 194: 2620–2629. [DOI] [PMC free article] [PubMed] [Google Scholar]
- 15. Shang LG, Yim SC, Park HG, Chang HN (2004) Sequential feeding of glucose and valerate in a fed-batch culture of Ralstonia eutropha for production of poly(hydroxybutyrate-co-hydroxyvalerate) with high 3-hydroxyvalerate fraction. Biotechnol Progr 20 (1): 140–144. [DOI] [PubMed] [Google Scholar]
- 16. Dionisi D, Majone M, Tandoi V, Beccari M (2001) Sequencing batch reactor: influence of periodic operation on performance of activated sludge in biological wastewater treatment. Ind Eng Chem Res 40: 5110–5119. [Google Scholar]
- 17. Beccari M, Majone M, Massanisso P, Ramadori R (1998) A bulking sludge with high storage response selected under intermittent feeding. Water Res 32: 3403–3413. [Google Scholar]
- 18. Cavalheiro JMBT, aposo RS, de Almeida MCMD, Cesario MT, Sevrin C, et al. (2012) Effect of cultivation parameters on the production of poly(3-hydroxybutyrate-co-4-hydroxybutyrate) and poly(3-hydroxybutyrate-4-hydroxybutyrate-3-hydroxyvalerate) by Cupriavidus necator using waste glycerol. Bioresource Technol 111: 391–397. [DOI] [PubMed] [Google Scholar]
- 19. Wong YM, Brigham CJ, Rha C, Sinskey AJ, Sudesh K (2012) Biosynthesis and characterization of polyhydroxyalkanoate containing high 3-hydroxyhexanoate monomer fraction from crude palm kernel oil by recombinant Cupriavidus necator. . Bioresource Technol 121: 320–327. [DOI] [PubMed] [Google Scholar]
- 20. Ashby RD, Solaiman DKY, Strahan GD, Zhu CJ, Tappel RC, et al. (2012) Glycerine and levulinic acid: Renewable co-substrates for the fermentative synthesis of short-chain poly(hydroxyalkanoate) biopolymers. Bioresource Technol 118: 272–280. [DOI] [PubMed] [Google Scholar]
- 21. Bozell JJ, Moens L, Elliott DC, Wang Y, Neuenscwander GG, et al. (2000) Production of levulinic acid and use as a platform chemical for derived products. Resour Conserv Recy 28: 227–239. [Google Scholar]
- 22. Cha JY, Hanna MA (2002) Levulinic acid production based on extrusion and pressurized batch reaction. Ind Crop Prod 16: 109–118. [Google Scholar]
- 23. Yu J, Chen LXL, Sato S (2009) Biopolyester Synthesis and Protein Regulations in Ralstonia eutropha on Levulinic Acid and Its Derivatives from Biomass Refining. J Biobased Mater Bio 3: 113–122. [Google Scholar]
- 24. Lee SE, Li QX, Yu J (2009) Diverse protein regulations on PHA formation in Ralstonia eutropha on short chain organic acids. Int J Biol Sci 5: 215–225. [DOI] [PMC free article] [PubMed] [Google Scholar]
- 25. Jang JH, Rogers PL (1996) Effect of levulinic acid on cell growth and poly-beta-hydroxyalkanoate production by Alcaligenes sp SH-69. Biotechnol Lett 18 (2): 219–224. [Google Scholar]
- 26. Keenan TM, Tanenbaum SW, Stipanovic AJ, Nakas JP (2004) Production and characterization of poly-beta-hydroxyalkanoate copolymers from Burkholderia cepacia utilizing xylose and levulinic acid. Biotechnol Progr 20 (6): 1697–1704. [DOI] [PubMed] [Google Scholar]
- 27. Riis V, Mai W (1988) Gas chromatographic determination of poly-β-hydroxybutyrate acid in microbial biomass after hydrochloric acid propanolysis. J Chromatogr 445: 285–289. [Google Scholar]
- 28. Chen H, Li X (2008) Effect of static magnetic field on synthesis of polyhydroxyalkanoates from different short-chain fatty acids by activated sludge. Bioresource Technol 99: 5538–5544. [DOI] [PubMed] [Google Scholar]
- 29. Kim DY, Kim HC, Kim SY, Rhee YH (2005) Molecular characterization of extracellular medium-chain-length poly(3-hydroxyalkanoate) depolymerase genes from Pseudomonas alcaligenes strains. J Microbiol 43: 285–294. [PubMed] [Google Scholar]
- 30. Berezina N (2012) Enhancing the 3-hydroxyvalerate component in bioplastic PHBV production by Cupriavidus necator . Biotechnol J 7: 304–309. [DOI] [PubMed] [Google Scholar]
- 31. Kim DY, Park DS, Kwon SB, Chung MG, Bae KS, et al. (2009) Biosynthesis of poly(3-hydroxybutyrate-co-3-hydroxyvalerate) copolyesters with a high molar fraction of 3-hydroxyvalerate by an insect-symbiotic Burkholderia sp IS-01. J Microbiol 47: 651–656. [DOI] [PubMed] [Google Scholar]
- 32. Chung SH, Choi GG, Kim HW, Rhee YH (2001) Effect of levulinic acid on the production of poly(3-hydroxybutyrate-co-3-hydroxyvalerate) by Ralstonia eutropha KHB-8862. J Microbiol 39: 79–82. [Google Scholar]
- 33. Khanna S, Srivastava AK (2006) Computer simulated fed-batch cultivation for over production of PHB: A comparison of simultaneous and alternate feeding of carbon and nitrogen Biochem Eng J. 27: 197–203. [Google Scholar]
- 34. Ng KS, Wong YM, Tsuge T, Sudesh K (2011) Biosynthesis and characterization of poly(3-hydroxybutyrate-co-3-hydroxyvalerate) and poly(3-hydroxybutyrate-co-3-hydroxyhexanoate) copolymers using jatropha oil as the main carbon source. Process Biochem 46: 1572–1578. [Google Scholar]
- 35. Steinbuchel A, Valentin HE (1995) Diversity of Bacterial Polyhydroxyalkanoic Acids. Fems Microbiol Lett 128: 219–228. [Google Scholar]
- 36. Gumel AM, Annuar MSM, Heidelberg T (2012) Biosynthesis and Characterization of Polyhydroxyalkanoates Copolymers Produced by Pseudomonas putida Bet001 Isolated from Palm Oil Mill Effluent. PLoS ONE 7(9): e45214. [DOI] [PMC free article] [PubMed] [Google Scholar]
Associated Data
This section collects any data citations, data availability statements, or supplementary materials included in this article.
Supplementary Materials
Effect of inoculum size on cell growth and PHBV production from R. eutropha.
(DOC)
Online data of batch cultivation under DO-stat control along with pH-stat control.
(DOC)
Metabolic pathway of PHBV synthesis from levulinic acid (CoA, coenzyme-A; ATP, adenosine triphosphate; PhaA, β-ketothiolase A; BktB, β-ketothiolase B; PhaB, NADPH-dependent acetoacetyl-CoA reductase; NADPH, nicotinamide adenine dinucleotide phosphate; PhaC, PHA synthase).
(DOC)
Dry cell weight (DCW) and PHBV obtained on different nitrogen sources.
(DOC)
Dry cell weight (DCW) and PHBV obtained on different organic nitrogen sources with or without ammonium chloride.
(DOC)
(DOC)


