

Background: Hdac3 depletion in osteo/chondroprogenitor cells causes severe osteopenia and decreases long bone length.
Results: Akt and mTOR activities were reduced and Phlpp1 levels were increased in Hdac3 deficient chondrocytes.
Conclusion: Hdac3 deletion suppresses the Akt/mTOR pathway by increasing expression of the protein phosphatase Phlpp1.
Significance: Hdac3 and Phlpp1 have crucial roles in regulating chondrocyte hypertrophy and cartilage regeneration.
Keywords: Akt, Articular Cartilage, Cartilage Biology, Chondrocytes, Histone Deacetylase, Histone Deacetylase Inhibitors, Phlpp1, SAHA, Vorinostat, hypertrophy
Abstract
HDACs epigenetically regulate cellular processes by modifying chromatin and influencing gene expression. We previously reported that conditional deletion of Hdac3 in osteo-chondroprogenitor cells with Osx1-Cre caused severe osteopenia due to abnormal maturation of osteoblasts. The mice were also smaller. To address the abnormal longitudinal growth in these animals, the role of Hdac3 in chondrocyte differentiation was evaluated. We found that Hdac3 is highly expressed in resting and prehypertrophic growth plate chondrocytes, as well as in articular chondrocytes. Hdac3-deficient chondrocytes entered hypertrophy sooner and were smaller than normal chondrocytes. Extracellular matrix production was suppressed as glycosaminoglycan secretion and production of aggrecan, osteopontin, and matrix extracellular phosphoglycoprotein were reduced in Hdac3-deficient chondrocytes. These phenotypes led to the hypothesis that the Akt/mTOR pathway was repressed in these Hdac3-deficient chondrocytes because Akt promotes hypertrophy and matrix production in many tissues. The phosphorylation and activation of Akt, its substrate mTOR, and the mTOR substrate, p70 S6 kinase, were indeed reduced in Hdac3-deficient primary chondrocytes as well as in chondrocytes exposed to HDAC inhibitors. Expression of constitutively active Akt restored phosphorylation of mTOR and p70 S6K and matrix gene expression levels. Reduced phosphorylation of Akt and its substrates in Hdac3-deficient or HDAC inhibitors treated chondrocytes correlated with increased expression of the phosphatase Phlpp1. Hdac3 associated with a Phlpp1 promoter region containing Smad binding elements and was released after TGFβ was added to the culture. These data demonstrate that Hdac3 controls chondrocyte hypertrophy and matrix content by repressing Phlpp1 expression and facilitating Akt activity.
Introduction
Endochondral ossification is a complex developmental process by which long bones form and many fractures heal. This process begins with the condensation of mesenchymal progenitor cells, which differentiate into chondrocytes, and progresses to the production of a type II collagen- and proteoglycan-rich matrix. With further differentiation, chondrocytes undergo hypertrophy and suppress type II collagen in favor of type X collagen. Ultimately, chondrocytes undergo apoptosis, the tissue becomes vascularized and osteoblasts and osteoclasts replace the cartilaginous matrix with a type I collagen-rich mineralized matrix. Akt is an influential intracellular serine kinase that orchestrates chondrogenesis (1, 2), increases chondrocyte proliferation (3, 4), either promotes or inhibits hypertrophy depending on cell context (3, 5, 6), and inhibits chondrocyte apoptosis (3, 6, 7). Triggered by activation of receptor tyrosine kinases, Akt phosphorylates several substrates, including mTOR, to regulate cell size, protein translation, and matrix synthesis.
Akt activation is crucial for tissue development and regeneration; however, sustained activation of Akt signaling is oncogenic, and thus, this pathway is tightly regulated. Akt signaling is terminated by PH domain and leucine-rich repeat protein phosphatase (Phlpp1/2;2 pronounced “Flip”), which dephosphorylate Ser-473 (8–10). Phlpp1 depletion maintains the phosphorylation of Akt, p70 S6K, protein kinase C (PKC), and FoxO (forkhead box protein O) and increases cell size, protein content, and the rate of cap-dependent translation (9, 11). Phlpp1 KO mice develop normally but display circadian rhythm deficits and are slightly shorter in length (12). The molecular roles of Phlpp1 in skeletal development are not known.
Histone deacetylase 3 (Hdac3) is a broadly expressed nuclear enzyme that regulates many cellular processes, including cellular hypertrophy, by post-translationally modifying proteins such as histones and transcription factors, and regulating gene expression (13, 14). Although germ line Hdac3 deletion causes embryonic lethality (15), conditional Hdac3 ablation within cardiac muscle or the liver increased hypertrophy and altered energy metabolism (16–18). Within the growth plate, Hdac4 (a binding partner of Hdac3) controls chondrocyte hypertrophy through its interaction with Runx2, Zfp521, and Mef2c (19–23); however, the role of Hdac3 in hypertrophy has not been established. We recently demonstrated that conditional knock-out of Hdac3 with osterix (Osx1)-Cre (Hdac3-CKOOsx) causes severe osteopenia and growth deficiencies. The long bone shortening was associated with an expansion of the growth plate hypertrophic chondrocyte zone (19). Here, we describe a molecular mechanism by which Hdac3 controls chondrocyte differentiation in these Hdac3-CKOOsx mice. Our data show that primary chondrocytes from Hdac3-CKOOsx mice express higher levels of Phlpp1, which reduces the phosphorylation and activation of Akt and mTOR, proteins that regulate cellular hypertrophy and matrix production.
MATERIALS AND METHODS
Hdac3 Deficient Mice
Mice harboring two copies of the Hdac3 allele with loxP sites in introns surrounding exon 7 (Hdac3fl/fl) and/or Osx1-Cre were generated and genotyped as described previously (15, 19, 24). These animals are referred to as Hdac3-CKOOsx mice in this report and are on the C57Bl/6 genetic background. Animals were housed in an accredited facility under a 12-hour light/dark cycle and provided water and food (PicoLab® Rodent Diet 20, LabDiet) ad libitum. Diets were supplemented three times per week with Nutri-Cal® (Vétoquinol Canada, Inc., Lavaltrie, QC) and Napa Nectar (S.E. Lab Group, Inc., Napa, CA). All animal research was conducted according to guidelines provided by the National Institute of Health and the Institute of Laboratory Animal Resources, National Research Council. The Mayo Clinic Institutional Animal Care and Use Committee approved all animal studies.
Isolation and Culture of IMAC Cells
Immature mouse articular chondrocytes (IMACs) were isolated as described by Gosset et al. (25). Briefly, the femoral head and tibial plateaus were dissected from 4-week-old mice. Cartilage pieces were digested twice in 3 mg/ml collagenase for 1 h and then overnight in 0.5 mg/ml collagenase. The resulting suspension of freshly isolated IMACs was placed in micromass culture by plating 10-μl drops containing 2 × 10⁵ cells in DMEM, supplemented with 5% FBS, 25 μg/ml ascorbic acid, 54 μg/ml β-glycerol phosphate and 1× mixture of insulin, transferrin, and selenium (ITS) (Invitrogen) as published previously (26, 27). Culture medium was changed every 3 days for 21 days.
Alcian Blue and Alizarin Red Staining
IMAC cultures were fixed with 10% neutral buffered formalin for 10 min and stained with Alcian blue (1% Alcian blue, 3% acetic acid) for 2 h or 1% Alizarin Red-S (pH 4.2) solution for 10 min. Tibias were fixed in 10% neutral buffered formalin, decalcified in 15% EDTA for 5 days, paraffin-embedded, sectioned, and stained with Alcian blue or Goldner's trichrome solution.
RNA Extraction and Quantitative PCR
Total RNA was isolated from IMAC cultures, ATDC5 cells, and postnatal day 1 (P1) tibias with TRIzol reagent (Invitrogen) and phenol/chloroform. RNA (2 μg) was reverse transcribed using the Superscript cDNA kit (Bio-Rad). The resulting cDNAs were placed in real-time PCR reactions containing gene-specific primers (Table 1) as outlined in Razidlo et al. (19). Fold changes in gene expression for each sample were calculated relative to expression levels at the beginning of the experiment. Each experiment was performed in triplicate.
TABLE 1.
Primers for real-time PCR reactions
| cDNA | Forward primer | Reverse primer |
|---|---|---|
| Aggrecan | 5′-CCGCTTGCCAGGGGGAGTTG-3′ | 5′-GATGATGGGCGCACGCCGTA-3′ |
| Type 2a1 Collagen | 5′-ACTGGTAAGTGGGGCAAGAC-3′ | 5′-CCACACCAAATTCCTGTTCA-3′ |
| Type X Collagen | 5′-CTTTGTGTGCCTTTCAATCG-3′ | 5′-GTGAGGTACAGCCTACCAGTTTT-3′ |
| GAPDH | 5′-GGGAAGCCCATCACCATCTT-3′ | 5′-GCCTCACCCCATTTGATGTT-3′ |
| Ihh | 5′-GCTTTCCTGCCGGAGCCCAG-3′ | 5′-GGTGGGGGTCCCATCCTCCC-3′ |
| Mepe | 5′-TGCTGCCCTCCTCAGAAATATC-3′ | 5′-GTTCGGCCCCAGTCACTAGA-3′ |
| Osteopontin (Spp1) | 5′-CCTTGCGCCACAGAATGCTGT-3′ | 5′-CGGCCGTTGGGGACATCGAC-3′ |
| PTHrP | 5′-CTGGCCCTCGCATCCACGAC-3′ | 5′-ACAGCCACTTGCGGCAGAGC-3′ |
| Phlpp1 | 5′-CTGGCGTGATAGCGGGCGAG-3′ | 5′-CCAGGCGCCGGGTAGTCTCT-3′ |
| Phlpp2 | 5′-GGGCTGAGCGCCTCGTTGTT-3′ | 5′-ACGCCTGCCGTTGCCATCTC-3′ |
| Runx2 | 5′-GGCACAGACAGAAGCTTGATGA-3′ | 5′-GAATGCGCCCTAAATCACTGA-3′ |
| Sox9 | 5′-AGGAAGCTGGCAGACCAGTA-3′ | 5′-CGTTCTTCACCGACTTCCTC-3′ |
| Vegf | 5′-AGAGGCTTGGGGCAGCCGAG-3′ | 5′-ACTCCCGGGCTGGTGAGTCC-3′ |
Western Blotting
Cells were lysed in SDS sample buffer (0.1% glycerol, 0.01% SDS, 0.1 m Tris, pH 6.8) on ice. Total protein concentrations were determined with the Bio-Rad DC assay (Bio-Rad). Proteins (40 μg) were resolved by SDS-PAGE and transferred to nitrocellulose. Western blotting was accomplished utilizing antibodies (1:2000 dilution) for p-Ser-2448 mTOR, total mTOR, p-Ser-371 p70 S6 kinase, p-Ser-473 Akt, total Akt, p-Thr-202/Tyr-204 Erk, total Erk (Cell Signaling Technologies, Boston, MA), Hdac3, Phlpp1 (Abcam, Cambridge, MA), Ac-H3 Lys-9/Lys-14, (Millipore, Billercia, MA), HA (Cambrex, East Rutherford, NJ) and actin (Santa Cruz Biotechnology, Santa Cruz, CA), and corresponding secondary antibodies (Santa Cruz Biotechnology). Chemiluminescent detection was performed with Pierce femto reagent (Pierce). Prior to reprobing, blots were stripped using Restore Western blot stripping buffer (Pierce).
Immunohistochemical Staining
Tibias from 2-week-old mice were fixed in 10% neutral buffered formalin and decalcified in 15% EDTA for 5 days and paraffin-embedded. Immunohistochemical staining was performed with antibodies directed to Hdac3 (Millipore), Phlpp1 (Abcam), or IgG isotype control. Chromogens were developed using a polyvalent secondary HRP detection kit (Abcam) followed by incubation in 3′-3′-diaminobenzidine (DAB) (Sigma Aldrich).
ATDC5 Cell Culture and Transfection
ATDC5 cells were cultured in DMEM, 5% FBS, 1% antimycotic/antibiotic, and 1× ITS. Cells were transfected with pcDNA3, pcDNA-Phlpp1ΔC (Addgene no. 22931 (28)) or pcDNA3-caAkt (29) with Lipofectamine (Invitrogen) using a 1:3 (Lipofectamine:DNA) ratio 24 h after ITS was added to the culture medium (28). Cells were then treated with the indicated concentrations of HDAC inhibitors, suberoylanilide hydroxamic acid (SAHA, Vorinostat), or trichostatin A (TSA) for 24 h.
Chromatin Immunoprecipitation
ATDC5 cells were cultured for 3 days and then treated with 2 ng/ml TGFβ for 4 h. Chromatin immunoprecipitation was performed according to Lambert and Nordeen (30). Briefly, cells were washed and DNA-protein complexes were cross-linked with 0.03% formaldehyde followed by cell lysis (1% SDS, 10 mm EDTA, 50 mm Tris, pH 8.0). Lysates were sonicated, precleared with 30 μg Dynabeads (Invitrogen) and incubated with indicated antibodies (2 μg) overnight at 4 °C. Dynabeads (60 μg) were incubated with each pull down and washed and eluted with 1% SDS, 0.1 m NaHCO3. Protein was digested, and the resulting DNA was extracted with phenol-chloroform. Amplification of the Phlpp1 promoter at an identified Smad binding site (BS) or a nonspecific binding site was performed with the following primers: (Smad BS, 5′-AGACGGGGCCAGCGATCCTGTGAA-3′ (forward) and Smad BS, 5′-GTCGAGGATACCCAGAAGA-3′ (reverse); nonspecific BS, 5′-CAGAGGGCACAATACCCACC-3′ (forward) and nonspecific BS, 5′-ACTAGTTGAGGCGGGGCGGT-3′ (reverse)).
Image Quantitation
Images were digitally scanned or collected using phase contrast microscopy and converted to threshold values using ImageJ software. Immunohistochemistry (IHC) staining was quantitated by determining the average mean gray value of cells within each growth plate zone. Angles between centers of three columnar chondrocytes within the growth plate of 5-week-old mice were also determined using ImageJ software.
Statistical Analysis
Data obtained are the means ± S.E. of the mean (n = 3). p values were determined with the Student's t test.
RESULTS
Hdac3 Regulates Chondrocyte Hypertrophy and Matrix Gene Expression
We previously showed that conditional deletion of Hdac3 within Osx1-Cre-expressing, osteo-chondroprogenitor cells stunts long bone growth and reduces trabecular and cortical bone mass (19). These animals also exhibit an expanded hypertrophic zone (19). To further understand the role of Hdac3 in chondrocyte differentiation, its expression pattern in the proximal tibia of wild-type (WT) 4-week-old mice was examined by IHC (Fig. 1). Hdac3 was detected in meniscal cells, articular, and epiphyseal chondrocytes surrounding the secondary ossification center (Fig. 1, E and F) and within defined regions of the growth plate (Fig. 1, A and B). Specifically, resting chondrocytes and prehypertrophic chondrocytes showed robust expression of Hdac3, whereas proliferating and hypertrophic chondrocytes expressed lower levels. Hdac3 levels were reduced in prehypertrophic chondrocytes, articular chondrocytes, and trabecular bone of Hdac3-CKOOsx mice (Fig. 1). These results demonstrate that Hdac3 is spatially and temporally restricted in the developing skeleton and implicate Hdac3 as a crucial regulator of endochondral ossification.
FIGURE 1.

Hdac3 is expressed in articular cartilage and the developing growth plate. Paraffin-embedded sections of tibias from 4-week-old WT mice (A–H) mice were incubated with an IgG isotype control antibody (left column) or an anti-Hdac3 antibody (right column). Shown are 100× images of the growth plate (A and B) or the articular surface (E and F) of a wild type mouse. Also shown is an Hdac3 staining of the growth plate (C and D) and the articular surface (G and H) of Hdac3-CKOOsx mice. I, relative Hdac3 staining in each growth plate zone was quantified with ImageJ. The resting (R), proliferative (P), prehypertrophic (PH), and hypertrophic (H) zones are designated in select panels. The superficial zone (SZ) and deep zone (DZ) cartilage, trabecular bone (Tb), and subchondral bone (B) are indicated in other panels.
To determine whether Hdac3 deficiency alters chondrocyte proliferation and hypertrophy, the distance from the proximal tibia epiphysis to the onset of each respective growth plate zone in postnatal day 1 (P1) WT and Hdac3-CKOOsx mice was measured as described previously (31). No overall change in the length of the periarticular chondrocyte zone or in the start of the proliferative zone was observed (Fig. 2A). However, the distance from the epiphyseal surface to the boundary between prehypertrophic and hypertrophic chondrocytes was shorter in the Hdac3-CKOOsx animals, and the normal columnar array was disorganized (Fig. 2, A and B). Alcian blue staining, which measures glycosaminoglycan content, was also reduced in the Hdac3-CKOOsx P1 tibias (Fig. 2A). Accordingly, transcripts of chondrocyte matrix genes (aggrecan, matrix extracellular phosphoglycoprotein (MEPE), and osteopontin) were significantly decreased in P1 tibias from Hdac3-CKOOsx mice (Fig. 2, C–E). These results indicate that chondrocyte hypertrophy is altered, and matrix secretion is suppressed as a result of Hdac3 deficiency.
FIGURE 2.

Hdac3 regulates chondrocyte hypertrophy and matrix gene expression. A, paraffin-embedded tibia sections were obtained from P1 WT or Hdac3-CKOOsx mice, stained with Alcian blue, and photographed (4×). The arrows indicate length measurements shown in B. B, the distance from the bone epiphysis to the onset of the hypertrophic zone was determined. C–E, total RNA was extracted from WT or Hdac3-CKOOsx P1 tibias. Relative expression of matrix genes, including aggrecan (C), osteopontin (D), and MEPE (E), was determined by real-time PCR. *, p < 0.05.
To validate the in vivo observations and demonstrate that Hdac3 deficiency alters chondrocyte differentiation in a cell autonomous manner, IMACs from Hdac3-CKOOsx or WT mice were cultured ex vivo in micromass for up to 21 days in the presence of ITS medium from days 3 to 21 (Fig. 3). Hdac3 mRNA levels were reduced by ∼50% in IMAC cultures from Hdac3-CKOOsx mice (Fig. 3D). This is the expected level of Hdac3 suppression, because Osx (Sp7) is not expressed in all chondrocytes. Both WT and Hdac3-CKOOsx IMACs formed dense and stable micromasses that bound Alcian blue as early as day 3 (Fig. 3). In response to ITS, WT chondrocytes produced glycosaminoglycans that bound Alcian blue with increasing intensity through day 10. At day 21, hypertrophic chondrocytes dominated the micromasses (Fig. 3C). WT micromasses were encapsulated with a calcified matrix at day 21 (Fig. 3A). In contrast, micromasses from Hdac3-CKOOsx mice stained poorly with Alcian blue beginning at day 7 and relative expression levels of aggrecan, MEPE, and osteopontin mRNAs were decreased in Hdac3-deficient IMACs (Fig. 3, J–L), similar to that observed in vivo (Fig. 2). The diffuse Alcian blue staining persisted throughout the ex vivo differentiation. Matrix calcification was also reduced in the Hdac3-CKOOsx cultures. These data indicate that Hdac3-CKOOsx chondrocytes have defects in chondrocyte matrix production.
FIGURE 3.

Hdac3 regulates hypertrophy and matrix gene expression. A, WT or Hdac3-CKOOsx IMAC cells were harvested and placed in micromass culture to simulate chondrocyte differentiation to hypertrophy. Cultures were fixed and stained with Alcian blue at days 3, 7, 10, and 14 or stained with Alizarin red at day 21. B, sections WT or Hdac3-CKOOsx micromasses were stained with Alcian blue at day 21. C, the normal progression of chondrocyte phenotypic marker gene expression. D–L, WT or Hdac3-CKOOsx IMAC cells were cultured in micromass, and total RNA was harvested as indicated. Relative expression levels of Hdac3 (D), collagen 2a1 (E), Indian hedgehog (Ihh; F), Runx2 (G), type X collagen (H), VEGF (I), aggrecan (J), osteopontin (K), and MEPE (L) was assayed by real-time PCR. *, p < 0.05 compared with WT.
Further molecular analysis of mRNA expression confirmed that chondrocyte differentiation was disturbed in IMACs from Hdac3-CKOOsx mice (Fig. 3, E–I). Collagen 2a1 and Indian hedgehog, markers of immature and prehypertrophic chondrocytes, as well as VEGF were increased in Hdac3-CKOOsx cultures at day 7 but were down-regulated relative to WT levels by day 14. Runx2 levels increased at equal rates in both WT and Hdac3-CKOOsx cultures. In contrast, collagen X, a late marker of chondrocyte differentiation, increased >50-fold in Hdac3-CKOOsx IMAC cells as compared with 8-fold increases in control cells. The elevated expression of collagen 2a1, Indian hedgehog, and VEGF in Hdac3-CKOOsx mice at early time points suggests accelerated hypertrophy. Whereas rapid down-regulation of collagen 2a1 and Indian hedgehog and reduced levels of matrix genes indicates that Hdac3 is crucial for matrix production and chondrocyte hypertrophy. Reduced VEGF in differentiated chondrocytes may decrease coupling to ossification, thus leading to the expanded hypertrophic zone, more collagen X expression, and decreased bone mass observed in the Hdac3-CKOOsx mice (19).
Hdac3 Regulates Akt Signaling in Hypertrophic Chondrocytes
Associated with changes in matrix deposition, the columnar structure of growth plate chondrocytes was disrupted in P1 Hdac3-CKOOsx mice (Fig. 2A). Proliferative and hypertrophic chondrocytes remained disorganized in 5-week-old Hdac3-CKOOsx long bones (Fig. 4, A–C). This was measured by calculating the average angle between the centers of three adjacent columnar chondrocytes. Thus, the chondrocytes of WT mice were highly organized, with the average angle between cells being 165°. In contrast, adjacent Hdac3-CKOOsx chondrocytes were more difficult to identify, and the average angle between 50 trios of cells was reduced to 155° (Fig. 4B). In addition to being more disorganized, the average perimeter of the hypertrophic chondrocytes within the growth plate of Hdac3-CKOOsx mice was significantly smaller as compared with WT and Osx1-Cre mice (Fig. 4D).
FIGURE 4.

Hdac3 regulates chondrocyte cell size. A and B, distal femurs from 5-week-old Cre-negative (Hdac3fl/+;WT Cre−), Cre-positive (Osx-Cre+:Hdac3+/+;WT Cre+), and Osx-driven CKO (Osx-Cre+:Hdac3fl/fl; Hdac3-CKOOsx) mice were stained with Goldner's Trichrome (A) or Alcian blue (B). C, the angles between three adjacent columnar chondrocytes were assessed using ImageJ software. Representative tracings from >50 are shown in A. D, the average hypertrophic chondrocyte cell perimeter (n = 200) was determined using ImageJ software. *, p < 0.05 compared with WT.
The combined observations of smaller chondrocytes and reduced matrix deposition both in vivo and ex vivo suggested that Hdac3 deficiency suppresses growth factor signaling pathways as well as general protein translation. Akt was identified as a candidate effector of these chondrogenic phenotypes because it is activated by insulin and stimulates mTOR, which phosphorylates ribosomal subunits and stimulates CAP-dependent translation to control cell size and matrix synthesis (32–36). Hdac3-CKOOsx IMAC cultures had reduced levels of p-Ser-473 Akt, as well as p-Ser-2448 mTOR, an Akt substrate (Fig. 5, A and B). Furthermore, phosphorylation of the mTOR substrate p70 S6K, the kinase required for the S6 ribosomal subunit, was decreased. In contrast, Erk phosphorylation was not altered in Hdac3-CKOOsx cells. These data demonstrate that Akt signaling cascades are suppressed in Hdac3-CKOOsx chondrocytes.
FIGURE 5.

Hdac3 regulates activation of the Akt/mTOR pathway. A and B, WT or Hdac3-CKOOsx IMAC cells were placed in micromass culture to simulate chondrocyte differentiation toward hypertrophy. A, Western blotting for the indicated proteins was performed on day 10 of micromass cultures. B, phosphorylation of Ser-473 Akt was normalized to total Akt, and the average percentage change in Akt activation was determined. C, relative expression levels of Phlpp1 were determined by real-time PCR. D, paraffin-embedded sections of tibias from 4-week-old WT or Hdac3-CKOOsx mice were incubated with an IgG isotype control antibody or an anti-Phlpp1 antibody.
Hdac3 Represses Phlpp1 Expression
We hypothesized that reductions in Hdac3, a nuclear co-repressor, were indirectly repressing the cytosolic Akt signaling pathway by increasing the transcription of a protein phosphatase. In a candidate screening approach, the Akt phosphatase, Phlpp1, was found to be highly elevated in Hdac3-CKOOsx IMACs (Fig. 5, A and C). The inverse relationship between Phlpp1 and Hdac3 expression was confirmed in vivo. Thus, Phlpp1 levels were increased in the prehypertrophic zone of Hdac3-CKOOsx tibial growth plates (Fig. 5D). This temporal and spatial expression pattern of Phlpp1 was inversely correlated with Hdac3 expression in the prehypertrophic zone of WT mice (Fig. 1D). Together, these data suggest that Hdac3 represses Phlpp1 to facilitate Akt signaling in chondrocytes and growth plate development.
To determine whether Hdac3 associates with the Phlpp1 promoter, chromatin immunoprecipitation assays were performed in ATDC5 cells (Fig. 6A). Hdac3 bound to a previously characterized region of the Phlpp1 promoter that contains a Smad binding element, but not to distal regions lacking Smad binding sites (37). TGFβ, a potent inducer of chondrogenesis and Smad2/3 nuclear localization and DNA binding, released Hdac3 from the Phlpp1 promoter within 4 h (Fig. 6A). TGFβ also increased Phlpp1 but not Phlpp2 transcripts in ATDC5 cells (Fig. 6B). These data demonstrate that Hdac3 associates with the Phlpp1 gene.
FIGURE 6.
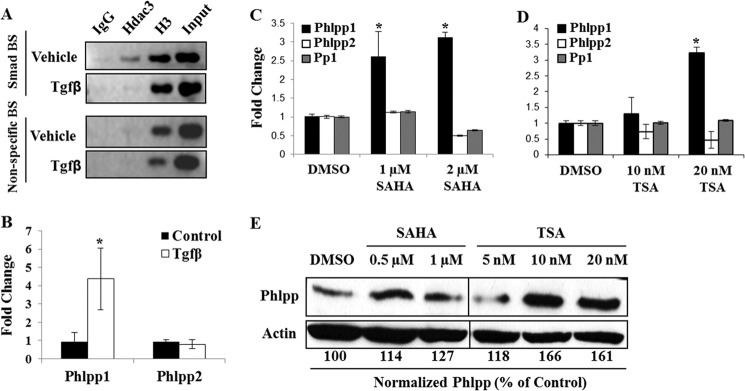
HDAC inhibition represses transcription of Phlpp1. A, chromatin immunoprecipitation for Hdac3 or histone 3 (H3) at the Phlpp1 promoter was performed in ATDC5 cells treated with TGFβ or vehicle for 4 h. B, ATDC5 cells were treated with TGFβ or control for 24 h. Relative expression levels of Phlpp1 and Phlpp2 transcripts were determined by real-time PCR. C–E, ATDC5 cells were treated with the indicated concentrations of SAHA or trichostatin A (TSA) or with DMSO (solvent control) for 24 h. C and D, relative expression of Phlpp1, Phlpp2, and Pp1 was determined by real-time PCR. E, PHLPP and actin expression levels were determined by Western blotting and quantified with ImageJ software. PHLPP levels were normalized to actin and calculated as a percent of the DMSO control.
HDAC Inhibitors Increase Phlpp1 Transcription and Suppress Akt Activity
To further test the molecular regulation of Phlpp1 by HDACs, the chondrogenic cell line, ATDC5, was treated with broad-acting HDAC inhibitors, SAHA or TSA, which inhibit all class I HDACs, including Hdac3. As in the Hdac3-CKOOsx IMACs, Phlpp1 but not Phlpp2 or protein phosphatase (Pp)1 mRNA expression was elevated after exposure to the HDAC inhibitors (Fig. 6, C and D). Phlpp1 protein levels were also elevated in HDAC inhibitor-treated cells (Fig. 6E).
To determine whether Phlpp1 directly regulates Akt activity in chondrocytes, we overexpressed a HA-tagged mutant Phlpp1 construct (Phlpp1ΔC, Fig. 7A) that inhibits the interaction between Phlpp1 and Akt (28) in ATDC5 cells and treated the cells with SAHA. Increased acetylation of histone 3 (H3) on K9/K14 (Fig. 7B) confirmed that HDACs were inhibited in SAHA-exposed cells. Similar to what was observed after Hdac3 depletion, SAHA decreased the phosphorylation of Akt and increased Phlpp1 levels. Phlpp1ΔC prevented the HDAC inhibitor-mediated decrease in Ser473 Akt phosphorylation (Fig. 7B). Together, these data demonstrate that HDACs, particularly Hdac3, control Akt activity by regulating Phlpp1 levels in prehypertrophic chondrocytes.
FIGURE 7.

Restoring Akt activity rescues the effects of HDAC inhibition. A, the Phlpp1 wild type and ΔC forms. The pleckstrin homology domain (PH), leucine rich repeats (LRR), phosphatase inhibitor insensitive enzymatic domain (PP2C) and the PZD binding motif required for Akt interaction (PZD; the ΔC form lacks this domain) are noted. B, ATDC5 cells were transfected with the Phlpp1ΔC construct or vector control and Western blotting for the indicated proteins was performed. C–G, ATDC5 cells were transfected with caAkt or vector control and then treated with DMSO or 1 μm SAHA for 24 h. C, Western blotting for the indicated proteins was performed. D, transfected cells were placed into micromass culture to simulate chondrocyte differentiation and incubated with SAHA or DMSO. Cultures were fixed and stained with Alcian blue or harvested for total RNA at day 7. Relative expression of matrix genes, including aggrecan (E), osteopontin (F), and MEPE (G), was determined by real-time PCR. *, p < 0.05 compared with DMSO-treated, vector transfected cells.
Constitutive activation of Akt restores defects in chondrocyte differentiation caused by HDAC suppression
To confirm that defects in Akt phosphorylation and activity were responsible for phenotypes of HDAC-suppressed cells, we overexpressed a HA-tagged, constitutively active Akt (caAkt) in chondrogenic ATDC5 cells and treated the cells with SAHA, which increased H3 K9/K14 acetylation (Fig. 7C). SAHA decreased the phosphorylation of the Akt substrate, mTOR, and its substrate, p70 S6K. Expression of HA-caAkt rescued their phosphorylation levels. Furthermore, HA-caAkt rescued the loss of Alcian blue staining in SAHA-treated micromass cultures (Fig. 7D) and restored the expression of matrix genes, including aggrecan, osteopontin, and MEPE in SAHA-treated and control cells (Fig. 7, E–G). These data demonstrate that Akt signaling cascades are repressed in HDAC-suppressed chondrocytes.
DISCUSSION
HDACs are essential for tissue development and regeneration because they control gene expression and signaling events involved in cell cycle control, hypertrophy, and survival. Small molecule HDAC inhibitors are effective cancer therapies because of their ability to slow cell cycle progression, induce DNA damage and apoptosis, and stimulate re-expression of silenced tumor suppressor genes (38). In preclinical studies, HDAC inhibitors slowed progression of experimental arthritis and associated inflammation (39–41). Thus, HDAC-mediated regulation of chondrocyte differentiation during normal tissue homeostasis and disease progression is of interest. Many HDACs contribute to cartilage biology (42). Unfortunately, most existing HDAC inhibitors suppress multiple enzymes and can have nonspecific effects. Therefore, there is a great need to understand the roles of individual HDACs in chondrogenesis, chondrocyte proliferation, and hypertrophy so that HDAC inhibitors can be appropriately applied. We previously established a role for Hdac3 in governing bone formation (19). In this study, the function of Hdac3 during chondrocyte differentiation was further explored in this Hdac3-CKOOsx mouse model. The data demonstrate that Hdac3 plays a crucial role in promoting Akt-dependent signaling and chondrocyte hypertrophy.
Hdac3 is highly expressed in developing articular cartilage, the meniscus, mineralized bone, and resting cells of the growth plate and epiphysis. Surprisingly, Hdac3 was spatially restricted within the active growth plate, with high expression in prehypertrophic chondrocytes and lower levels in the surrounding proliferating and hypertrophic chondrocytes. This expression pattern partially overlaps with that of Hdac4, which is also required for proper endochondral ossification and was shown to bind Hdac3 (20). Unlike Hdac3, Hdac4 expression is maintained in hypertrophic chondrocytes (20). In many tissues, Hdac3 is required for the enzymatic activity of the Hdac4-containing multi-protein complexes (43). One of the important findings of this study is that Hdac3 deletion suppresses Akt signaling by increasing Phlpp1 expression only in prehypertrophic cells. The effect of Hdac4 deletion on Akt activity in cartilage has not been reported.
Overall bone length was reduced in Hdac3-CKOOsx mice but was accompanied by a relative expansion of the hypertrophic zone (19). Potential explanations for this phenotype include decreased hypertrophic chondrocyte apoptosis, reduced vasculogenesis and coupling to subsequent ossification, reduced expression of genes involved in hypertrophic zone turnover, and/or by accelerated chondrocyte hypertrophy. Chondrocyte apoptosis, parathyroid hormone related protein (PTHrP), and matrix metalloproteinase gene expression were not changed in Hdac3-CKOOsx cells (data not shown); however, VEGF expression was reduced. Decreased VEGF expression could partially explain the expansion of the hypertrophic zone and reduced bone deposition observed with conditional deletion of Hdac3 (19).
In addition to accelerating chondrocyte hypertrophy, Hdac3 deficiency decreased chondrocyte cell size, reduced glycosaminoglycan staining, and produced a disordered columnar array of chondrocytes within the growth plate. The expression of several matrix genes (MEPE, osteopontin, and aggrecan) was also reduced in Hdac3-CKOOsx cells; however, it is possible that increased diffusion or degradation of matrix components also contributes to decreased matrix staining. These phenotypes are characteristic of Akt-signaling deficits. Indeed, we observed striking reductions in phosphorylated Akt and its downstream substrates, mTOR and p70 S6K. The effects of Hdac3-deficiency mimic the effects of the mTOR inhibitor rapamycin on chondrocyte hypertrophy and glycosaminoglycan production (44–47). Akt-mediated phosphorylation of mTOR and its substrate p70 S6K positively regulates proliferation, differentiation, and matrix deposition; therefore, reduced phosphorylation of these proteins likely contributes to the phenotypes of Hdac3-deficient cells. It is possible that increased diffusion or degradation of matrix components also contributes to decreased matrix staining. Together, these data demonstrate that Hdac3 controls the central signaling pathways downstream of Akt required during chondrocyte differentiation (Fig. 8).
FIGURE 8.
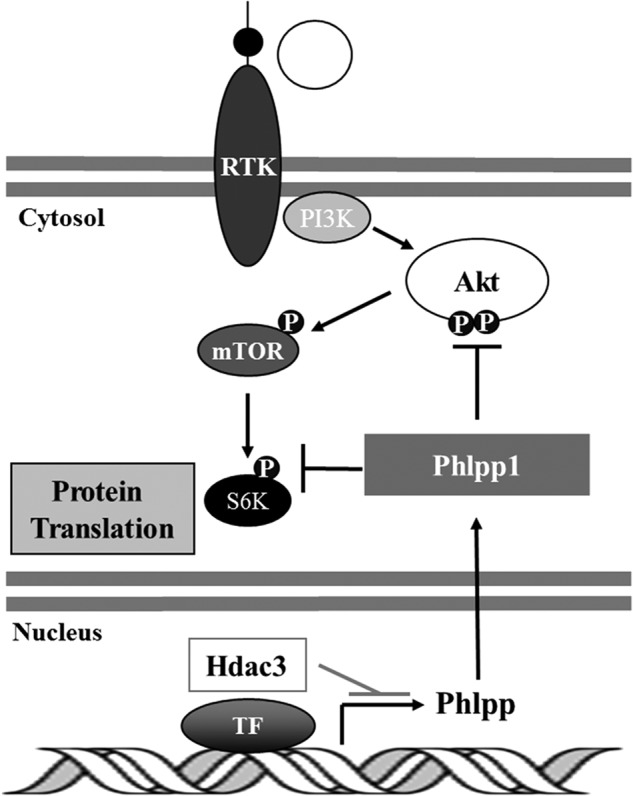
Summary of the effects of Hdac3 on chondrocyte differentiation. Hdac3 represses Phlpp1 transcription to facilitate Akt phosphorylation and activity on downstream effectors, mTOR and p70 SK6, which promotes protein translation. In the absence of Hdac3, Phlpp1 levels rise to dephosphorylate Akt as well as S6K. Although mTOR is not a direct substrate of Phlpp1, its phosphorylation levels decrease because Akt activity is suppressed when Phlpp1 is present. Filled circles represent an active phosphorylation (P) state. RTK, receptor tyrosine kinase; TF, transcription factor.
The profound suppression of Akt, a kinase predominantly associated with the plasma membrane, in chondrocytes deficient in a nuclear co-repressor Hdac3, suggested an indirect mechanism of regulation. One possibility was that Hdac3 increases the levels or activities of a protein phosphatase to restrict Akt activity. There are several reports of other HDACs promoting Akt kinase activity through this mechanism. For example, Hdac2 suppresses expression of the PI3K protein phosphatase, Inpp5f, in cardiomyocytes and prevents Akt activation by PI3K (48). In other studies, Hdac1 and Hdac6 bound PP1 and prevented its association with Akt in human glioblastoma U87MG cells (49). Hdac3 did not bind PP1 in that cell line (49) but did in diffuse large B-cell lymphoma cells to suppress Akt phosphorylation (50, 51). We did not detect a change in PP1 levels or nuclear localization in the Hdac3-CKOOsx chondrocytes. Protein and mRNA levels of Phlpp1, but not Phlpp2 were increased in Hdac3-CKOOsx prehypertrophic chondrocytes and IMAC cultures derived from these mice. Furthermore, Hdac3 localized to the Phlpp1 promoter in TGFβ-regulated manner. In preliminary studies with HDAC-inhibited osteoblasts, we also observed reduced phosphorylation of Akt but did not detect increased Phlpp1/2 levels, suggesting a different molecular mechanism is active in osteoblasts than in chondrocytes. We hypothesize that Hdac3 directly represses Phlpp1 expression in chondrocytes by binding to transcription factors (e.g. Smad2/3 and/or co-repressors (e.g. Hdac4 or Ski/Sno). The Phlpp1 promoter has not yet been cloned or studied in depth, so additional experiments are needed to identify the exact molecular mechanism(s) by which Hdac3 regulates Phlpp1 mRNA and protein levels in chondrocytes. Together, our data add to the accumulating evidence that HDAC repression of protein phosphatases may be a general means by which cells are primed for Akt pathway activation.
Conditionally deleting Hdac3 with Osx1-Cre ensured deletion of Hdac3 as early as embryonic day 14.5 (24) and allowed us to determine the effects of Hdac3 deficiency at all subsequent stages of endochondral ossification. Limitations of this model are that osterix is not chondrocyte-specific and it does not address the temporal effects of Hdac3. Osx (Sp7) is expressed by mesenchymal progenitors that give rise to both osteoblasts and chondrocytes (52, 53). Proliferating growth plate chondrocytes express osterix, as do a few hypertrophic chondrocytes and most osteoblasts (52–54). Thus, we cannot conclude with certainty that the in vivo effects of Hdac3 deletion on growth plate cartilage are exclusively caused by chondrocyte defects and that osteoblast-derived signals do not contribute; however, our ex vivo data from primary articular chondrocytes indicate a cell autonomous effect. Moreover, we recently showed that deletion of Hdac3 in committed osteoblasts with osteocalcin-Cre does not affect Hdac3 expression in the growth plate and produces normal long bones (55). Ongoing studies are addressing the effects of Hdac3 on Akt signaling pathways using cartilage-specific Cre drivers.
In summary, Hdac3 is expressed in developing bone and cartilage. Hdac3 deficiency accelerates the hypertrophy gene expression program but also reduces matrix production and decreases chondrocyte cell size. Hdac3-CKOOsx chondrocytes also express higher Phlpp1 levels and lower Akt activity. Moreover, downstream regulation of the Akt targets such as mTOR facilitates the specific effects on chondrocyte hypertrophy. These data demonstrate in importance of Hdac3 in promoting Akt signaling during chondrocyte differentiation.
Acknowledgments
We thank Xiaodong Li, David Razidlo and Bridget Stensgard for technical assistance and Meghan McGee-Lawrence for helpful discussions.
This work was supported by research and training grants from the National Institutes of Health (AR48147, AR61873, AR56950, and GM055252), Mayo Clinic, and the Mayo Graduate School.
- Phlpp1/2
- PH domain and leucine-rich repeat protein phosphatase
- IMAC
- immature mouse articular chondrocyte
- SAHA
- suberoylanilide hydroxamic acid
- BS
- binding site
- P1
- postnatal day 1
- MEPE
- matrix extracellular phosphoglycoprotein
- DMSO
- dimethyl sulfoxide.
REFERENCES
- 1. Akiyama H., Furukawa S., Wakisaka S., Maeda T. (2006) Cartducin stimulates mesenchymal chondroprogenitor cell proliferation through both extracellular signal-regulated kinase and phosphatidylinositol 3-kinase/Akt pathways. FEBS J. 273, 2257–2263 [DOI] [PubMed] [Google Scholar]
- 2. Jin E. J., Park K. S., Bang O. S., Kang S. S. (2007) Akt signaling regulates actin organization via modulation of MMP-2 activity during chondrogenesis of chick wing limb bud mesenchymal cells. J. Cell. Biochem. 102, 252–261 [DOI] [PubMed] [Google Scholar]
- 3. Rokutanda S., Fujita T., Kanatani N., Yoshida C. A., Komori H., Liu W., Mizuno A., Komori T. (2009) Akt regulates skeletal development through GSK3, mTOR, and FoxOs. Dev. Biol. 328, 78–93 [DOI] [PubMed] [Google Scholar]
- 4. Priore R., Dailey L., Basilico C. (2006) Downregulation of Akt activity contributes to the growth arrest induced by FGF in chondrocytes. J. Cell. Physiol. 207, 800–808 [DOI] [PubMed] [Google Scholar]
- 5. Fukai A., Kawamura N., Saito T., Oshima Y., Ikeda T., Kugimiya F., Higashikawa A., Yano F., Ogata N., Nakamura K., Chung U. I., Kawaguchi H. (2010) Akt1 in murine chondrocytes controls cartilage calcification during endochondral ossification under physiologic and pathologic conditions. Arthritis Rheum. 62, 826–836 [DOI] [PubMed] [Google Scholar]
- 6. Ikegami D., Akiyama H., Suzuki A., Nakamura T., Nakano T., Yoshikawa H., Tsumaki N. (2011) Sox9 sustains chondrocyte survival and hypertrophy in part through Pik3ca-Akt pathways. Development 138, 1507–1519 [DOI] [PubMed] [Google Scholar]
- 7. Price J., Zaidi A. K., Bohensky J., Srinivas V., Shapiro I. M., Ali H. (2010) Akt-1 mediates survival of chondrocytes from endoplasmic reticulum-induced stress. J. Cell. Physiol. 222, 502–508 [DOI] [PubMed] [Google Scholar]
- 8. Carver B. S., Chapinski C., Wongvipat J., Hieronymus H., Chen Y., Chandarlapaty S., Arora V. K., Le C., Koutcher J., Scher H., Scardino P. T., Rosen N., Sawyers C. L. (2011) Reciprocal feedback regulation of PI3K and androgen receptor signaling in PTEN-deficient prostate cancer. Cancer Cell 19, 575–586 [DOI] [PMC free article] [PubMed] [Google Scholar]
- 9. Liu J., Weiss H. L., Rychahou P., Jackson L. N., Evers B. M., Gao T. (2009) Loss of PHLPP expression in colon cancer: role in proliferation and tumorigenesis. Oncogene 28, 994–1004 [DOI] [PMC free article] [PubMed] [Google Scholar]
- 10. Mulholland D. J., Tran L. M., Li Y., Cai H., Morim A., Wang S., Plaisier S., Garraway I. P., Huang J., Graeber T. G., Wu H. (2011) Cell autonomous role of PTEN in regulating castration-resistant prostate cancer growth. Cancer Cell 19, 792–804 [DOI] [PMC free article] [PubMed] [Google Scholar]
- 11. Brognard J., Sierecki E., Gao T., Newton A. C. (2007) PHLPP and a second isoform, PHLPP2, differentially attenuate the amplitude of Akt signaling by regulating distinct Akt isoforms. Mol. Cell 25, 917–931 [DOI] [PubMed] [Google Scholar]
- 12. Masubuchi S., Gao T., O'Neill A., Eckel-Mahan K., Newton A. C., Sassone-Corsi P. (2010) Protein phosphatase PHLPP1 controls the light-induced resetting of the circadian clock. Proc. Natl. Acad. Sci. U.S.A. 107, 1642–1647 [DOI] [PMC free article] [PubMed] [Google Scholar]
- 13. McGee-Lawrence M. E., Westendorf J. J. (2011) Histone deacetylases in skeletal development and bone mass maintenance. Gene 474, 1–11 [DOI] [PMC free article] [PubMed] [Google Scholar]
- 14. Westendorf J. J. (2007) Histone deacetylases in control of skeletogenesis. J. Cell. Biochem. 102, 332–340 [DOI] [PubMed] [Google Scholar]
- 15. Bhaskara S., Chyla B. J., Amann J. M., Knutson S. K., Cortez D., Sun Z. W., Hiebert S. W. (2008) Deletion of histone deacetylase 3 reveals critical roles in S phase progression and DNA damage control. Mol. Cell 30, 61–72 [DOI] [PMC free article] [PubMed] [Google Scholar]
- 16. Montgomery R. L., Potthoff M. J., Haberland M., Qi X., Matsuzaki S., Humphries K. M., Richardson J. A., Bassel-Duby R., Olson E. N. (2008) Maintenance of cardiac energy metabolism by histone deacetylase 3 in mice. J. Clin. Invest. 118, 3588–3597 [DOI] [PMC free article] [PubMed] [Google Scholar]
- 17. Sun Z., Singh N., Mullican S. E., Everett L. J., Li L., Yuan L., Liu X., Epstein J. A., Lazar M. A. (2011) Diet-induced lethality due to deletion of the Hdac3 gene in heart and skeletal muscle. J. Biol. Chem. 286, 33301–33309 [DOI] [PMC free article] [PubMed] [Google Scholar]
- 18. Knutson S. K., Chyla B. J., Amann J. M., Bhaskara S., Huppert S. S., Hiebert S. W. (2008) Liver-specific deletion of histone deacetylase 3 disrupts metabolic transcriptional networks. EMBO J. 27, 1017–1028 [DOI] [PMC free article] [PubMed] [Google Scholar]
- 19. Razidlo D. F., Whitney T. J., Casper M. E., McGee-Lawrence M. E., Stensgard B. A., Li X., Secreto F. J., Knutson S. K., Hiebert S. W., Westendorf J. J. (2010) Histone deacetylase 3 depletion in osteo/chondroprogenitor cells decreases bone density and increases marrow fat. PloS One 5, e11492. [DOI] [PMC free article] [PubMed] [Google Scholar]
- 20. Vega R. B., Matsuda K., Oh J., Barbosa A. C., Yang X., Meadows E., McAnally J., Pomajzl C., Shelton J. M., Richardson J. A., Karsenty G., Olson E. N. (2004) Histone deacetylase 4 controls chondrocyte hypertrophy during skeletogenesis. Cell 119, 555–566 [DOI] [PubMed] [Google Scholar]
- 21. Correa D., Hesse E., Seriwatanachai D., Kiviranta R., Saito H., Yamana K., Neff L., Atfi A., Coillard L., Sitara D., Maeda Y., Warming S., Jenkins N. A., Copeland N. G., Horne W. C., Lanske B., Baron R. (2010) Zfp521 is a target gene and key effector of parathyroid hormone-related peptide signaling in growth plate chondrocytes. Dev. Cell 19, 533–546 [DOI] [PMC free article] [PubMed] [Google Scholar]
- 22. Zeng L., Kempf H., Murtaugh L. C., Sato M. E., Lassar A. B. (2002) Shh establishes an Nkx3.2/Sox9 autoregulatory loop that is maintained by BMP signals to induce somitic chondrogenesis. Genes Dev. 16, 1990–2005 [DOI] [PMC free article] [PubMed] [Google Scholar]
- 23. Lemon D. D., Horn T. R., Cavasin M. A., Jeong M. Y., Haubold K. W., Long C. S., Irwin D. C., McCune S. A., Chung E., Leinwand L. A., McKinsey T. A. (2011) Cardiac HDAC6 catalytic activity is induced in response to chronic hypertension. J. Mol. Cell Cardiol. 51, 41–50 [DOI] [PMC free article] [PubMed] [Google Scholar]
- 24. Rodda S. J., McMahon A. P. (2006) Distinct roles for Hedgehog and canonical Wnt signaling in specification, differentiation and maintenance of osteoblast progenitors. Development 133, 3231–3244 [DOI] [PubMed] [Google Scholar]
- 25. Gosset M., Berenbaum F., Thirion S., Jacques C. (2008) Primary culture and phenotyping of murine chondrocytes. Nat. Protoc. 3, 1253–1260 [DOI] [PubMed] [Google Scholar]
- 26. Soung do Y., Dong Y., Wang Y., Zuscik M. J., Schwarz E. M., O'Keefe R. J., Drissi H. (2007) Runx3/AML2/Cbfa3 regulates early and late chondrocyte differentiation. J. Bone Miner. Res. 22, 1260–1270 [DOI] [PubMed] [Google Scholar]
- 27. Bradley E. W., Drissi M. H. (2010) WNT5A regulates chondrocyte differentiation through differential use of the CaN/NFAT and IKK/NF-κB pathways. Mol. Endocrinol. 24, 1581–1593 [DOI] [PMC free article] [PubMed] [Google Scholar]
- 28. Gao T., Furnari F., Newton A. C. (2005) PHLPP: a phosphatase that directly dephosphorylates Akt, promotes apoptosis, and suppresses tumor growth. Mol. Cell 18, 13–24 [DOI] [PubMed] [Google Scholar]
- 29. Zhang H., Pan Y., Zheng L., Choe C., Lindgren B., Jensen E. D., Westendorf J. J., Cheng L., Huang H. (2011) FOXO1 inhibits Runx2 transcriptional activity and prostate cancer cell migration and invasion. Cancer Res. 71, 3257–3267 [DOI] [PMC free article] [PubMed] [Google Scholar]
- 30. Lambert J. R., Nordeen S. K. (2001) Analysis of steroid hormone-induced histone acetylation by chromatin immunoprecipitation assay. Methods Mol. Biol. 176, 273–281 [DOI] [PubMed] [Google Scholar]
- 31. Karp S. J., Schipani E., St-Jacques B., Hunzelman J., Kronenberg H., McMahon A. P. (2000) Indian hedgehog coordinates endochondral bone growth and morphogenesis via parathyroid hormone related-protein-dependent and -independent pathways. Development 127, 543–548 [DOI] [PubMed] [Google Scholar]
- 32. Pullen N., Thomas G. (1997) The modular phosphorylation and activation of p70s6k. FEBS Lett. 410, 78–82 [DOI] [PubMed] [Google Scholar]
- 33. Fang Y., Vilella-Bach M., Bachmann R., Flanigan A., Chen J. (2001) Phosphatidic acid-mediated mitogenic activation of mTOR signaling. Science 294, 1942–1945 [DOI] [PubMed] [Google Scholar]
- 34. Sabers C. J., Martin M. M., Brunn G. J., Williams J. M., Dumont F. J., Wiederrecht G., Abraham R. T. (1995) Isolation of a protein target of the FKBP12-rapamycin complex in mammalian cells. J. Biol. Chem. 270, 815–822 [DOI] [PubMed] [Google Scholar]
- 35. Brown E. J., Albers M. W., Shin T. B., Ichikawa K., Keith C. T., Lane W. S., Schreiber S. L. (1994) A mammalian protein targeted by G1-arresting rapamycin-receptor complex. Nature 369, 756–758 [DOI] [PubMed] [Google Scholar]
- 36. Navé B. T., Ouwens M., Withers D. J., Alessi D. R., Shepherd P. R. (1999) Mammalian target of rapamycin is a direct target for protein kinase B: identification of a convergence point for opposing effects of insulin and amino-acid deficiency on protein translation. Biochem. J. 344, 427–431 [PMC free article] [PubMed] [Google Scholar]
- 37. Patterson S. J., Han J. M., Garcia R., Assi K., Gao T., O'Neill A., Newton A. C., Levings M. K. (2011) Cutting edge: PHLPP regulates the development, function, and molecular signaling pathways of regulatory T cells. J. Immunol. 186, 5533–5537 [DOI] [PMC free article] [PubMed] [Google Scholar]
- 38. Haberland M., Montgomery R. L., Olson E. N. (2009) The many roles of histone deacetylases in development and physiology: implications for disease and therapy. Nat. Rev. Genet. 10, 32–42 [DOI] [PMC free article] [PubMed] [Google Scholar]
- 39. Chen W. P., Bao J. P., Hu P. F., Feng J., Wu L. D. (2010) Alleviation of osteoarthritis by Trichostatin A, a histone deacetylase inhibitor, in experimental osteoarthritis. Mol. Biol. Rep. 37, 3967–3972 [DOI] [PubMed] [Google Scholar]
- 40. Joosten L. A., Leoni F., Meghji S., Mascagni P. (2011) Inhibition of HDAC activity by ITF2357 ameliorates joint inflammation and prevents cartilage and bone destruction in experimental arthritis. Mol. Med. 17, 391–396 [DOI] [PMC free article] [PubMed] [Google Scholar]
- 41. Nasu Y., Nishida K., Miyazawa S., Komiyama T., Kadota Y., Abe N., Yoshida A., Hirohata S., Ohtsuka A., Ozaki T. (2008) Trichostatin A, a histone deacetylase inhibitor, suppresses synovial inflammation and subsequent cartilage destruction in a collagen antibody-induced arthritis mouse model. Osteoarthritis Cartilage 16, 723–732 [DOI] [PubMed] [Google Scholar]
- 42. Bradley E. W., McGee-Lawrence M. E., Westendorf J. J. (2011) Hdac-mediated control of endochondral and intramembranous ossification. Crit. Rev. Eukaryot. Gene Expr. 21, 101–113 [DOI] [PMC free article] [PubMed] [Google Scholar]
- 43. Fischle W., Dequiedt F., Hendzel M. J., Guenther M. G., Lazar M. A., Voelter W., Verdin E. (2002) Enzymatic activity associated with class II HDACs is dependent on a multiprotein complex containing HDAC3 and SMRT/N-CoR. Mol. Cell 9, 45–57 [DOI] [PubMed] [Google Scholar]
- 44. Alvarez-Garcia O., Carbajo-Pérez E., Garcia E., Gil H., Molinos I., Rodriguez J., Ordoñez F. A., Santos F. (2007) Rapamycin retards growth and causes marked alterations in the growth plate of young rats. Pediatr. Nephrol. 22, 954–961 [DOI] [PMC free article] [PubMed] [Google Scholar]
- 45. Oh C. D., Kim S. J., Ju J. W., Song W. K., Kim J. H., Yoo Y. J., Chun J. S. (2001) Immunosuppressant rapamycin inhibits protein kinase C α and p38 mitogen-activated protein kinase leading to the inhibition of chondrogenesis. Eur. J. Pharmacol. 427, 175–185 [DOI] [PubMed] [Google Scholar]
- 46. Phornphutkul C., Wu K. Y., Auyeung V., Chen Q., Gruppuso P. A. (2008) mTOR signaling contributes to chondrocyte differentiation. Dev. Dyn. 237, 702–712 [DOI] [PMC free article] [PubMed] [Google Scholar]
- 47. Starkman B. G., Cravero J. D., Delcarlo M., Loeser R. F. (2005) IGF-I stimulation of proteoglycan synthesis by chondrocytes requires activation of the PI 3-kinase pathway but not ERK MAPK. Biochem. J. 389, 723–729 [DOI] [PMC free article] [PubMed] [Google Scholar]
- 48. Trivedi C. M., Luo Y., Yin Z., Zhang M., Zhu W., Wang T., Floss T., Goettlicher M., Noppinger P. R., Wurst W., Ferrari V. A., Abrams C. S., Gruber P. J., Epstein J. A. (2007) Hdac2 regulates the cardiac hypertrophic response by modulating Gsk3 β activity. Nat. Med. 13, 324–331 [DOI] [PubMed] [Google Scholar]
- 49. Chen C. S., Weng S. C., Tseng P. H., Lin H. P. (2005) Histone acetylation-independent effect of histone deacetylase inhibitors on Akt through the reshuffling of protein phosphatase 1 complexes. J. Biol. Chem. 280, 38879–38887 [DOI] [PubMed] [Google Scholar]
- 50. Gupta M., Ansell S. M., Novak A. J., Kumar S., Kaufmann S. H., Witzig T. E. (2009) Inhibition of histone deacetylase overcomes rapamycin-mediated resistance in diffuse large B-cell lymphoma by inhibiting Akt signaling through mTORC2. Blood 114, 2926–2935 [DOI] [PMC free article] [PubMed] [Google Scholar]
- 51. Martin M., Potente M., Janssens V., Vertommen D., Twizere J. C., Rider M. H., Goris J., Dimmeler S., Kettmann R., Dequiedt F. (2008) Protein phosphatase 2A controls the activity of histone deacetylase 7 during T cell apoptosis and angiogenesis. Proc. Natl. Acad. Sci. U.S.A. 105, 4727–4732 [DOI] [PMC free article] [PubMed] [Google Scholar]
- 52. Kaback L. A., Soung do Y., Naik A., Smith N., Schwarz E. M., O'Keefe R. J., Drissi H. (2008) Osterix/Sp7 regulates mesenchymal stem cell mediated endochondral ossification. J. Cell. Physiol. 214, 173–182 [DOI] [PubMed] [Google Scholar]
- 53. Nakashima K., Zhou X., Kunkel G., Zhang Z., Deng J. M., Behringer R. R., de Crombrugghe B. (2002) The novel zinc finger-containing transcription factor osterix is required for osteoblast differentiation and bone formation. Cell 108, 17–29 [DOI] [PubMed] [Google Scholar]
- 54. Xiong J., Onal M., Jilka R. L., Weinstein R. S., Manolagas S. C., O'Brien C. A. (2011) Matrix-embedded cells control osteoclast formation. Nat. Med. 17, 1235–1241 [DOI] [PMC free article] [PubMed] [Google Scholar]
- 55. McGee-Lawrence M. E., Bradley E. W., Dudakovic A., Carlson S. W., Ryan Z. C., Kumar R., Dadsetan M., Yaszemski M. J., Chen Q., An K. N., Westendorf J. J. (2013) Histone deacetylase 3 is required for maintenance of bone mass during aging. Bone 52, 296–307 [DOI] [PMC free article] [PubMed] [Google Scholar]