

Abstract
Determining which glycan moieties occupy specific N-glycosylation sites is a highly challenging analytical task. Arguably, the most common approach involves LC-MS and LC-MS/MS analysis of glycopeptides generated by proteases with high cleavage site specificity; however, the depth achieved by this approach is modest. Nonglycosylated peptides are a major challenge to glycoproteomics, as they are preferentially selected for data-dependent MS/MS due to higher ionization efficiencies and higher stoichiometric levels in moderately complex samples. With the goal of improving glycopeptide coverage, a mass defect classifier was developed that discriminates between peptides and glycopeptides in complex mixtures based on accurate mass measurements of precursor peaks. By using the classifier, glycopeptides that were not fragmented in an initial data-dependent acquisition run may be targeted in a subsequent analysis without any prior knowledge of the glycan or protein species present in the mixture. Additionally, from probable glycopeptides that were poorly fragmented, tandem mass spectra may be reacquired using optimal glycopeptide settings. We demonstrate high sensitivity (0.892) and specificity (0.947) based on an in silico dataset spanning >100,000 tryptic entries. Comparable results were obtained using chymotryptic species. Further validation using published data and a fractionated tryptic digest of human urinary proteins was performed, yielding a sensitivity of 0.90 and a specificity of 0.93. Lists of glycopeptides may be generated from an initial proteomics experiment, and we show they may be efficiently targeted using the classifier. Considering the growing availability of high accuracy mass analyzers, this approach represents a simple and broadly applicable means of increasing the depth of MS/MS-based glycoproteomic analyses.
N-Glycosylation is an important post-translational modification that affects cell-cell signaling and protein stability, and it has been implicated in various pathologies (1). Protein N-glycosylation is difficult to characterize, due to heterogeneity at the levels of glycosylation site occupancy, glycan composition, and glycan structure. A truly comprehensive analysis of protein glycosylation identifies glycans, maps occupied sites, and matches the glycans to specific sites on glycoproteins (2). This site-specific analysis can be performed via analysis of intact glycopeptides using mass spectrometry (MS). However, this technique is complicated by sensitivity, sample preparation, and fragmentation challenges (3) that limit the throughput and depth of the results.
The analysis of site-specific glycosylation is complicated in part because the ionization of glycopeptides is suppressed by any nonglycosylated peptides that are coproduced during protease digestion with specific proteases. Alternatively, digestion using nonspecific proteases has been implemented to eliminate competing peptide species (4, 5). Notably, specific proteases yield highly predictable peptide footprints and have been utilized for analysis of complex mixtures. However, as noted in a recent publication, glycopeptides are often not selected for fragmentation in data-dependent analysis (DDA)1 (6), making glycopeptide identification impossible, as fragmentation is required for glycopeptide identification in nontrivial samples (7). To circumvent this issue, glycopeptide enrichment protocols using normal-phase hydrophilic interaction chromatography or lectin enrichment techniques have been established to enrich for glycopeptides (8). Although highly valuable, these purification approaches have varying specificities for glycopeptides, may preferentially isolate glycopeptides with certain types of glycans attached, and add additional sample handling steps.
Because of these challenges, a classifier capable of quickly discriminating between peptide and glycopeptide signals in mass spectrometry would be valuable and may significantly complement existing purification techniques. Fragment ions have been found that are specific to glycopeptides (9, 10); however, these are not useful if the glycopeptides were not selected for fragmentation or if they yielded low quality MS/MS spectra. As mass defect (MD) classifications have been applied to similar challenges in proteomics (11–13), we investigated whether an MD classification would be useful for discriminating between peptides and glycopeptides.
Notably, a lowering of the MD has been observed for glycopeptides, because of the relative increase of oxygen (and its negative MD value) in glycopeptides (14). However, this original observation was made through comparison of tryptic peptides and small glycopeptides generated by nonspecific proteolysis. Since that original work, no systematic studies have been performed to maximize the analytical utility of this MD shift or to determine the true- and false-positive rates of such a classifier based on accurate mass measurements. Furthermore, no studies have determined whether the MD shift holds for peptides and glycopeptides generated by the same protease, a more pertinent comparison given typical sample preparation protocols.
In this study, we have determined these glycopeptide-rich acquisition enhancement zones (GRAEZs) and validated their utility in identifying useful precursor m/z values for large scale glycopeptide assignment by tandem MS. This classification may be applied to identify likely N-glycopeptides without parallel proteomic or glycomic experiments and without any prior knowledge of the proteome or glycome present in a mixture. Targeted MS studies of species within the GRAEZ will increase selection of glycopeptides for fragmentation, leading to increased glycopeptide identification. This concept is presented schematically in Fig. 1. We further demonstrate the efficacy of GRAEZ classification by validating LC-MS/MS data from urinary proteomics analysis.
Fig. 1.
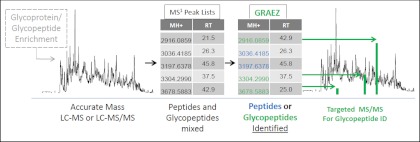
Overview of mass defect classification of glycopeptides. Optional, initial glycopeptide enrichment is followed by LC-MS or LC-MS/MS analysis. After peak picking and deconvolution, a list of monoisotopic m/z values and retention times is generated. This list is then sorted into likely glycopeptide and likely peptide precursors on the basis of accurate mass. Targeted LC-MS/MS analysis is then possible without prior proteomic or glycomic characterization.
MATERIALS AND METHODS
The GRAEZ MD settings were determined using an in silico training dataset and evaluated using an in silico test dataset of peptides and glycopeptides. Training and test sets were generated from the HUPO plasma proteome database, which may be accessed on line. Entries were re-mapped to SwissProt Identifiers. A total of 1797 unique entries were generated. Six hundred random protein entries were selected and digested in silico with either trypsin or chymotrypsin using MS-Digest to form the training sets. The remaining 1197 proteins were used to form the test set. One missed cleavage was permitted; cysteine residues were considered as their carbamidomethyl derivatives, and peptide output was restricted to >3 amino acids and 400–5000 daltons. This range was chosen to select peptide sizes that were typically amenable to analysis on most MS instrumentation. MS-Digest reported singly protonated m/z values for all peptides. Peptide output was imported into Microsoft Excel for data analysis.
Redundant peptide sequences were removed. Peptides containing potential N-glycosylation consensus site were identified by the presence of NXS or NXT sequences, where X is any amino acid except proline. Glycopeptides were then generated in silico by adding the monosaccharide masses of eight distinct N-glycan compositions to each consensus site peptide. The glycans utilized are shown in Table I and were chosen to represent common Homo sapiens N-glycans, without biasing the classifier for large N-linked glycans excessively. Because the MD shift is proportionally less for smaller N-glycans, a range of N-glycan masses was tested to challenge the classifier. Size distributions for tryptic and chymotryptic peptides are shown in supplemental Fig. 1.
Table I. Eight relevant N-glycans utilized to generate glycopeptides in silico.
Abbreviations used are as follows: Hex, hexose; HexNAc, N-acetylhexosamine; Fuc, deoxyhexose; SA, N-acetylneuraminic acid. Mass added is equal to the increase in the monoisotopic mass of peptides when N-glycan is added.
| N-Glycan ID | Hex | HexNAc | Fuc | SA | Mass added Da |
|---|---|---|---|---|---|
| Glycan 1 | 5 | 2 | 1216.4228 | ||
| Glycan 2 | 7 | 2 | 1540.5284 | ||
| Glycan 3 | 9 | 2 | 1864.634 | ||
| Glycan 4 | 5 | 4 | 1622.5816 | ||
| Glycan 5 | 5 | 4 | 2 | 1914.6974 | |
| Glycan 6 | 5 | 4 | 2 | 2204.7724 | |
| Glycan 7 | 6 | 5 | 2 | 2279.8296 | |
| Glycan 8 | 6 | 5 | 2 | 2569.9046 |
Peptides and glycopeptides were plotted on a mass defect map to identify initial trends in integer and defect mass for each species, and best-fit lines were generated for each class. Initial GRAEZ settings were set between the best-fit lines for each class, and the accuracy (or % of correct assignments) of the classifier was evaluated. The initial slope and intercept values were then optimized using an automated iterative process to maximize accuracy.
To retrospectively verify the in silico findings, a catheterized urine sample from a healthy male infant was obtained with an IRB-approved protocol and processed using a previously published sample preparation method for urinary proteomics (15). Briefly, urine was concentrated and desalted on 5K molecular weight cutoff spin filters (Sartorius). Proteins were reduced and alkylated in the spin filter, washed extensively with TEAB, and removed from the upper chamber before digestion with trypsin at a (w/w) ratio of 50:1 sample/enzyme overnight at 37°C. Peptides were labeled with TMT6-126 (Thermo Scientific) according to the manufacturer's instructions and purified with HLB cartridges (Oasis). Peptides were separated into 24 fractions using an Agilent OFFGEL isoelectric point fractionator for 50 kV-h, extracted, and dried.
Individual fractions were reconstituted in loading buffer and analyzed by LC-MS/MS using a Thermo Scientific QExactive MS system equipped with an eksigent two-dimensional nano-LC system, autosampler, and C18 column (15 cm length × 17 μm diameter). A “top 10” data-dependent LC-MS/MS method was utilized; resolution was set to 70 K for MS1 and 17.5 K for MS2 scans. A 60-min linear gradient from 5 to 35% ACN was used. Normalized collision energy was 30, and the AGC was set for 1e6 for MS1 and 5e4 for MS2 scans.
In addition to the retrospective GRAEZ evaluation, prospective GRAEZ testing was also performed. Tryptic peptides were generated as above using a urine sample donated by a healthy male adult. An initial DDA run was performed on the nonfractionated sample after cleanup. After acquisition, all MS1 features were extracted using MaxQuant (16) and evaluated for GRAEZ status. A list of 2325 unique precursors was generated, which were classified as glycopeptides by GRAEZ, and targeted in two subsequent LC-MS runs. Data were acquired with similar instrumental parameters, except the normalized collision energy was 29 and the AGC was set for 3e6 for MS1 and 1e5 for MS2 scans.
All MS2 spectra from the retrospective experiment were searched for the presence of two marker ions, the TMT reporter ion at 126.1277 daltons or the diagnostic Hex1HexNac1 oxonium ion at 366.1395. Prospective data were evaluated for the 366.1395 and 204.0867 ions. Rapid identification of the relevant precursor m/z and z values was achieved by the use of an in-house script that functioned as an add-in for the msconvert tool. The tool, mzPresent, filters all MS2 spectra for user-defined fragment ions and creates an mgf file and a comma separated value file as output that contains scan number, retention time, m/z selected for fragmentation, charge state of the precursor, and the intensity of the fragment ion. mzPresent has been incorporated into the proteowizard tool (17) for ease of use, and may use any arbitrary m/z value.
For this study, 10 ppm mass error was allowed, and a minimum of 25% relative intensity was required for the fragment ions. The precursor m/z and z values were used to calculate (M + H)+ values for GRAEZ classification, and these GRAEZ classifications were cross-referenced against the presence of the glycopeptide-specific ions in MS2 spectra to estimate the true-/false-positive rate ability of GRAEZ, as detailed below.
RESULTS AND DISCUSSION
Creating GRAEZ Settings and in Silico Evaluation
Because of the contribution of N-linked glycans, N-glycopeptides are larger in size than peptides, as shown by the histograms in supplemental Fig. 1. Based on the in silico data, all species below 1500 daltons may reasonably be excluded from targeted N-glycopeptide analysis with negligible loss in sensitivity. Approximately 49% of tryptic peptides and 43% of chymotryptic peptides were smaller than 1500 daltons. However, the in silico specificity measures listed below do not consider the elimination of these low mass species and therefore are quite conservative with regard to overall glycopeptide specificity.
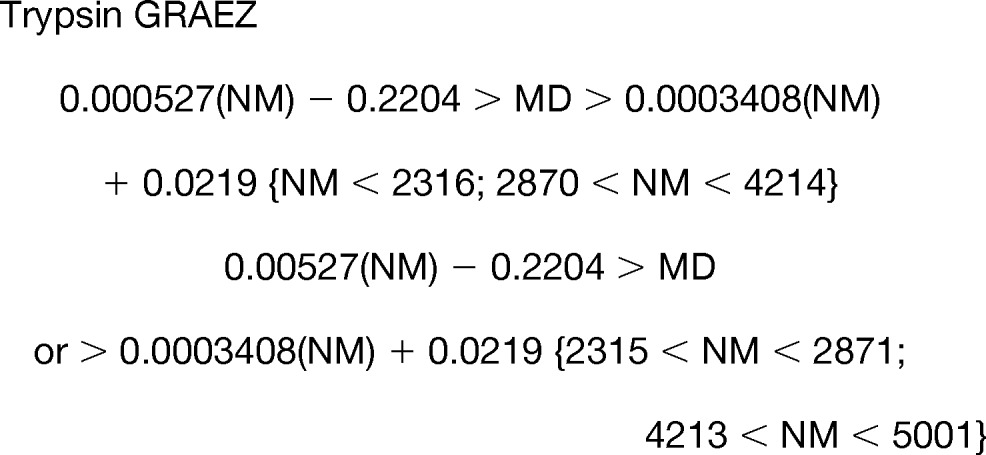
The final GRAEZ settings are given in Equation 1, where NM is the nominal mass (i.e. integer portion of the mass) of the singly protonated (or multiply protonated and deconvoluted) species being tested, and MD is the defect mass (i.e. decimal portion of the mass). Species within the GRAEZ are more likely to be glycosylated peptides, as detailed below.
 |
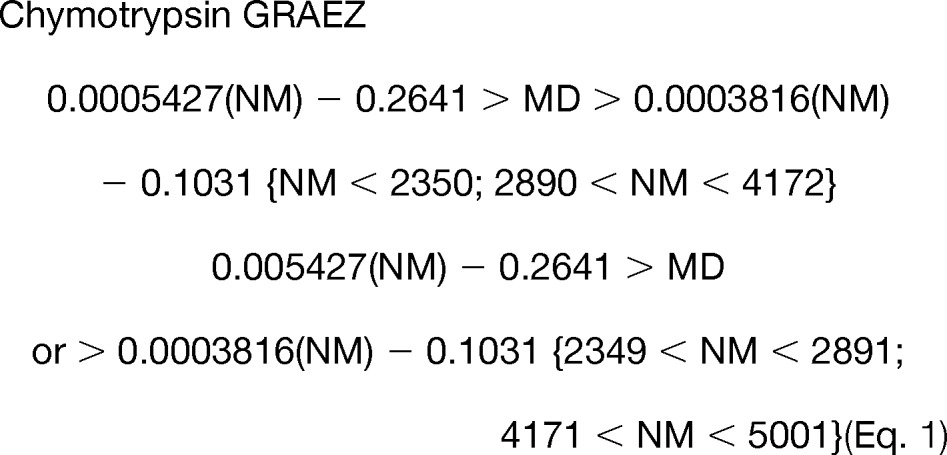 |
The GRAEZ regions determined by these equations are highlighted in Fig. 2 and plotted along with the test datasets. The “or” conditions shown in Equation 1 are required when the calculated values for the “high” end of the GRAEZ becomes >1 or >2. Any calculated GRAEZ values that were larger than 1 had their integer value subtracted, as MD by definition is between the values of 0 and 1. A species that satisfies the condition is classified as a glycopeptide by GRAEZ. For example, a tryptic species with a deconvoluted (M + H)+ value of 3449.4392 daltons would fall between NM 2870 and 4214, and the fractional mass (0.4392) would be evaluated as shown in Equation 2,
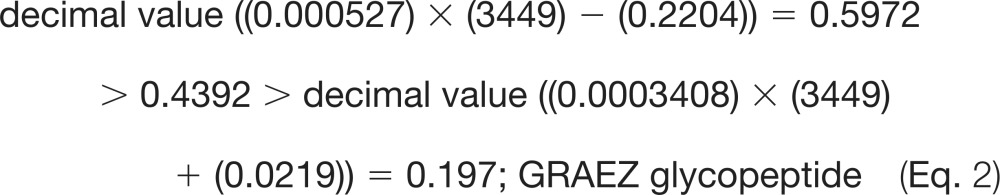 |
Fig. 2.

Mass defect plot of the tryptic (A) and chymotryptic (B) in silico digests. Peptides are plotted in blue, and glycopeptides are plotted in green, with the GRAEZ settings overlaid in orange. Tryptic (A) and chymotryptic (B) digests are both shown. There is a clear shift in mass defect (y axis) between peptides and glycopeptides of a given nominal mass (x axis). This shift holds for each protease treatment; however, the optimal GRAEZ settings are distinct for each protease treatment.
For a large scale analysis, GRAEZ testing can be quickly and easily performed in any of several different software platforms after deconvolution of LC-MS data.
The tryptic training set had a sensitivity of 0.952 and a specificity of 0.900 within the mass range of 1500 to 5000 daltons. After eliminating m/z values outside the GRAEZ (or GRAEZing for glycopeptides), the glycopeptide/peptide ratio increased 9.5-fold. Similarly, the tryptic test set yielded an 8.8-fold increase and the chymotryptic sets averaged a 10-fold increase. The overall accuracy of GRAEZ classification (the proportion of correct assignments) averaged 0.922 for tryptic digests. Similar sensitivity and specificity were achieved for the chymotryptic species, as summarized in Table II. Furthermore, tryptic peptide and glycopeptide test sets were evaluated using the initial study that proposed an MD difference between these species (14). Although the original study achieved some improvement in identifying likely peptides, the true-positive rates of glycopeptide assignment dropped to 0.68, meaning over 30% of tryptic peptides were misclassified as nonmodified peptides in silico using the original MD classification scheme. GRAEZ classification is therefore substantially more sensitive for glycopeptides.
Table II. A summary of the testing outcomes for the in silico data used in this study.
Entries are separated by Species, Training/Test dataset (Dataset); Protease; GRAEZ classification (Glycopeptide or Peptide); false/true positive rate (FPR/TPR), number of species (n); and the accuracy of the test. Correct assignments are underlined, and the overall accuracy of the GRAEZ classifier on each dataset is in boldface type.
| Species | Dataset | Protease | GRAEZ glycopeptide | GRAEZ peptide | FPR/TPR | n | Accuracy |
|---|---|---|---|---|---|---|---|
| Peptide | Training | Trypsin | 2502 | 24,952 | 0.100 | 24,952 | 0.926 |
| Glycopeptide | Training | Trypsin | 23,741 | 1205 | 0.952 | 24,946 | |
| Peptide | Test | Trypsin | 5978 | 49,144 | 0.108 | 55,122 | 0.919 |
| Glycopeptide | Test | Trypsin | 50,327 | 2835 | 0.947 | 53,162 | |
| Peptide | Training | Chymotrypsin | 1676 | 18,618 | 0.083 | 20,294 | 0.934 |
| Glycopeptide | Training | Chymotrypsin | 16,839 | 817 | 0.954 | 17,656 | |
| Peptide | Test | Chymotrypsin | 4335 | 44,338 | 0.089 | 48,673 | 0.933 |
| Glycopeptide | Test | Chymotrypsin | 40,184 | 1812 | 0.957 | 41,996 |
The GRAEZ settings were further applied in silico to the remaining set of 1197 proteins to verify their performance on another dataset. The full list of peptides and glycopeptides utilized may be found in supplemental file 1. Both the tryptic and chymotryptic test sets gave a negligible change in accuracy in the training set (Table II), suggesting that the GRAEZ classifier is robust. In total, over 100,000 tryptic species were tested in silico and GRAEZ correctly classified 91.9% of these species. Similar accuracy was achieved with the chymotryptic test set species (93.3%), which numbered >90,000.
The in silico training sets were also evaluated as the 13C1 and 13C2 isotope, in addition to the monoisotopic species. The GRAEZ classification did not change with the heavy isotopes over 99% of the time (shown in supplemental file 1), a critical consideration for larger analytes for which the 13C1 or 13C2 isotopes are the most abundant. The experimental data shown below also support this claim, as the majority of glycopeptide precursors in human urine had at least one isotopic shift (Table III). Notably, combinatorial approaches to glycoproteomics assign glycopeptides by matching experimentally observed monoisotopic m/z values to a combination of a glycan and a peptide mass. We anticipate that experimental misclassification of precursor m/z values will occur frequently for large precursors and therefore detract from such approaches more often than 1% of the time. This could potentially be an advantage of the GRAEZ approach relative to combinatorial glycoproteomics; however, it requires additional study.
Table III. An annotated set of glycopeptide assignments identified by LC-MS/MS.
A total of 64 species were assigned, and relevant analytical information has been tabulated. A high degree of sialylated glycopeptides were observed with 1–3 sialic acid residues, and a total of 23 distinct glycan compositions were observed. For the glycan composition entry, the following notations were used: H, Hexose; N, N-acetylhexosamine; F, fucose; A, N-acetylneuraminic acid. Each glycan assignment was supported by a sub −20 ppm mass error in the MS/MS spectra.
| OFFGEL Fraction | RT | Precursor m/z | z | MH+ | Glycan composition | Peptide MH+ | Glycan fragment mass | No. 13C | ppm error for glycan loss |
|---|---|---|---|---|---|---|---|---|---|
| min | |||||||||
| 1 | 5.0 | 1041.3996 | 4 | 4162.5766 | H6N5A3 | 1301.6098 | 2862.9702 | 2 | −12.7 |
| 1 | 9.8 | 949.3801 | 4 | 3794.4986 | H5N4A2 | 1588.7300 | 2205.7700 | 1 | −2.4 |
| 1 | 19.4 | 1025.4285 | 3 | 3074.2710 | H5N4A2 | 868.5042 | 2205.7668 | 1 | −3.9 |
| 1 | 21.9 | 961.9293 | 4 | 3844.6954 | H5N4A2 | 1638.9270 | 2205.7730 | 1 | −1.1 |
| 2 | 5.4 | 960.6302 | 4 | 3839.4990 | H5N4A2 | 1632.7377 | 2206.7613 | 2 | −7.9 |
| 2 | 35.6 | 1375.9322 | 3 | 4125.7821 | H5N4F1A1 | 2065.0513 | 2060.7308 | 1 | −0.3 |
| 5 | 9.2 | 1001.4104 | 3 | 3002.2167 | H5N4A2 | 796.4458 | 2205.7709 | 1 | −2.0 |
| 5 | 9.3 | 1048.7663 | 3 | 3144.2844 | H5N4A2 | 937.5064 | 2206.7780 | 2 | −0.3 |
| 5 | 15.7 | 1088.4593 | 3 | 3263.3634 | H7N4A1 | 1025.6070 | 2237.7564 | 0 | −11.9 |
| 6 | 4.9 | 877.5990 | 4 | 3507.3742 | H5N4A2 | 1301.6400 | 2205.7342 | 1 | −18.7 |
| 6 | 7.4 | 935.6323 | 4 | 3739.5074 | H5N4F1A2 | 1386.6700 | 2352.8374 | 2 | 3.3 |
| 6 | 11.0 | 960.3997 | 4 | 3838.5770 | H5N4F1A2 | 1485.7400 | 2352.8370 | 2 | 3.1 |
| 6 | 13.5 | 980.7674 | 3 | 2940.2877 | H5N4A1 | 1025.6100 | 1914.6777 | 1 | 3.8 |
| 6 | 14.1 | 1055.7649 | 3 | 3165.2802 | H5N4A2 | 959.5118 | 2205.7684 | 1 | −3.2 |
| 6 | 16.1 | 1078.1338 | 3 | 3232.3869 | H5N4F2A1 | 1025.6093 | 2206.7776 | 1 | −2.2 |
| 6 | 16.2 | 1126.4807 | 3 | 3377.4276 | H5N4F1A2 | 1025.6100 | 2351.8176 | 1 | −3.9 |
| 6 | 16.9 | 1029.9271 | 4 | 4116.6866 | H5N4F1A2 | 1763.8567 | 2352.8299 | 2 | 0.1 |
| 7 | 9.9 | 1126.4680 | 3 | 3377.3895 | H5N4F1A1 | 1316.6485 | 2060.7410 | 1 | 4.7 |
| 7 | 12.0 | 997.1022 | 3 | 2989.2921 | H6N3A1 | 1115.6331 | 1873.6590 | 1 | 3.0 |
| 7 | 12.1 | 943.0851 | 3 | 2827.2408 | H5N3A1 | 1115.6363 | 1711.6045 | 1 | 1.8 |
| 7 | 13.5 | 938.9036 | 4 | 3752.5926 | H5N4A2 | 1546.8113 | 2205.7813 | 1 | 2.7 |
| 7 | 14.1 | 1055.4285 | 3 | 3164.2710 | H5N4A2 | 959.5068 | 2204.7642 | 0 | −3.6 |
| 7 | 19.5 | 995.9446 | 4 | 3980.7566 | H5N4A2 | 1775.9700 | 2204.7866 | 0 | 6.6 |
| 7 | 20.4 | 1027.4584 | 4 | 4106.8118 | H5N4A2 | 1902.0600 | 2204.7518 | 0 | −9.2 |
| 7 | 21.8 | 1003.9319 | 4 | 4012.7058 | H5N4A2 | 1806.9400 | 2205.7658 | 1 | −4.3 |
| 7 | 23.2 | 988.7003 | 4 | 3951.7794 | H5N4A1 | 2037.1035 | 1914.6759 | 1 | 2.9 |
| 7 | 24.6 | 1061.2232 | 4 | 4241.8710 | H5N4A2 | 2037.0967 | 2204.7743 | 0 | 1.0 |
| 7 | 26.1 | 912.0044 | 5 | 4555.9929 | H5N4A2 | 2349.2200 | 2206.7729 | 2 | −2.6 |
| 7 | 28.5 | 1034.2194 | 4 | 4133.8558 | H5N4A2 | 1927.0600 | 2206.7958 | 2 | 7.7 |
| 9 | 9.4 | 767.9207 | 5 | 3835.5744 | H5N5A2 | 1425.7300 | 2409.8444 | 2 | −5.9 |
| 10 | 6.1 | 935.1452 | 4 | 3737.5590 | H5N4A2 | 1530.7865 | 2206.7725 | 2 | −2.8 |
| 10 | 6.6 | 787.1215 | 5 | 3931.5784 | H5N4A2 | 1725.8100 | 2205.7684 | 1 | −3.1 |
| 10 | 26.6 | 914.4295 | 4 | 3654.6962 | H5N4A2 | 1448.9200 | 2205.7762 | 1 | 0.4 |
| 16 | 7.2 | 1073.4713 | 3 | 3218.3994 | H5N4F1A1 | 1158.6700 | 2059.7294 | 0 | 0.7 |
| 16 | 8.6 | 1007.7892 | 3 | 3021.3531 | H5N4F1A1 | 961.6200 | 2059.7331 | 0 | 2.5 |
| 16 | 13.9 | 1029.4527 | 3 | 3086.3436 | H5N4F1A1 | 1024.6000 | 2061.7436 | 2 | 4.3 |
| 16 | 15.5 | 1047.9351 | 4 | 4188.7186 | H6N5F1A1 | 1762.8487 | 2425.8699 | 1 | 2.7 |
| 16 | 15.6 | 956.4007 | 4 | 3822.5810 | H5N4F1A1 | 1762.8530 | 2059.7280 | 0 | 0.0 |
| 16 | 27.4 | 1085.1565 | 3 | 3253.4550 | H5N4F1A1 | 1193.7246 | 2059.7304 | 0 | 1.1 |
| 16 | 28.2 | 909.6679 | 4 | 3635.6498 | H5N4F1A1 | 1574.9200 | 2060.7298 | 1 | −0.8 |
| 16 | 30.6 | 1291.9146 | 3 | 3873.7293 | H5N4F1A1 | 1812.9990 | 2060.7303 | 1 | −0.5 |
| 16 | 32.1 | 962.6926 | 4 | 3847.7486 | H6N5F1A1 | 1422.8871 | 2424.8615 | 0 | 0.6 |
| 16 | 32.5 | 977.4430 | 4 | 3906.7502 | H6N6A1 | 1422.8785 | 2483.8717 | 2 | −9.7 |
| 16 | 32.6 | 936.6859 | 4 | 3743.7218 | H5N6A1 | 1422.8845 | 2320.8373 | 1 | -0.9 |
| 16 | 32.9 | 1229.9039 | 3 | 3687.6972 | H5N5F1A1 | 1422.8881 | 2264.8091 | 2 | −2.0 |
| 16 | 32.9 | 929.9304 | 4 | 3716.6998 | H5N3F2A2 | 1422.8800 | 2293.8198 | 0 | 10.8 |
| 16 | 32.9 | 934.6821 | 4 | 3735.7066 | H5N4F1A1 | 1673.9700 | 2061.7366 | 2 | 0.9 |
| 16 | 34.4 | 873.6599 | 4 | 3491.6178 | H5N4F1 | 1721.9700 | 1769.6478 | 1 | 7.0 |
| 16 | 36.4 | 946.6840 | 4 | 3783.7142 | H5N4F1A1 | 1721.9600 | 2061.7542 | 2 | 9.5 |
| 17 | 7.5 | 821.1278 | 4 | 3281.4894 | H5N4F2A1 | 1074.7200 | 2206.7694 | 1 | −9.0 |
| 17 | 13.7 | 865.3820 | 4 | 3458.5062 | H5N5F2 | 1339.7295 | 2118.7767 | 1 | 4.9 |
| 17 | 13.8 | 1104.4873 | 3 | 3311.4474 | H5N5F1 | 1339.7293 | 1971.7181 | 0 | 3.1 |
| 17 | 14.0 | 920.4036 | 4 | 3678.5926 | H6N6F1 | 1339.7300 | 2338.8626 | 2 | 5.1 |
| 17 | 14.2 | 883.8876 | 4 | 3532.5286 | H6N6 | 1339.7259 | 2192.8027 | 2 | 15.0 |
| 17 | 15.4 | 993.1662 | 4 | 3969.6430 | H5N4F2A1 | 1762.8503 | 2206.7927 | 1 | 1.5 |
| 17 | 17.0 | 1009.7729 | 3 | 3027.3042 | H5N5F1 | 1054.5865 | 1972.7177 | 1 | 1.2 |
| 17 | 37.6 | 1020.7279 | 4 | 4079.8898 | H6N6F1 | 1742.0423 | 2337.8475 | 1 | 0.1 |
| 18 | 9.6 | 898.9125 | 4 | 3592.6282 | H5N4F2A1 | 1386.8573 | 2205.7709 | 0 | −3.7 |
| 19 | 11.7 | 878.4148 | 4 | 3510.6374 | H5N4A2 | 1303.8825 | 2206.7549 | 2 | −10.8 |
| 23 | 14.3 | 1058.6978 | 4 | 4231.7694 | H5N6F3 | 1762.8571 | 2468.9123 | 2 | 5.1 |
| 23 | 14.6 | 971.1642 | 4 | 3881.6350 | H5N5F2 | 1762.8519 | 2118.7831 | 1 | 7.9 |
GRAEZ Evaluation of Published Reports
To further validate the in silico results, published proteomic and glycoproteomic data were also evaluated. GRAEZ testing of a recently published proteomic dataset of the HeLa cell proteome (18) correctly classified 96.2% of 4760 unique tryptic peptides between 1500 and 5000 daltons as peptides, with a specificity of 0.962 (supplemental file 1). Similarly, a retrospective GRAEZ classification of several published site-specific glycoproteomic studies was also performed to validate the sensitivity of the method. As glycoproteomics studies have not approached the scale of proteomics studies, several distinct studies were needed to generate a sufficient number of glycopeptides to test GRAEZ classifications. These studies examined a variety of different samples, including glycoprotein standards (19), fetal bovine serum (20), human urine (21), murine zona pellucida glycoproteins (22), human haptoglobin (23), human α-1 acid glycoprotein (24), hepatitis C glycoprotein (25), HIV envelope glycoprotein gp140 (26), and human IgG subclasses (27). In total, 624 nonredundant, intact tryptic glycopeptides were identified in these studies within the mass range of 1500–5000 daltons. Subsequent GRAEZ testing was performed on experimental m/z values when given and on imputed m/z values when absent. GRAEZ correctly classified 564 of these species as glycopeptides (as detailed in supplemental file 3), for an overall sensitivity of 0.904. This result demonstrates that the sensitivity of GRAEZ classification was maintained among these reports on diverse samples. Based on these experimental data from multiple organisms, instrumental platforms, and laboratories, we predict GRAEZ classification will be useful for a wide variety of future N-glycoproteomic studies to identify likely N-glycopeptide precursors in LC-MS.
Experimental Validation of GRAEZ Classification
The utility of GRAEZ was further evaluated experimentally using tryptic peptides isolated from urine. Urine is a highly complex, clinically relevant sample type, and it contains numerous salts, peptides, and metabolites. To combat the possibility of nonpeptide background contamination affecting the classification, peptides were labeled with amine-reactive TMT tags before analysis. Using the mzPresent tool, every MS2 spectra collected was searched for two fragment ions as follows: TMT reporter tag at 126.1277, which was required for the “peptide” designation, and the 366.1395 peak, which was required for “glycopeptide” designation. Species without either of these ions were not considered in the GRAEZ classification.
Urine was chosen to challenge the GRAEZ classification, as it is a highly complex sample containing thousands of proteins. We also opted against any glycopeptide enrichment, to challenge the GRAEZ classification. Therefore, it was expected that the number of peptides observed would vastly outnumber glycopeptides, as peptides are known to suppress ionization of glycopeptides, and are present at higher stoichiometric values. Furthermore, a recent study (21) shows O-glycopeptides are prevalent in urine, which are expected to further challenge the accuracy of N-linked glycopeptide characterization. Although N- and O-linked glycopeptides can yield the same small oxonium ions upon higher energy collisionally activated dissociation (HCD) fragmentation, they will not respond equally well to GRAEZ classification because an O-linked glycopeptide's glycan moieties are smaller. O-Linked glycopeptides are anticipated to be missed by GRAEZ classification, due to the small size of most O-linked glycopeptide's glycan moieties. Thus, the subset of oxonium-yielding precursor ions likely includes some O-glycopeptides that are expected to be less ideal candidates for GRAEZ classification. This subjects the classification criteria to yet another challenge that can reasonably be expected to occur in other sample types.
Despite these challenges, an analysis of MS2 spectra (n = 90,624) showed that 90% (692/772) of all species that yielded oxonium fragments upon activation by HCDs were characterized as N-glycopeptides by the GRAEZ algorithm. Similarly, 93% (83,289/89,852) of all peptide species were correctly classified as well. The lack of any glycopeptide enrichment led to a very challenging analytical background. In total, 116 unique peptide precursors were selected by DDA for every glycopeptide precursor. To date, there are few studies that intentionally analyze intact glycopeptides and peptides simultaneously, because peptides and glycopeptides have distinct optimal instrumental parameters (28, 29). Unfortunately, the presence of both species in a glycopeptide enrichment sample is an undesired yet common outcome of contemporary enrichment protocols. In this study, we wanted to demonstrate the utility of GRAEZ classification within a highly complex and challenging analytical background. In addition, these samples were analyzed using peptide-optimized MS settings, and there was a majority (>85%) of low quality spectra acquired.
However, several high quality glycopeptide fragmentations were still observed, and the glycan portions were assigned by the presence of the abundant Y1 ion (nomenclature detailed in Ref. 30) and a minimum of three other glycosidic fragment ions. Two examples of higher quality spectra are shown in Fig. 3. In each spectrum, a loss corresponding to the nonreducing end glycan moieties was observed, followed by successive losses of six monosaccharide residues. In both spectra, a 0,2X0 ion was observed, and in Fig. 3B, loss of the terminal GlcNac residue was also observed. Each spectrum identified the mass of the peptide portion in addition to the glycan composition. Spectra corresponding to a total of 61 glycopeptides were acquired with sufficient quality to manually assign the glycan portion of the glycopeptides in the data-dependent analyses, and relevant information is tabulated in Table III. These species were predominantly glycopeptides with sialylated complex-type glycans. The peptide MH+ values were imputed after assignment of the MS/MS pattern observed, usually supported by abundant Y1 and 0,2X0 type ions. After identifying the Y1 ion, the remaining mass lost from the calculated precursor MH+ was determined and cross-referenced against plausible N-glycan compositions to confirm the compositional assignment. Each glycan loss matched an N-glycan composition at less than 20 ppm mass tolerance. The peptide portions were not sequenced in this study and are reported as their input (M + H)+ values.
Fig. 3.

Examples of two glycopeptide MS/MS spectra. A, complex, monosialylated, and difucosylated N-glycan is observed; B, complex monosialylated N-glycan is observed. Fragment ions are observed as a series of Y-type ions from the intact N-glycopeptide precursor and a clear sequential loss of the N-linked core mannoses and N-acetylglucosamine. In each case, a 0,2X0 type cleavage is observed for the reducing end N-acetylglucosamine. Remaining glycan compositions are assigned by accurate mass losses from the precursor ion, and a minimum of four Y- or X-type ions was required for each assignment. Although full structural characterization was not performed, a possible glycan is shown for each spectrum that reflects the composition determined. The full set of assignments is shown in Table III.
Prospective Analysis of Precursors of Interest
An unfractionated sample of urinary peptides was initially analyzed by DDA MS/MS and subsequently by targeted MS. A total of 2325 species from the initial analysis were characterized as glycopeptides by the GRAEZ. A total of 3196 MS2 spectra were acquired, and 2598 (81%) of these had an oxonium ion at a minimum of 25% of the base peak intensity. A less stringent cutoff of 5% increased the number to 2878 or 90% of all MS2 spectra acquired. Our fractionated urine sample gave a glycopeptide sampling rate of only 0.8% by comparison, generating only 772 MS2 spectra in substantially more instrument time. Therefore, generating a targeted list based on GRAEZ classification significantly increased both the glycopeptide MS/MS sampling efficiency and depth.
Considerations for GRAEZ Classification for Glycoproteomics
The GRAEZ approach has specific requirements. First, it requires an instrument capable of making precursor m/z measurements with high mass accuracy. Furthermore, an examination of the in silico data suggests that the GRAEZ approach will be useful provided the instrumental precursor mass error was no larger than 20 ppm (distributions shown in supplemental Fig. 2). GRAEZing does not solve enrichment issues; however, the experimental data acquired in this study suggest that MS1 targets may be determined while performing standard proteomics experimentation. Overall, the size of the list of putative N-glycopeptides presented here (61) is comparable with recent reports using glycopeptide enrichment (21) of human urine, although a full characterization of the peptide portions was not performed in this study. GRAEZ performance was expected to be highest for N-glycopeptides with large glycan portions. The glycopeptide recall rate was minimized at ∼60% for glycopeptides with very small N-glycans (Hex3HexNac2 and Hex3Hexnac5) in silico.
Recent work from the Desaire laboratory has optimized the MD boundaries of peptides and advanced the use of MD filters (31). They found the width of 95% of the peptide distribution at 3000 daltons to be 0.49 daltons, whereas the GRAEZ settings for glycopeptides are only 0.316 daltons wide for the same NM. We believe this narrowing is due to two factors. First, the set of peptides with a consensus motif is a subset of the full peptide pool, narrowing the distribution. Second, the distribution of possible MDs for glycopeptides is narrowed by the glycan moiety itself. For example, if an N-glycopeptide of a nominal mass of 3000 daltons has an N-linked core attached, the corresponding spread of MD contributions from the peptide portion is approximately equivalent to a peptide of 1600 daltons. The glycan contributions do not spread the MD distribution as much, as there are fewer possible glycan compositions. Notably, the effect of mass shifting is essentially negligible with small post-translational modifications such as sulfation and phosphorylation, as the MD width does not shift much over a small mass difference.
We anticipate GRAEZing will be useful whenever glycopeptide signals are suppressed such that they are not or are sparsely fragmented and yet are still visible in MS1 scans, a very common occurrence in data-dependent analysis of complex mixtures. Essentially no information about the sample was required (i.e. no glycomic or proteomic experiments need to be performed) other than knowledge of the protease used. Finally, GRAEZing is modular, and it may be performed after glycopeptide enrichment, increasing the utility of GRAEZing by limiting peptide contamination and improving the outcome of established glycopeptide enrichment strategies by increasing glycopeptide sampling in MS/MS analysis. We demonstrate GRAEZing may be performed after an initial proteomics DDA analysis, resulting in extensive coverage of glycopeptide targets.
CONCLUSIONS
The large scale analysis of glycopeptides remains a major analytical challenge. In this work, a sensitive and specific method applied to generic proteomic data that discriminates N-glycopeptides from nonglycosylated peptides based on accurate mass measurements has been developed. Precursors within the GRAEZ are enriched in glycopeptides by an order of magnitude. By identifying an N-glycopeptide-enriched targeted list from an initial data-dependent analysis, the researcher may efficiently target glycopeptides in a subsequent re-analysis. This also introduces the intriguing possibility of targeting glycopeptides in a single on-line experiment in which the instrument software is trained to preferentially select likely glycopeptide masses for MS/MS. Because classification is based on the intrinsic mass defects of the elements, this method can be applied to diverse glycoproteomic problems without the need for prior knowledge regarding the proteome or glycome present. For example, GRAEZ classification may be used to quickly compare the effectiveness of different glycopeptide sample preparations, where the detailed interpretation of hundreds or thousands of tandem MS spectra would be too laborious to fully characterize quickly. Finally, GRAEZ classification of existing proteomic datasets could be used to quickly evaluate the prevalence of glycosylated peptides in existing data, with no additional instrument time required. This will allow researchers to quickly evaluate the benefit of a thorough glycoproteomic characterization on previously analyzed samples. Overall, this approach represents a simple means of significantly improving glycoproteomic depth; as such, we predict that mass defect filtering will contribute substantially to the field of site-specific glycoproteomics.
Supplementary Material
Acknowledgments
We thank the Department of Urology, Boston Children's Hospital, for their continued support.
The content is solely the responsibility of the authors and does not necessarily represent the official views of the National Institutes of Health.
Footnotes
* This work was supported, in whole or in part, by National Institutes of Health Grants DK077836 (to R.S.L.), DK077836S1 (to R.S.L.), R01NS066973 (to J.S.), and NS007473 Teaching Grant from NINDS (to O.S).
 This article contains supplemental material.
1 The abbreviations used are:
- DDA
- data-dependent analysis
- MD
- mass defect
- GRAEZ
- glycopeptide-rich acquisition enhancement zone
- TEAB
- triethyl ammonium bicarbonate
- ACG
- automatic gain control.
REFERENCES
- 1. Varki A. (1993) Biological roles of oligosaccharides: all of the theories are correct. Glycobiology 3, 97–130 [DOI] [PMC free article] [PubMed] [Google Scholar]
- 2. An H. J., Froehlich J. W., Lebrilla C. B. (2009) Determination of glycosylation sites and site-specific heterogeneity in glycoproteins. Curr. Opin. Chem. Biol. 13, 421–426 [DOI] [PMC free article] [PubMed] [Google Scholar]
- 3. Dodds E. D. (2012) Gas-phase dissociation of glycosylated peptide ions. Mass Spectrom. Rev. 31, 666–682 [DOI] [PubMed] [Google Scholar]
- 4. Dalpathado D. S., Irungu J., Go E. P., Butnev V. Y., Norton K., Bousfield G. R., Desaire H. (2006) Comparative glycomics of the glycoprotein follicle-stimulating hormone: glycopeptide analysis of isolates from two mammalian species. Biochemistry 45, 8665–8673 [DOI] [PubMed] [Google Scholar]
- 5. Clowers B. H., Dodds E. D., Seipert R. R., Lebrilla C. B. (2007) Site determination of protein glycosylation based on digestion with immobilized nonspecific proteases and Fourier transform ion cyclotron resonance mass spectrometry. J. Proteome Res. 6, 4032–4040 [DOI] [PubMed] [Google Scholar]
- 6. Kolarich D., Jensen P. H., Altmann F., Packer N. H. (2012) Determination of site-specific glycan heterogeneity on glycoproteins. Nat. Protoc. 7, 1285–1298 [DOI] [PubMed] [Google Scholar]
- 7. Desaire H., Hua D. (2009) When can glycopeptides be assigned based solely on high-resolution mass spectrometry data? Int. J. Mass Spectrom. 287, 21–26 [Google Scholar]
- 8. Ito S., Hayama K., Hirabayashi J. (2009) Enrichment strategies for glycopeptides. Methods Mol. Biol. 534, 195–203 [DOI] [PubMed] [Google Scholar]
- 9. Huddleston M. J., Bean M. F., Carr S. A. (1993) Collisional fragmentation of glycopeptides by electrospray ionization LC/MS and LC/MS/MS: methods for selective detection of glycopeptides in protein digests. Anal. Chem. 65, 877–884 [DOI] [PubMed] [Google Scholar]
- 10. Jebanathirajah J., Steen H., Roepstorff P. (2003) Using optimized collision energies and high resolution, high accuracy fragment ion selection to improve glycopeptide detection by precursor ion scanning. J. Am. Soc. Mass Spectrom. 14, 777–784 [DOI] [PubMed] [Google Scholar]
- 11. Bruce C., Shifman M. A., Miller P., Gulcicek E. E. (2006) Probabilistic enrichment of phosphopeptides by their mass defect. Anal. Chem. 78, 4374–4382 [DOI] [PMC free article] [PubMed] [Google Scholar]
- 12. Dodds E. D., An H. J., Hagerman P. J., Lebrilla C. B. (2006) Enhanced peptide mass fingerprinting through high mass accuracy: Exclusion of nonpeptide signals based on residual mass. J. Proteome Res. 5, 1195–1203 [DOI] [PubMed] [Google Scholar]
- 13. Kirchner M., Timm W., Fong P., Wangemann P., Steen H. (2010) Nonlinear classification for on-the-fly fractional mass filtering and targeted precursor fragmentation in mass spectrometry experiments. Bioinformatics 26, 791–797 [DOI] [PMC free article] [PubMed] [Google Scholar]
- 14. Lehmann W. D., Bohne A., von Der Lieth C. W. (2000) The information encrypted in accurate peptide masses-improved protein identification and assistance in glycopeptide identification and characterization. J. Mass Spectrom. 35, 1335–1341 [DOI] [PubMed] [Google Scholar]
- 15. Vaezzadeh A. R., Briscoe A. C., Steen H., Lee R. S. (2010) One-step sample concentration, purification, and albumin depletion method for urinary proteomics. J. Proteome Res. 9, 6082–6089 [DOI] [PMC free article] [PubMed] [Google Scholar]
- 16. Cox J., Mann M. (2008) MaxQuant enables high peptide identification rates, individualized p.p.b.-range mass accuracies and proteome-wide protein quantification. Nat. Biotechnol. 26, 1367–1372 [DOI] [PubMed] [Google Scholar]
- 17. Kessner D., Chambers M., Burke R., Agus D., Mallick P. (2008) ProteoWizard: open source software for rapid proteomics tools development. Bioinformatics 24, 2534–2536 [DOI] [PMC free article] [PubMed] [Google Scholar]
- 18. Nagaraj N., Wisniewski J. R., Geiger T., Cox J., Kircher M., Kelso J., Pääbo S., Mann M. (2011) Deep proteome and transcriptome mapping of a human cancer cell line. Mol. Syst. Biol. 7, 548. [DOI] [PMC free article] [PubMed] [Google Scholar]
- 19. Hart-Smith G., Raftery M. J. (2012) Detection and characterization of low abundance glycopeptides via higher-energy C-trap dissociation and orbitrap mass analysis. J. Am. Soc Mass Spectrom. 23, 124–140 [DOI] [PubMed] [Google Scholar]
- 20. Wang X., Emmett M. R., Marshall A. G. (2010) Liquid chromatography electrospray ionization Fourier transform ion cyclotron resonance mass spectrometric characterization of N-linked glycans and glycopeptides. Anal. Chem. 82, 6542–6548 [DOI] [PubMed] [Google Scholar]
- 21. Halim A., Nilsson J., Ruetschi U., Hesse C., Larson G. (2011) Human urinary glycoproteomics; attachment site-specific analysis of N- and O-linked glycosylations by CID and ECD. Mol. Cell. Proteomics, [DOI] [PMC free article] [PubMed] [Google Scholar]
- 22. Goldberg D., Bern M., Parry S., Sutton-Smith M., Panico M., Morris H. R., Dell A. (2007) Automated N-glycopeptide identification using a combination of single- and tandem-MS. J. Proteome Res. 6, 3995–4005 [DOI] [PubMed] [Google Scholar]
- 23. Wang D., Hincapie M., Rejtar T., Karger B. L. (2011) Ultrasensitive characterization of site-specific glycosylation of affinity-purified haptoglobin from lung cancer patient plasma using 10 μm i.d. porous layer open tubular liquid chromatography-linear ion trap collision-induced dissociation/electron transfer dissociation mass spectrometry. Anal. Chem. 83, 2029–2037 [DOI] [PMC free article] [PubMed] [Google Scholar]
- 24. Zhang Y., Go E. P., Desaire H. (2008) Maximizing coverage of glycosylation heterogeneity in MALDI-MS analysis of glycoproteins with up to 27 glycosylation sites. Anal. Chem. 80, 3144–3158 [DOI] [PubMed] [Google Scholar]
- 25. Iacob R. E., Perdivara I., Przybylski M., Tomer K. B. (2008) Mass spectrometric characterization of glycosylation of hepatitis C virus E2 envelope glycoprotein reveals extended microheterogeneity of N-glycans. J. Am. Soc. Mass Spectrom. 19, 428–444 [DOI] [PMC free article] [PubMed] [Google Scholar]
- 26. Irungu J., Go E. P., Zhang Y., Dalpathado D. S., Liao H. X., Haynes B. F., Desaire H. (2008) Comparison of HPLC/ESI-FTICR MS versus MALDI-TOF/TOF MS for glycopeptide analysis of a highly glycosylated HIV envelope glycoprotein. J. Am. Soc. Mass Spectrom. 19, 1209–1220 [DOI] [PMC free article] [PubMed] [Google Scholar]
- 27. Wuhrer M., Stam J. C., van de Geijn F. E., Koeleman C. A., Verrips C. T., Dolhain R. J., Hokke C. H., Deelder A. M. (2007) Glycosylation profiling of immunoglobulin G (IgG) subclasses from human serum. Proteomics 7, 4070–4081 [DOI] [PubMed] [Google Scholar]
- 28. Krenyacz J., Drahos L., Vekey K. (2009) Letter: Collision energy and cone voltage optimisation for glycopeptide analysis. Eur. J. Mass Spectrom. 15, 361–365 [DOI] [PubMed] [Google Scholar]
- 29. Froehlich J. W., Barboza M., Chu C., Lerno L. A., Jr., Clowers B. H., Zivkovic A. M., German J. B., Lebrilla C. B. (2011) Nano-LC-MS/MS of glycopeptides produced by nonspecific proteolysis enables rapid and extensive site-specific glycosylation determination. Anal. Chem. 83, 5541–5547 [DOI] [PubMed] [Google Scholar]
- 30. Domon B., Costello C. E. (1988) A systematic nomenclature for carbohydrate fragmentations in FAB-MS/MS spectra of glycoconjugates. Glycoconj. J. 5, 397–409 [Google Scholar]
- 31. Toumi M. L., Desaire H. (2010) Improving mass defect filters for human proteins. J. Proteome Res. 9, 5492–5495 [DOI] [PMC free article] [PubMed] [Google Scholar]
Associated Data
This section collects any data citations, data availability statements, or supplementary materials included in this article.