

Abstract
Syntaxin 1a is a plasma membrane soluble N-ethylmaleimide-sensitive factor attachment receptor protein (SNARE) that contains an H3 domain (SNARE motif) and a regulatory Habc domain. These regions associate to produce a closed state, which is generally thought to suppress assembly of syntaxin into the SNARE complex. However, the molecular nature of the closed and open states of syntaxin is not well defined. Here, we use electron paramagnetic resonance spectroscopy to characterize conformational exchange in syntaxin. The data indicate that the H3 segment is in equilibrium between ordered and disordered states that have significant populations. In solution, the central region of the H3 segment is positioned close to the Habc domain and the configuration of syntaxin 1a is dominated by a closed state. However, an open state is enhanced in full-length membrane reconstituted syntaxin. Munc18-1 binding alters the equilibrium along H3 to favor the ordered, folded state. Munc18 also suppresses the minor open population and narrows the distance distributions between H3 and Habc. The allosteric control exhibited by Munc18 on the H3 segment and the suppression of the minor open component may both play a role in regulating membrane fusion by controlling the assembly of syntaxin into the SNARE complex.
Introduction
Neurotransmitter release is mediated by a membrane fusion event that joins the synaptic vesicle membrane with the presynaptic plasma membrane. This process is mediated by soluble N-ethylmaleimide-sensitive factor attachment receptor proteins (SNAREs), which assemble into a tight four helical bundle that is thought to provide the energy required to overcome the barrier to fusion (1,2). In the neuronal system, the helical SNARE complex is formed from three proteins: syntaxin 1a and SNAP-25 in the plasma membrane and synaptobrevin in the vesicle membrane. The regulation and assembly of these proteins to form the SNARE bundle is essential to neuronal fusion, and a number of critical effector proteins function to mediate this process. Sec1/Munc18 (SM) proteins are conserved regulators of the membrane fusion process (3–5), and in the neuronal system they include Munc18-1, which interacts with syntaxin 1a and is believed to play a role in regulating syntaxin availability and assembly into the SNARE complex.
Munc18-1 is thought to have two modes of interaction with syntaxin 1a. One mode of binding is based upon a crystal structure for the Munc18-1-syntaxin complex (6,7), shown in Fig. 1 c. In this structure, the concave surface formed by domains 1 and 3a of Munc18-1 interacts with both the SNARE forming (H3) and regulatory (Habc) domains of syntaxin 1a. This structure is termed closed because the H3 segment is in contact with the Habc domain and syntaxin 1a is inhibited from assembling into the SNARE complex (6). Munc18-1 has a second mode of binding in which it interacts with syntaxin 1a in an open conformation. In this mode, the H3 segment of syntaxin 1a is assembled into a binary or ternary SNARE complex, and the H3 domain must be dissociated from the Habc domain (8,9). In this open state, the interaction of Munc18-1 is mediated by an N-terminal peptide in syntaxin 1a that precedes the Habc domain. This interaction is thought to have a stimulatory role in fusion, although recent work indicated that it may not be critical for synaptic transmission (10).
Figure 1.
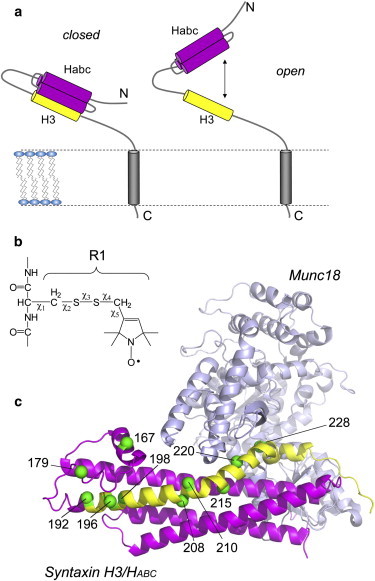
(a) Syntaxin 1a is a membrane-anchored protein containing a SNARE motif (H3 segment in yellow) and regulatory Habc domain (magenta) that undergoes a closed-to-open transition regulated by Munc18-1. (b) The spin-labeled side-chain R1 shows the rotatable bonds linking the nitroxide to the protein backbone. (c) The R1 side chain was attached to several sites along H3, which are shown in the crystal structure of the syntaxin 1a/Munc18-1 complex (PDB ID: 3C98). The Cα carbons to which R1 has been attached are rendered as green spheres.
At the present time, information on the dynamics and structures assumed by syntaxin 1a either alone or in complex with Munc18-1 is limited. It is generally thought that the H3 domain is flexible but assumes a more ordered helical structure upon Munc18-1 binding (11,12). In the absence of Munc18-1, syntaxin 1a may fluctuate between open and closed forms, as shown in Fig. 1 a, but reports on this conformational equilibrium differ. A single-molecule fluorescence study indicated that syntaxin adopts a predominantly open conformation, with a minor population in the closed state (12). Addition of Munc18-1 shifts this equilibrium shifts to the closed state, with the interdomain distances closely matching the crystal structure (Fig. 1 c). In contrast, an NMR study of syntaxin 1a indicated that the protein is predominantly closed, and the H3 domain is closely associated with the Habc domain whether Munc18-1 is present or not (11). A more recent study using x-ray and neutron diffraction differed from these two studies and concluded that the syntaxin 1a/Munc18-1 complex is not represented by the crystal structure, and that Munc18-1 does not close syntaxin 1a unless the N-terminal segment of syntaxin is removed (13).
Protein dynamics and structural fluctuations play important roles in regulating protein-protein interactions (14,15). As a result, dynamics and conformational exchange in syntaxin are likely to be important properties that define the ability of syntaxin to assemble into the SNARE complex and drive membrane fusion. However, dynamics and conformational exchange on the timescale that is important for protein recognition can be difficult to characterize.
Electron paramagnetic resonance (EPR) spectroscopy is particularly well suited to examine conformational exchange events in proteins, which typically occur on the microsecond timescale (16–18). In this work, we use site-directed spin labeling (SDSL) along with continuous-wave and pulse EPR spectroscopy to characterize conformational exchange in syntaxin 1a in the presence and absence of Munc18-1. The H3 segment of syntaxin 1a is found to be in conformational exchange between ordered and disordered states, both of which have significant populations. In the absence of Munc18, the central region of the H3 segment remains positioned near the Habc domain, and only a minor population in this central segment samples an open configuration. This open state is enhanced in full-length membrane reconstituted syntaxin. The binding of Munc18 shifts the conformational equilibria along H3 toward a more ordered state and eliminates the open configuration. These changes represent an allosteric control of the H3 domain structure and suggest that dynamic disorder at the N-terminal end of the H3 segment may modulate the assembly of syntaxin into binary or tertiary SNARE complexes.
Materials and Methods
Mutagenesis, expression, and purification
pET28 plasmids bearing the soluble syntaxin-1a (residues 1–262), full-length syntaxin-1A (residues 1–288), and Munc18-1 genetic inserts were provided by Reinhard Jahn and Dirk Fasshauer (Max Planck Institute for Biophysical Chemistry, Göttingen, Germany). The QuikChange PCR method (Agilent Technologies, Wilmington, DE) was used to engineer single and double cysteine mutations into syntaxin 1a, and a BL21 CodonPlus DE3 (RIL) Escherichia coli host (Agilent Technologies) was used for expression. The cells were grown in lysogeny broth (LB) media with 40 mg/L kanamycin. When the cells reached an optical density (o.d.) of 0.8–1.0, expression was induced with 0.4 mM of isopropylthio-β-galactoside. The cells were incubated at 20°C overnight and then harvested by centrifugation at 3500 × g.
For protein purification, the cell pellet was resuspended in the buffer containing 20 mM HEPES, 500 mM NaCl, 8 mM imidazole, 20 μmol leupeptin, 50 μmol 4-(2-Aminoethyl) benzenesulfonyl fluoride hydrochloride, 750 U benzonase nuclease (EMD Millipore, Billerica, MA), pH 7.3. For full-length syntaxin, sodium cholate 5% (w/v) was added to this buffer, and 1% (w/v) sodium cholate was present in subsequent buffers used during purification. The cells were passed through a French press twice and centrifuged at 90,000 × g for 1 h. The supernatant was then mixed with 5 ml of preequilibrated NiNTA resin (Biorad, Hercules, CA), shaken for 1 h at 4°C, and subsequently washed with 10 volumes of buffer containing 20 mM HEPES, 500 mM NaCl, 20 mM imidazole, pH 7.3. For both soluble and full-length syntaxin, the first four volumes contained 1% (w/v) Triton X-100 and the next four contained 1% (w/v) sodium cholate. The protein was eluted with two volumes of 500 mM NaCl, 300 mM imidazole pH 7.3, and then dialyzed against 20 mM HEPES, 500 mM NaCl, 2 mM EDTA, 2 mM dithiothreitol, pH 7.3, followed by dialysis against a buffer with 20 mM HEPES, 150 mM NaCl, pH 7.3. During dialysis, 250 U of thrombin were added to the protein to cleave the N-terminal His-tag. Protein purity was assessed by SDS-PAGE and the protein solution was concentrated by ultrafiltration (Ultracel 30K; EMD Millipore).
For syntaxin spin labeling, 1 mg of 1-oxyl-2,2,5,5-tetramethyl-3-pyrroline-3-methyl methanethiosulfonate (MTSL; Toronto Research Chemicals, Toronto, Canada) was added in ethanol and the protein was incubated overnight at 4°C. The unbound spin label was removed using a HiPrep 26/10 desalting column (GE HealthCare, Piscataway, NJ), and the eluted protein was concentrated by ultrafiltration.
Sample preparation and EPR measurements
To prepare soluble syntaxin (1-262) with or without Munc18-1 for EPR, protein samples were mixed with 0.5 mL of desired buffer and concentrated by ultrafiltration (Ultracel 30K; EMD Millipore). These buffers were typically 20 mM phosphate or MOPS buffers at low to moderate ionic strengths (see figure legends). Samples for continuous-wave EPR ranged from 10 to 100 μM, and samples for pulse EPR were typically used at a concentration of 40 μM but were recorded in a few cases at concentrations as low as 2 μM.
To prepare full-length syntaxin (1-288), a lipid film of either POPC or POPC/POPS (3:1) (Avanti Polar Lipids, Alabaster, AL) was rehydrated in a 20 mM phosphate buffer (pH = 7.3) with 12 mM of sodium cholate to a total lipid concentration of 15 mM. Syntaxin (1-288) was added to this mixture and the solution was then incubated for half an hour at room temperature and dialyzed twice against buffer. The resulting vesicles were centrifuged at 500,000 × g for 20 min and the vesicle pellet was dissolved in buffer. The protein/lipid ratio was 1:1000 and the protein concentration in the sample was 50–100 μM.
For continuous-wave measurements, samples were loaded into glass capillaries with 0.6 mm inner diameter (i.d.) and 0.84 mm o.d. (VitroCom, Mountain Lakes, NJ). EPR spectra were recorded using a Varian E-line 102 Century series X-band spectrometer fitted with a loop-gap resonator (Medical Advances, Milwaukee, WI) or a Bruker EMX spectrometer with a room-temperature ER 4123D dielectric resonator. The measurements were carried out at 2 mW incident microwave power using 1 G modulation amplitude. The spectra were then processed using LabVIEW programs provided by Christian Altenbach (University of California, Los Angeles, CA).
For double electron-electron resonance (DEER) measurements, protein samples were loaded into quartz capillaries (2.0 mm i.d. and 2.4 mm o.d.) and frozen in a dry-ice-isopropanol bath. The pulse experiments were carried out at 80 K on a Bruker Elexsys E580 spectrometer at X-band using an ER4118X-MS3 split-ring resonator or at Q-band using an EN5107D2 dielectric resonator (Bruker Biospin, Billerica, MA). Data in pulse mode were acquired using a four-pulse DEER sequence (19) with 16-ns π/2 and 32-ns π observe pulses separated by a 32-ns π pump pulse. The dipolar evolution times were typically 2–4 μs. The pump frequency was set to the center maximum of the nitroxide spectrum and the observe frequency was set to the low-field maximum, typically 15–25 MHz higher in frequency. The dipolar evolution data were processed and distance distributions determined using Tikhonov regularization incorporated into the DeerAnalysis2011 software package (20). This program contains an error analysis routine that was used to assess the error produced by background subtraction upon the distance distributions.
Syntaxin 1a EPR spectra in sucrose
Syntaxin EPR spectra were titrated with 0–40% (w/v) sucrose (Fisher Scientific, Pittsburgh, PA) while the final protein concentrations were maintained at ∼40 μM. In a few cases, syntaxin (1-262) was maintained on the NiNTA through its His6-tag and titrated with sucrose. The spectra displayed two motional components, which varied in population as a function of sucrose concentration. The percentage of each motional population in these spectra was determined by fitting the spectra with the MOMD model (21) as implemented in MultiComponent, a LabVIEW program provided by Dr. Christian Altenbach (University of California, Los Angeles, CA). Additional details regarding the fitting are provided in Fig. S2 of the Supporting Material).
Generation of syntaxin 1a models from distance restraints and simulated annealing
Models for the open configuration of syntaxin 1a were generated using Xplor-NIH (22,23) in a manner similar to that described previously (24). Briefly, the spin-label side-chain R1 was appended to the crystal structure of syntaxin 1a at appropriate locations and a restraint was applied to each spin label so that the Cα proton–Sδ distance was 2.6 ± 0.1 Å. This restraint places the label in conformations that have been observed experimentally (25,26). The long, open distances between H3 and Habc obtained from analysis of the DEER data were chosen as restraints and included a range that represented 2/3 of a standard deviation (SD) in the distribution. Simulated annealing was performed using these restrains while allowing all side chains to be free, including R1, and allowing the region that connects the H3 and Habc segments (residues 157–189) to be flexible. The backbone atoms of the H3 and Habc regions were fixed. Structures were visualized and analyzed with the program PyMOL (DeLano Scientific LLC, Palo Alto, CA).
Results
Oligomerization of syntaxin (1-262)
Syntaxin 1a has a tendency to oligomerize through its H3 domain ((27,28), and the syntaxin (1-262) fragment used here was examined to determine under what conditions it oligomerizes or is monomeric in solution. Two different approaches, dynamic light scattering (DLS) and NMR, were used to examine the effective hydrodynamic radius of syntaxin (1-262). Under conditions of moderate or low ionic strength, both DLS and the one-dimensional TRACT experiment (29) yielded an effective hydrodynamic radius of ∼2.5–3 nm. These data (see Fig. S1) are consistent with the expected behavior of the syntaxin monomer, but do not rule out the presence of some oligomer. Pulse EPR is sensitive to the formation of specific oligomers (dimer or trimer) and the formation of larger aggregates (30). Relaxation-time measurements indicated that larger aggregates did not occur in these samples, and under conditions of low salt, no significant coherent dipolar interactions were observed that would indicate oligomerization. However, as observed previously (11), evidence of aggregation was observed at higher protein concentrations and ionic strengths, and appeared as a significant modulation in the DEER signal (Fig. S1). At or below physiological ionic strength and at moderate to low protein concentrations (10–50 μM), the majority of the protein is monomeric, but some level of dimer appears to be present (∼10–25%). Additional data characterizing the sample and quantitating the oligomeric state of syntaxin (1-262) are included in the Supporting Material.
The H3 domain is in conformational exchange between ordered and disordered forms
Shown in Fig. 2 are 10 EPR spectra obtained from single labels at several points along the H3 domain of syntaxin 1a (Fig. 1 c), as well as a region linking H3 to the Habc domain. In almost all cases, the EPR spectra reflect at least two modes of motion of the spin-labeled side-chain R1 (Fig. 1 b). One motional component is characteristic of an unfolded protein segment (labeled m in Fig. 2 a), where the label executes isotropic label motion on the order of ≤1 ns. A second component (indicated by i) results from an R1 side chain that is either in tertiary contact or attached to a folded protein segment. For example, the spectrum from site 210 is a composite of two motional components, where one component (∼35% of the signal) originates from R1 having isotropic motion with a correlation time, τc, of ∼0.6 ns, and the second one (∼65% of the signal) having a τc of 2.7 ns. The slower-moving component is characteristic of that obtained from a dynamic helical region. Similarly, ∼30% of the signals at sites 192 and 228 are characteristic of unfolded protein, and at site 215, the unfolded component represents 10% of the total signal. The EPR spectra at sites 196, 198, and 208 indicate that these labels are in tertiary contact with ≤5% of the signal originating from an unstructured or dynamic protein backbone. These three labels are at sites that are expected to be in tertiary contact based upon the closed state as defined by the sytaxin1a/Munc18-1 crystal structure (PDB ID: 3C98) shown in Fig. 1 c. Additional details regarding simulations of these EPR spectra are provided in Fig. S2.
Figure 2.
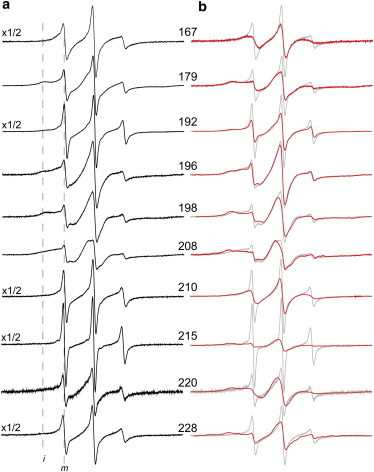
(a and b) X-band EPR spectra for selected sites in the Habc/H3 linker and along the H3 segment of syntaxin (1-262) in solution (a) and in the presence or absence (gray traces) of 30% sucrose (b). Many of the spectra result from R1 labels having at least two motional components, and the position of hyperfine resonances that result from mobile (m) and immobile (i) R1 side chains is indicated. The presence of sucrose alters the populations of these components, indicating that a protein conformational equilibrium is the source of these components. Spectra were recorded at concentrations ranging from 10 to 100 μM in 139 mM KCl, 12 mM NaCl, 20 mM MOPS, pH = 7.3. The spectra are 100 Gauss scans and have been normalized to total spin number.
The multiple modes of R1 motion seen in Fig. 2 a may arise either from different rotameric states of the R1 side chain or from two different protein conformations. One approach to establish the source of these motional components is to examine the EPR spectra in the presence of a stabilizing osmolyte, such as sucrose. Osmolytes will alter the energetics between conformers that have different solvent exposures (16), but they will not alter R1 rotameric equilibria (17). As can be seen in Fig. 2 b, sucrose addition alters the EPR spectra at most positions to populate the less-mobile component, and these changes are reversible upon removal of sucrose. This result indicates that the motional components seen in these EPR spectra represent different protein conformations, and that these conformations are in equilibrium.
EPR spectra for five positions along the H3 domain were titrated as a function of sucrose, and the equilibrium constant was determined at each point assuming a two-state model in which the label is responding to both folded and unfolded protein conformations. From the equilibrium constant, the conformational free energy was plotted as a function of sucrose concentration and yielded a linear dependence as would expected for a two-state conformational transition (see Fig. S3). The slopes of these plots are similar, indicating that the hydrated surface area change that occurs along this length of the H3 domain is similar (31). Several titrations with sucrose were carried out for syntaxin (1-262) attached to beads. These yielded similar spectral changes, indicating that the structural changes produced by sucrose for the syntaxin (1-262) construct were not the result of protein oligomerization (Fig. S3)
These EPR spectra reveal several features of the H3 segment. First, the effects of sucrose demonstrate that the H3 segment and the linker connecting H3 with Habc are in conformational exchange. Second, labels at exposed helical surfaces in the crystal structure (sites 167, 192, 210, and 228) indicate that H3 is in equilibrium between folded and unfolded forms but is dominated by a folded form. Finally, sites in which the EPR spectra reflect tertiary contact of the R1 side chain (e.g., sites 198, 208, and 215) are in contact with the Habc segment in the crystal structure, suggesting that these regions of the H3 segment are closely associated with the Habc domain. This indicates that syntaxin 1a does not spend a significant fraction of time in an open configuration where the H3 segment is significantly displaced from the Habc segment in the absence of Munc18.
Munc18 induces an ordering in the H3 segment and allosterically modulates the configuration of H3
EPR spectra from several sites within and outside the H3 segment are shown in Fig. 3 a in the absence and presence of Munc18. Shown in Fig. 3 b are the scaled mobilities (Ms) for these spectra, which provide a relative measure of R1 side-chain motion (see legend to Fig. 3). The addition of Munc18 reduces the motional averaging of labels along H3. The R1 side chain at sites 220 and 228 should interact with Munc18, and the reduction in motion, particularly at site 228, is consistent with this expectation. Spectra from sites C-terminal to the Munc18-binding region (sites 247, 254, and 259) are not strongly modulated by Munc18 binding and the line shapes are characteristic of a disordered protein segment. At sites that should contact the Habc domain in the closed state (sites 198, 208, and 215), Munc18 binding results in the appearance of wide, well-resolved hyperfine features consistent with the formation of a compact closed state of syntaxin. Site 210 is an exposed helical site in the crystal structure, and the bound EPR spectrum is consistent with spectra that are obtained from helical sites, indicating that Munc18 increases helical content at this site. At site 192, which is remote from the Munc18-binding site, the EPR spectra show that Munc18 induces folding at this site and increases the fraction of 192R1 that is in contact with the H3/Habc linker region. This result suggests that the N-terminal region of the H3 domain of syntaxin is allosterically modulated by Munc18, a process that may be important for regulating the assembly of syntaxin into the SNARE complex.
Figure 3.
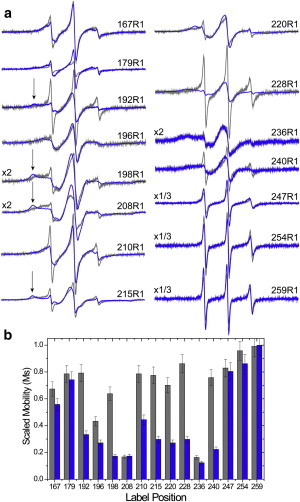
(a) X-band EPR spectra for sites along the H3 segment in the absence (gray traces) and presence of Munc18-1. The arrows indicate the position of well-resolved components of the hyperfine interaction, which result from immobilization of the labeled side chain on a timescale of tens of nanoseconds. R1-labeled syntaxin (1-262) was used at concentrations of 10–40 μM in 139 mM KCl, 12 mM NaCl, 20 mM MOPS, pH = 7.3. The spectra are 100 Gauss scans and have been normalized to total spin number. (b) Scaled mobilities (Ms), determined from the spectra in panel a as described previously (35), range from 0 to 1, where 0 represents the least mobile and 1 represents the most mobile spectra seen in proteins (gray bars in the absence of Munc18-1). The values of Ms are primarily dependent upon the correlation time of the label (36), and in multicomponent spectra, such as those shown here, the mobile lineshape will tend to dominate Ms.
The central portion of H3 is closely associated with the Habc domain even in the absence of Munc18
The EPR spectra in Fig. 2 indicate that the H3 domain is in contact with the Habc domain in the absence of Munc18. To confirm that this is the case, and to determine what fraction of the H3 segment might be dissociated from the Habc domain (in an open configuration), we used DEER to measure dipolar interactions between pairs of labels, with one label being placed within the H3 segment and the other within the Habc domain. The spin pairs, which are shown in Fig. 4 a, were chosen so that the label would have minimal interference with the closed state of syntaxin. Using the four-pulse DEER experiment (19), we determined the distances and distance distributions for five spin pairs. Shown in Fig. 4, b and c, are data for two of these spin pairs, 52R1/210R1 and 105R1/226R1, and a summary of the data is presented in Table 1.
Figure 4.
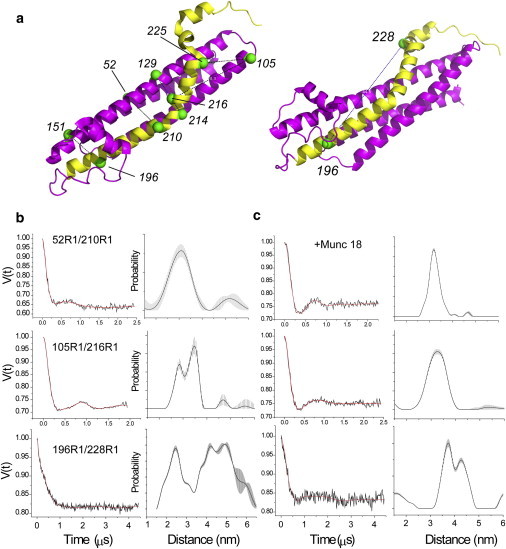
DEER data for three spin pairs in syntaxin 1a (1-262). (a) Crystal structure of syntaxin 1a from the Munc18-1/syntaxin 1a crystal structure (PDB ID: 3C98), showing the positions of six spin pairs examined here. One spin pair (196R1/228R1) is positioned along the H3 segment. (b) DEER signals and distance distributions for syntaxin 1a in solution, where the red traces represent the best fits to the dipolar evolution that was used to generate the distribution. (c) DEER signals for the same spin pairs shown in panel b in the presence of Munc18-1. The shaded regions in the probability distributions represent the range of solutions that can be achieved by variation of background subtraction (due to intermolecular spin interactions). These include all fits having root mean-square deviation values within 15% of the best fit. These double-R1-labeled syntaxin (1-262) mutants were used at a concentration of 40 μM in 139 mM KCl, 12 mM NaCl, 20 mM MOPS, pH = 7.3.
Table 1.
Distances and distance distributions (in angstroms), and populations measured using DEER between the H3 and Habc domains in syntaxin 1A (1-262)
| Syntaxin |
Syntaxin + Munc18 |
|||
|---|---|---|---|---|
| Major | Minor | Major | Minor | |
| Syx 151R1/196R1 | 23, σ 3.1 | 34, σ 2.5 (14%) 45, σ 2.0 (12%) | 25, σ 3.0 | 37, σ 2.0 (13%) 45, σ 1.9 (10%) |
| Syx 52R1/R210R1 | 30, σ 8.8 | 49, σ 5.1 (11%) | 32, σ 4.6 | 46, σ 3 (2%) |
| Syx 129R1/214R1 | 25, σ 8 | 45, σ 1.8 (10%) | 25, σ 6 | 44, σ 5 (5%) |
| Syx 105R1/216R1 | 35, σ 3.6 (65%) | 47, σ 3 (6%) | 32, σ 7 | – |
| 29, σ 4.4 (33%) | ||||
| Syx 105R1/225R1 | 20, σ 7 (44%) | 45, σ 3 (10%) | <20 | – |
| 28, σ 5 (22%) | ||||
| 35, σ 6 (20%) | ||||
The distributions, σ, represent the SD in the width of the distribution. The percentages of spins at each distance are given in parentheses and were determined by integration of the probability distribution.
The spin pair 52R1/210R1 places two labels on exposed helical surface sites so that the interspin vector bridges between the central portions of the H3 and Habc domains. As shown in Fig. 4 b, the DEER signal yields one major distance with a broad distribution centered at ∼32 Å and a minor distance at 49 Å that represents 11% of the signal. The broad distribution at 32 Å suggests that the H3 segment is conformationally heterogeneous, a result that is consistent with the continuous-wave spectra from 210R1 (Fig. 2). If the spin labels are placed into the crystal structure and the dihedral angles χ1, χ2, and χ3 (Fig. 1 b) are adjusted to those expected for a helical surface site (25), the spin-spin distance for 52R1/210R1 varies from 27 to 32 Å as a result of rotations about χ4 and χ5. Thus, the central region of the H3 segment assumes a configuration similar to that observed in the syntaxin1a/Munc18 crystal structure, and only a minor population of syntaxin is open. This result is similar to that seen for the 151R1/196R1 and 129R1/214R1 spin pairs. For the two spin pairs located closer to the C-terminal end of H3, more heterogeneity is observed. The spin pair 105R1/216R1 (Fig. 4 b and Table 1) exhibits two shorter distances where the major distance is centered at 35 Å, and a longer distance component at 47 Å, which represents ∼6% of the total interacting spin population. In the crystal structure of the closed state, this labeled pair is separated by ∼32–34 Å. The spin pair 105R1/225R1 also exhibits a range of distances from 20 to 35 Å (Table 1), with one minor population centered near 45 Å. Thus, the results of these distance measurements indicate that there is heterogeneity in the position of the H3 segment in the syntaxin 1a structure, particularly at the C-terminal end; however, H3 remains closely associated with the Habc domain and only a minor population of H3 (∼10%) is significantly dissociated from the regulatory domain in the absence of Munc18.
The DEER experiment was repeated over a range of syntaxin concentrations and under conditions in which intermolecular dipolar interactions between single-labeled syntaxin are not detected. Under low-salt conditions and at concentrations ranging from 2 μM to 7 μM, dilution of the double-spin-labeled protein with unlabeled protein produced no significant change in the distance distribution between spins (see Fig. S4). However, under conditions that promote oligomerization (i.e., increasing ionic strength and protein concentration), the modulation depth in the DEER signal was effectively eliminated in the diluted system. This indicates that in the oligomerized state the interspin distances between labels on the H3 motif and the Habc domain are long and are effectively indistinguishable from the intermolecular background. Thus, the minor longer distances observed in Table 1 are not the result of oligomerization, but reflect an intrinsic tendency of the H3 motif to dissociate from the Habc domain in the syntaxin monomer. It should be noted that there is no evidence that longer distances that might appear as background are being obscured from DEER traces such as those shown in Fig. 4. The modulation depths (the amplitudes of the DEER signals once background is subtracted) are close to what would be expected if all spin pairs were included in the distribution, and the modulation depths do not change when Munc18 is bound to syntaxin, which should eliminate any significant open population (see below).
DEER experiments are typically carried out in frozen glasses, and the sample is taken to low temperature and a cryoprotectant (in this case glycerol) is added. We carried out a series of experiments to determine whether the addition of glycerol, which is an osmolyte, might have altered the result. We repeated the DEER experiment using glycerol concentrations that ranged from 5% to 50% w/v, and at the lower concentrations used here (5–20%) we found no effect on the distance or distribution. However, the addition of high glycerol concentrations (50% w/v) suppressed the minor long-distance component. This is consistent with the existence of an equilibrium between open and closed states of syntaxin (17), and the known effects of glycerol as a stabilizing osmolyte (31–33).
Munc18-1 abolishes the minor open form of syntaxin 1a and straightens the H3 segment
The DEER measurements described above were repeated with the addition of Munc18-1. The results shown in Fig. 4 c for the 52R1/210R1 and 105R1/226R1 spin-labeled pairs are typical of those obtained at most sites: the primary distance is narrowed and the minor longer distance is effectively eliminated. One exception is the 151R1/196R1 spin pair, which is more distal from the Munc18-binding region. At this site, the minor longer distance was not significantly affected by the addition of Munc18 (see Table 1). The major distances observed in the presence of Munc18 (Table 1) are consistent with the crystal structure of the syntaxin1a/Munc18 complex.
We also made one measurement between sites 196 and 228, which lies across the length of the H3 segment, in the absence and presence of Munc18 (Fig. 4, b and c, respectively). As can be seen in Fig. 4 b, the interspin distances obtained for 196R1/228R1 have a remarkably wide distribution, with mean distances ranging from 24 to 49 Å. This indicates that the H3 domain must assume some configurations that are substantially bent. These highly bent configurations could result from the fraction of protein that appears to be disordered in the continuous-wave spectra (Fig. 2). Upon addition of Munc18, the dipolar evolution produces a clear oscillation, which yields a narrower distribution with two main peaks. The longer peak at 42 Å is close to the Cβ–Cβ distance of 44 Å in the crystal structure, and an examination of the likely rotameric states of R1 indicates that the two distances could correspond to two different rotamers of R1.
The equilibrium between open and closed forms of syntaxin 1a is shifted toward the open state in membrane-associated full-length syntaxin
In the soluble form of syntaxin without the transmembrane linker (residues 1–262), the H3 segment remains closely associated with the Habc domain. We examined the state of the H3 domain in full-length syntaxin 1a (residues 1–288) reconstituted into POPC/POPS (3:1) vesicles with DEER for several of the spin pairs described above. Shown in Fig. 5 a are DEER signals and distributions for 52R1/210R1. For this spin pair, ∼11% of syntaxin is in an open configuration in solution, and this open state increases to ∼40% in the full-length protein. The same trend is seen for other spin pairs where the equilibrium is shifted toward the open state by approximately a factor of 3–4. As seen for the soluble fragment, addition of Munc18 suppresses the long-distance component and narrows the distance distribution (Fig. 5 b). It should be noted that on the membrane interface we do not detect dipolar interactions between single spin-labeled syntaxin (indicating oligomerization); thus, the more-open state on these bilayers is not driven by oligomerization. In addition to POPC/POPS, full-length protein was also reconstituted into bilayers of pure POPC. The result obtained in POPC is identical to that obtained in POPC/POPS, indicating that the presence of acidic lipid does not play a role in stabilizing the more-open conformation.
Figure 5.
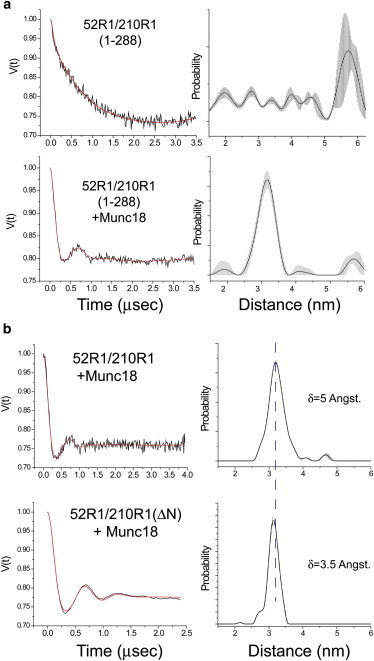
(a) DEER data (left panel) and corresponding distance distributions (right panel) for the spin pair 52R1/210R1 in full-length syntaxin 1a (1-288) that is reconstituted into POPC/POPS (3:1) lipid vesicles at a protein/lipid molar ratio of 1:1000. Data were obtained in the absence (upper panel) presence (lower panel) of Munc18-1. Syntaxin (1-288) was used at a concentration of 100 μM in 140 mM NaCl, 2.7 mM KCl, 12 mM phosphate buffer, pH = 7.3. (b) DEER data and distributions for 52R1/210R1 in soluble syntaxin that includes the N-terminal segment (1-262, upper panel) or has the N-terminal segment deleted (27-262 or ΔN, lower panel). The half-maximal widths of each distribution are shown. The shaded regions in the probability distributions represent the range of solutions that can be achieved by variation of background subtraction (due to intermolecular spin interactions). Syntaxin (1-262) was used at a concentration of 40 μM in 140 mM NaCl, 2.7 mM KCl, 12 mM phosphate buffer, pH = 7.3. The solid (or red) traces on the DEER data are the fits that yield the corresponding distributions.
Deletion of an N-terminal segment of syntaxin 1a has minor effects on the ability of Munc18 to close the syntaxin 1a structure
Measurements obtained using diffraction show that Munc18 fails to close the soluble syntaxin 1a fragment (1-262) but will close a syntaxin fragment lacking an N-terminal segment. To determine whether this segment alters the ability of Munc18 to produce a closed state in syntaxin, we performed DEER measurements across the H3 and Habc domains in syntaxin 27-262 and compared them with measurements for the intact soluble syntaxin fragment (1-262). The comparison in distributions between soluble syntaxin with and without the N-terminal 26 residues for 52R1/210R1 is shown in Fig. 5 b. As can be seen in this figure, the two distributions obtained for the syntaxin 1a/Munc18-1 complex are very similar, with nearly identical mean distances. Removal of the N-terminal segment produces a small but significant narrowing of the distance distribution, decreasing the width of the distribution from 5 to 3.5 Å. This narrowing of the distribution can be seen in the primary DEER data as an additional oscillation in the dipolar evolution.
Structure of the open form of syntaxin 1a determined using EPR-derived distance constraints and simulated annealing
As indicated above, the dominant mean short distances determined by DEER are consistent with the crystal structure of the syntaxin 1a/Munc18-1 complex. To generate an approximate model for the open state of syntaxin 1a, we took the minor long distances in Table 1 and used them as constraints in a series of simulated annealing trials using Xplor-NIH, where the spin-labeled side chain R1 was modeled into appropriate sites in the syntaxin 1a structure. Although the H3 segment is more disordered in the absence than in the presence of Munc18, we held H3 in a helical configuration consistent with the syntaxin/Munc18 crystal structure and allowed the linker connecting H3 to the Habc domain to be flexible (residues 157–189). The details of the simulated annealing are described in Materials and Methods. Shown in Fig. 6 are the five lowest-energy structures obtained by simulated annealing, where each structure is aligned to the Habc domain. The EPR-derived distance restraints are satisfied in each of these structures. In this open structure, the backbone atoms in the H3 domain are positioned ∼35 Å from the Habc domain, and the H3 domain in these structures is splayed over an arc on one side of the Habc domain. It should be noted that the H3 segment is likely to be more much disordered than the representation shown in Fig. 6. In addition, variability in the linker joining H3 and Habc may be due in part to the fact that there are no restraints for this region, which is underdetermined.
Figure 6.
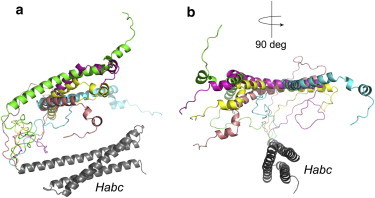
Model for the open state of syntaxin 1a (1-266) obtained by simulated annealing using the long-range distance restraints obtained by DEER (see Table 1). (a and b) The five lowest-energy structures are shown, with views rotated by 90°.
Discussion
The data presented here reveal the dynamics and conformations of sytaxin 1a in the presence and absence of Munc18-1. EPR spectroscopy indicates that the H3 segment of syntaxin is in conformational exchange between ordered and disordered states, each of which has a significant population. As a result, the H3 segment is neither a single uniform helical segment nor a completely disordered segment in the presence of the Habc domain. When distances are measured across the H3 and Habc regions in syntaxin 1a (1-262), the central portion of H3 is closely associated with the Habc domain and the configuration of syntaxin is predominantly closed.
Assembly of the SNARE complex is generally believed to occur in an N- to C-terminal direction along the SNARE motif (2), and the closed state of syntaxin is thought to inhibit assembly because the H3 segment is interacting with the Habc domain and is not available to interact with the other SNARE partners, such as SNAP25 and synaptobrevin. The data presented here indicate that both local fluctuations along H3 and an open-closed equilibrium take place. Local fluctuations along H3, especially near the N-terminal end of the H3 segment, may help promote interactions with other SNAREs and will occur even though the structure is approximately closed. In solution, assembly of the SNARE complex is inhibited by Munc18-1 (6), and this may be due in part to increased order along the H3 segment, which limits encounters between the N-terminal end of the H3 motif and the other SNARE partners. The limitation or regulation of dynamic transitions at the N-terminal end of syntaxin is likely to be an important regulator of SNARE assembly, and will modify encounters between syntaxin and other SNARE partners (14,15). The effect of Munc18 resembles that of other allosteric processes that control protein conformational equilibria and appear to be important in regulating protein-protein interactions.
As shown in Table 1 and Fig. 4, the EPR data indicate that syntaxin (1-262) is largely in a closed configuration. This finding and the observation that the H3 domain is more disordered toward its C-terminus are consistent with a previous NMR study (11), but they present a somewhat different picture than that obtained in a previous study using fluorescence (12), in which the majority of the H3 domain was found to be dissociated from the Habc domain. The reasons for the differences between our results and the earlier fluorescence result are not entirely clear, but the open and closed states of syntaxin are in equilibrium and must be relatively close in energy. As a result, relatively minor shifts in energy, perhaps due to experimental conditions, different protein constructs, or probe incorporation, may have altered the open/closed populations.
The EPR data indicate that Munc18 binding has two effects: it shifts the conformational equilibria along H3 toward the more ordered state, and it suppresses the open configuration of syntaxin. Structural restraints obtained from EPR in the presence of Munc18 are consistent with the closed state defined by the crystal structure (6,7), and with the results obtained from single-molecule fluorescence resonance energy transfer and NMR (11,12). These results contrast with recent work using cross-linking and solution scattering, which indicated that syntaxin 1a does not assume a closed configuration upon Munc18-1 binding unless an N-terminal syntaxin peptide is removed (13). The source of these differences is not clear. Measurements made here in the presence and absence of the N-terminal peptide (Fig. 5 b) indicate that the only difference is a narrowing in the distance distribution measured between the H3 and Habc domains, but both forms (with or without the N-terminal segment) are dominated by a mean distance corresponding to the closed form in the presence of Munc18. In the previous scattering study (13), Munc18 was prepared using a baculovirus-infected insect cell line rather than a bacterial expression system, and conceivably differences in the protein preparation used could explain some of the discrepancies.
As shown in Fig. 5 a, the fraction of open syntaxin is enhanced in the full-length membrane-associated protein. In full-length protein, Munc18 produces a dramatic shift in populations from an open to a closed configuration. The source of this difference when compared with the soluble form is not entirely clear, but transient interactions of the H3 domain with the membrane or steric interference due to the membrane interface might alter the open-closed equilibrium in syntaxin. The juxta-membrane region of syntaxin is highly basic and is found to associate with the membrane interface (34); however, electrostatic interactions with the protein interface require acidic lipid, which does not appear to be playing a role in promoting the open state. The greater fraction of open state in full-length syntaxin might result from oligomerization of the H3 segment due to an increased local concentration of syntaxin on the membrane interface; however, we did not find evidence for enhanced aggregation on the membrane surface at the lipid/protein ratios used here. On the bilayer, the open state is increased by a factor of ∼3, and for 52R1/210R1 the conformational energy difference between solution and bilayer is estimated to be 0.8–0.9 kcal/mole. These results indicate that measurements of syntaxin dynamics and conformational equilibria, which are likely critical for directing assembly of the SNARE complex, are highly context dependent, and that measurements in a native bilayer environment may be necessary to establish the equilibria and interactions that are important for neuronal fusion.
In summary, the H3 or SNARE-forming segment of syntaxin 1a is in equilibrium between ordered and disordered forms, and the H3 segment remains closely associated with the Habc domain in the soluble syntaxin construct. A minor open population is observed where the H3 domain is dissociated from the Habc domain by ∼35 Å. This open form is more highly populated in full-length syntaxin (1-288) reconstituted into lipid bilayers. An additional open form, where the H3 domain is displaced from the Habc domain by >60 Å, is present when syntaxin 1a is oligomerized. Munc18 binding promotes the closed state of syntaxin and produces a shift to a more ordered, structured state along H3. The structural fluctuations along H3, which are modulated by Munc18, are likely a key dynamic feature that controls assembly of syntaxin into the SNARE complex.
Acknowledgments
We thank Dr. Jeffrey Ellena of the Biomolecular NMR Facility, University of Virginia, for help with the TRACT measurements.
This work was supported by a grant from the National Institutes of Health (NIGMS GM072694).
Supporting Material
References
- 1.Hong W. SNAREs and traffic. Biochim. Biophys. Acta. 2005;1744:493–517. [PubMed] [Google Scholar]
- 2.Jahn R., Scheller R.H. SNAREs—engines for membrane fusion. Nat. Rev. 2006;7:631–643. doi: 10.1038/nrm2002. [DOI] [PubMed] [Google Scholar]
- 3.Rizo J., Südhof T.C. Snares and Munc18 in synaptic vesicle fusion. Nat. Rev. Neurosci. 2002;3:641–653. doi: 10.1038/nrn898. [DOI] [PubMed] [Google Scholar]
- 4.Toonen R.F., Verhage M. Munc18-1 in secretion: lonely Munc joins SNARE team and takes control. Trends Neurosci. 2007;30:564–572. doi: 10.1016/j.tins.2007.08.008. [DOI] [PubMed] [Google Scholar]
- 5.Carr C.M., Rizo J. At the junction of SNARE and SM protein function. Curr. Opin. Cell Biol. 2010;22:488–495. doi: 10.1016/j.ceb.2010.04.006. [DOI] [PMC free article] [PubMed] [Google Scholar]
- 6.Burkhardt P., Hattendorf D.A., Fasshauer D. Munc18a controls SNARE assembly through its interaction with the syntaxin N-peptide. EMBO J. 2008;27:923–933. doi: 10.1038/emboj.2008.37. [DOI] [PMC free article] [PubMed] [Google Scholar]
- 7.Misura K.M., Scheller R.H., Weis W.I. Three-dimensional structure of the neuronal-Sec1-syntaxin 1a complex. Nature. 2000;404:355–362. doi: 10.1038/35006120. [DOI] [PubMed] [Google Scholar]
- 8.Dulubova I., Khvotchev M., Rizo J. Munc18-1 binds directly to the neuronal SNARE complex. Proc. Natl. Acad. Sci. USA. 2007;104:2697–2702. doi: 10.1073/pnas.0611318104. [DOI] [PMC free article] [PubMed] [Google Scholar]
- 9.Khvotchev M., Dulubova I., Südhof T.C. Dual modes of Munc18-1/SNARE interactions are coupled by functionally critical binding to syntaxin-1 N terminus. J. Neurosci. 2007;27:12147–12155. doi: 10.1523/JNEUROSCI.3655-07.2007. [DOI] [PMC free article] [PubMed] [Google Scholar]
- 10.Meijer M., Burkhardt P., Verhage M. Munc18-1 mutations that strongly impair SNARE-complex binding support normal synaptic transmission. EMBO J. 2012;31:2156–2168. doi: 10.1038/emboj.2012.72. [DOI] [PMC free article] [PubMed] [Google Scholar]
- 11.Chen X., Lu J., Rizo J. NMR analysis of the closed conformation of syntaxin-1. J. Biomol. NMR. 2008;41:43–54. doi: 10.1007/s10858-008-9239-1. [DOI] [PMC free article] [PubMed] [Google Scholar]
- 12.Margittai M., Widengren J., Seidel C.A. Single-molecule fluorescence resonance energy transfer reveals a dynamic equilibrium between closed and open conformations of syntaxin 1. Proc. Natl. Acad. Sci. USA. 2003;100:15516–15521. doi: 10.1073/pnas.2331232100. [DOI] [PMC free article] [PubMed] [Google Scholar]
- 13.Christie M.P., Whitten A.E., Martin J.L. Low-resolution solution structures of Munc18:Syntaxin protein complexes indicate an open binding mode driven by the Syntaxin N-peptide. Proc. Natl. Acad. Sci. USA. 2012;109:9816–9821. doi: 10.1073/pnas.1116975109. [DOI] [PMC free article] [PubMed] [Google Scholar]
- 14.Mittag T., Kay L.E., Forman-Kay J.D. Protein dynamics and conformational disorder in molecular recognition. J. Mol. Recognit. 2010;23:105–116. doi: 10.1002/jmr.961. [DOI] [PubMed] [Google Scholar]
- 15.Trizac E., Levy Y., Wolynes P.G. Capillarity theory for the fly-casting mechanism. Proc. Natl. Acad. Sci. USA. 2010;107:2746–2750. doi: 10.1073/pnas.0914727107. [DOI] [PMC free article] [PubMed] [Google Scholar]
- 16.Flores Jiménez R.H., Do Cao M.A., Cafiso D.S. Osmolytes modulate conformational exchange in solvent-exposed regions of membrane proteins. Protein Sci. 2010;19:269–278. doi: 10.1002/pro.305. [DOI] [PMC free article] [PubMed] [Google Scholar]
- 17.López C.J., Fleissner M.R., Hubbell W.L. Osmolyte perturbation reveals conformational equilibria in spin-labeled proteins. Protein Sci. 2009;18:1637–1652. doi: 10.1002/pro.180. [DOI] [PMC free article] [PubMed] [Google Scholar]
- 18.McCoy J., Hubbell W.L. High-pressure EPR reveals conformational equilibria and volumetric properties of spin-labeled proteins. Proc. Natl. Acad. Sci. USA. 2011;108:1331–1336. doi: 10.1073/pnas.1017877108. [DOI] [PMC free article] [PubMed] [Google Scholar]
- 19.Pannier M., Veit S., Spiess H.W. Dead-time free measurement of dipole-dipole interactions between electron spins. J. Magn. Reson. 2000;142:331–340. doi: 10.1006/jmre.1999.1944. [DOI] [PubMed] [Google Scholar]
- 20.Jeschke G., Chechik V., Jung H. DeerAnalysis2006 - a comprehensive software package for analyzing pulsed ELDOR data. Appl. Magn. Reson. 2006;30:473–498. [Google Scholar]
- 21.Budil D.E., Lee S., Freed J.H. Nonlinear-least-squares analysis of slow-motion EPR spectra in one and two dimensions using a modified Levenberg-Marquardt algorithm. J. Magn. Reson. A. 1996;120:155–189. [Google Scholar]
- 22.Schwieters C.D., Kuszewski J.J., Clore G.M. Using Xplor-NIH for NMR Molecular Structure Determination. Prog. Nucl. Magn. Reson. Spectrosc. 2006;48:47–62. [Google Scholar]
- 23.Schwieters C.D., Kuszewski J.J., Clore G.M. The Xplor-NIH NMR molecular structure determination package. J. Magn. Reson. 2003;160:65–73. doi: 10.1016/s1090-7807(02)00014-9. [DOI] [PubMed] [Google Scholar]
- 24.Herrick D.Z., Kuo W., Cafiso D.S. Solution and membrane-bound conformations of the tandem C2A and C2B domains of synaptotagmin 1: Evidence for bilayer bridging. J. Mol. Biol. 2009;390:913–923. doi: 10.1016/j.jmb.2009.06.007. [DOI] [PMC free article] [PubMed] [Google Scholar]
- 25.Guo Z., Cascio D., Hubbell W.L. Structural determinants of nitroxide motion in spin-labeled proteins: solvent-exposed sites in helix B of T4 lysozyme. Protein Sci. 2008;17:228–239. doi: 10.1110/ps.073174008. [DOI] [PMC free article] [PubMed] [Google Scholar]
- 26.Guo Z., Cascio D., Hubbell W.L. Structural determinants of nitroxide motion in spin-labeled proteins: tertiary contact and solvent-inaccessible sites in helix G of T4 lysozyme. Protein Sci. 2007;16:1069–1086. doi: 10.1110/ps.062739107. [DOI] [PMC free article] [PubMed] [Google Scholar]
- 27.Lerman J.C., Robblee J., Hughson F.M. Structural analysis of the neuronal SNARE protein syntaxin-1A. Biochemistry. 2000;39:8470–8479. doi: 10.1021/bi0003994. [DOI] [PubMed] [Google Scholar]
- 28.Margittai M., Fasshauer D., Langen R. Homo- and heterooligomeric SNARE complexes studied by site-directed spin labeling. J. Biol. Chem. 2001;276:13169–13177. doi: 10.1074/jbc.M010653200. [DOI] [PubMed] [Google Scholar]
- 29.Lee D., Hilty C., Wüthrich K. Effective rotational correlation times of proteins from NMR relaxation interference. J. Magn. Reson. 2006;178:72–76. doi: 10.1016/j.jmr.2005.08.014. [DOI] [PubMed] [Google Scholar]
- 30.Hilger D., Jung H., Jeschke G. Assessing oligomerization of membrane proteins by four-pulse DEER: pH-dependent dimerization of NhaA Na+/H+ antiporter of E. coli. Biophys. J. 2005;89:1328–1338. doi: 10.1529/biophysj.105.062232. [DOI] [PMC free article] [PubMed] [Google Scholar]
- 31.Parsegian V.A., Rand R.P., Rau D.C. Osmotic stress, crowding, preferential hydration, and binding: A comparison of perspectives. Proc. Natl. Acad. Sci. USA. 2000;97:3987–3992. doi: 10.1073/pnas.97.8.3987. [DOI] [PMC free article] [PubMed] [Google Scholar]
- 32.Rösgen J., Pettitt B.M., Bolen D.W. An analysis of the molecular origin of osmolyte-dependent protein stability. Protein Sci. 2007;16:733–743. doi: 10.1110/ps.062671607. [DOI] [PMC free article] [PubMed] [Google Scholar]
- 33.Timasheff S.N. Protein hydration, thermodynamic binding, and preferential hydration. Biochemistry. 2002;41:13473–13482. doi: 10.1021/bi020316e. [DOI] [PubMed] [Google Scholar]
- 34.Kim C.S., Kweon D.H., Shin Y.K. Membrane topologies of neuronal SNARE folding intermediates. Biochemistry. 2002;41:10928–10933. doi: 10.1021/bi026266v. [DOI] [PubMed] [Google Scholar]
- 35.Columbus L., Hubbell W.L. A new spin on protein dynamics. Trends Biochem. Sci. 2002;27:288–295. doi: 10.1016/s0968-0004(02)02095-9. [DOI] [PubMed] [Google Scholar]
- 36.Columbus L., Hubbell W.L. Mapping backbone dynamics in solution with site-directed spin labeling: GCN4-58 bZip free and bound to DNA. Biochemistry. 2004;43:7273–7287. doi: 10.1021/bi0497906. [DOI] [PubMed] [Google Scholar]
Associated Data
This section collects any data citations, data availability statements, or supplementary materials included in this article.