Abstract
This article reported the high tumor targeting efficacy of RGD peptide labeled near-infrared (NIR) non-cadmium quantum dots (QDs). After using poly(ethylene glycol) to encapsulate InAs/InP/ZnSe QDs (emission maximum at about 800 nm), QD800-PEG dispersed well in PBS buffer with the hydrodynamic diameter (HD) of 15.9 nm and the circulation half-life of ~29 min. After coupling QD800-PEG with arginine–glycine–aspartic acid (RGD) or arginine–alanine–aspartic acid (RAD) peptides, we used nude mice bearing subcutaneous U87MG tumor as models to test tumor-targeted fluorescence imaging. The results indicated that the tumor uptake of QD800-RGD is much higher than those of QD800-PEG and QD800-RAD. The semiquantitative analysis of the region of interest (ROI) showed a high tumor uptake of 10.7 ± 1.5%ID/g in mice injected with QD800-RGD, while the tumor uptakes of QD800-PEG and QD800-RAD were 2.9 ± 0.3%ID/g and 4.0 ± 0.5%ID/g, respectively, indicating the specific tumor targeting of QD800-RGD. The high reproducibility of bioconjunction between QDs and the RGD peptide and the feasibility of QD-RGD bioconjugates as tumor-targeted fluorescence probes warrant the successful application of QDs for in vivo molecular imaging.
INTRODUCTION
The integration of nanotechnology with molecular biology and medicine has resulted in active developments of a new emerging research area-nanobiotechnology (1). This technological innovation, referred to as nanomedicine by the National Institutes of Health (NIH), has great potential to offer exciting and abundant opportunities for discovering new materials, processes, and phenomena in biomedicine. Nanoscale materials have now been widely exploited in many biomedical applications, such as biosensor, disease detection, molecular imaging, and disease treatment (2–7). The basic rationale is that the metal, metal oxide, semiconductor, or self-assembled molecular nanostrucuters have novel properties and functions that are not available from bulk counterparts or individual molecules. One of the most advanced and exciting forefronts of nanobiotechnology is the application of quantum dots (QDs) in biology and medicine (8). After surface functionalization using peptides, proteins, and antibodies, QDs indeed showed great ability to target and detect specific tissues in living subjects by the rapid readout of fluorescence imaging (9–16). Compared with the organic dyes and fluorescent proteins, QDs show many unique optical properties, such as narrow and tunable emission spectra, superior photostability, high quantum yields, and the capacity of simultaneous excitation of multiple fluorescence colors. Moreover, there are many more alternatives in QDs with NIR emission for in vivo imaging than organic dyes, such as CdTe/CdSe (17), InAsxP1-x/InP/ZnSe (18), CuInSe (19), and Cu-doped InP/ZnSe (20) QDs. The QDs emitting at above 700 nm in the NIR region minimize the problems of indigenous fluorescence of tissues and meet the requirements of in vivo biological imaging applications. However, it is reported that Cd-containing QDs indeed showed cytotoxicity under extreme conditions (21, 22). Several studies have shown that QDs may be systemically distributed in organs and tissues. The absorption, distribution, metabolism, and excretion characteristics are highly variable for QDs because of the wide variation in QD physicochemical properties (23–25). For in vivo applications, metabolic clearance of the nanoparticles remains an issue, that is, it is hard to know about how these nanoparticles would be completely cleared out of the body. To avoid such a dilemma, one strategy is to replace the Cd metal by other more benign elements. For example, CuInS2/ZnS core/shell QDs do not contain any Class A elements (Cd, Pb, and Hg) or Class B elements (Se and As) (26), which may show great potential as biocompatible probes for biomedical applications. Recently, carbon dots (C-dots) as new emerging optical probes have aroused research interest because of their nontoxicity compared with semiconductor QDs (27). Another important strategy is the surface coating and modification of QDs, which improve water solubility, stability, and biocompatibility, and assign a desired bioactivity (24). For example, QDs can be coated with hydrophilic poly(ethylene glycol) (PEG) groups or a cross-linked silica shell (8, 28) to render QDs biocompatible and can be further conjugated with bioactive moieties to target specific biologic tissues or cells.
Cancer is a class of diseases in which a number of cells display uncontrolled growth, invasion, and sometimes metastasis. Cell adhesion molecule integrin αvβ3 is a key player in tumor angiogenesis, progression, and spread. Integrin αvβ3 specifically binds the arginine–glycine–aspartic acid (RGD)-containing components in the interstitial matrix (29). Integrins expressed on endothelial cells modulate cell migration and survival during angiogenesis, while integrins expressed on carcinoma cells potentiate metastasis by facilitating the invasion and movement across blood vessels (30). Tumor expression of integrin αvβ3 correlates well with the tumor progression in several malignancies, such as melanoma, glioma, and breast cancer (31–33). In this work, we chose non-cadmium and NIR QDs as the lowtoxic and efficient fluorescence probe to image the integrin αvβ3-positive tumor vasculature in vivo after the surface modification of RGD peptide.
EXPERIMENTAL SECTION
Preparation of QD800-PEG
The synthesis of InAs/InP/ZnSe core/shell/shell QDs (emission maximum at about 800 nm) is similar to that described in the previous publication (34). We used the conjugate of phospholipid and poly(ethylene glycol) (DSPE-PEG2000 amine: 1,2-distearoyl-sn-glycero-3-phosphoethanolamine-N-[amino(polyethylene glycol)-2000], Avanti Polar Lipids, Inc.) to encapsulate QD800 and make the nanoparticles water-dispersible (28, 35). Typically, we mixed assynthesized QD800 (10 nmol) and DSPE-PEG2000 amine (~1.8 μmol) in 200 μL of chloroform and left the container open in a fume hood to evaporate the chloroform solvent slowly at room temperature. The dry sample was pumped under vacuum for about 4 h to remove chloroform completely and then redispersed in water by gentle sonication. The as-prepared QD800-PEG was purified by centrifugation using Millipore (Centrifugal filter devices, 100 K) at 4000 rpm for 20 min to remove the excess amount of DSPE-PEG2000 amine. The final concentration of QD800-PEG in PBS buffer (1×) was about 10 μM ready for further bioconjugation.
Synthesis of QD800-RGD and QD800-RAD
The procedure for surface functionalization of QD800-PEG with amine terminal groups is similar to that used in our previous report with a minor modification (36). We mixed QD800-PEG (1 nmol) and 4-maleimidobutyric acid N-succinimidyl ester (1 μmol) in borate buffer (pH ~8.5) and incubated the mixture at room temperature for about 2 h with gentle shaking. After purification by a NAP-10 column (GE Healthcare Life Sciences), we added thiolated RGD peptide (c(RGDy(ε-acetylthiol)K), denoted as RGD-SH, 1 μmol) (36) into the activated QD800 sample and kept shaking for about 2 h at room temperature. After further purification by the NAP-10 column, we stored the QD800-RGD conjugate in PBS buffer with a concentration of 1 μM ready for animal use. For comparison, we added thiolated RAD peptide (c(RADy(ε-acetylthiol)K), denoted as RAD-SH, 1 μmol) instead to synthesize the QD800-RAD conjugate as a control.
Animal Model
Animal experiments were performed according to a protocol approved by the Stanford University Institutional Animal Care and Use Committee. The U87MG human glioblastoma tumor model was established by subcutaneous injection of U87MG cells (~5 × 10⁶ in 50 μL of PBS) into the front flank of female athymic nude mice (Harlan). The mice were subjected to imaging studies when the tumor volume reached 200–500 mm3 (about 3 weeks after inoculation).
Half-Life Measurement
After the tail vein injection of QD800-PEG (200 pmol) in normal nude mice, we collected blood samples (~15 mg each) at intervals of about 10 min and repeated them about 5 times. The blood samples were mixed with 20 μL of heparin (Sigma-Aldrich) solution (4 units/mL) and subjected to fluorescence imaging immediately using IVIS Imaging System (IVIS 100 Series; Cy5.5 excitation filter, 605–665 nm; ICG emission filter, 800–875 nm). Under the assistance of Living Image software, we recorded the information of the region of interest (ROI) for each blood sample.
In Vivo and Ex Vivo Fluorescence Imaging
After the tail vein injection of QD800-RGD, QD800-PEG, and QD800-RAD (~200 pmol in each mouse), the mice were monitored at multiple time points (e.g., 0.5, 1, 4, 5, 6, 18, and 24 h) using IVIS Imaging System (IVIS 100 Series; Cy5.5 excitation filter, 605–665 nm; ICG emission filter, 800–875 nm). For ex vivo imaging, after the tumors and major organs were harvested, we immediately subjected the tissues to fluorescence imaging using IVIS Imaging System.
Immunofluorescence Staining
After 4 h p.i. of QD800-RGD, QD800-PEG, and QD800-RAD, the mice were sacrificed, and the tumors were harvested and frozen in OCT medium (Sakura Finetek) immediately. The tissues were cut into 5-μm-thick slices using microtome for fluorescence microscopy studies. U87MG tumor frozen tissue slices were fixed in cold acetone for about 10 min and dried in air for about 30 min. The sections were blocked with 10% donkey serum for about 10 min and then incubated with a rat antimouse CD31 monoclonal antibody (1:50; BD BioSciences) for 30 min at room temperature. After incubation with a Cy3-conjugated donkey antirat secondary antibody (1:100; Jackson ImmunoResearch Laboratories, Inc.) for another 30 min, we examined the tumor sections under fluorescence microscopes.
RESULTS AND DISCUSSION
Peptide-Labeled QDs
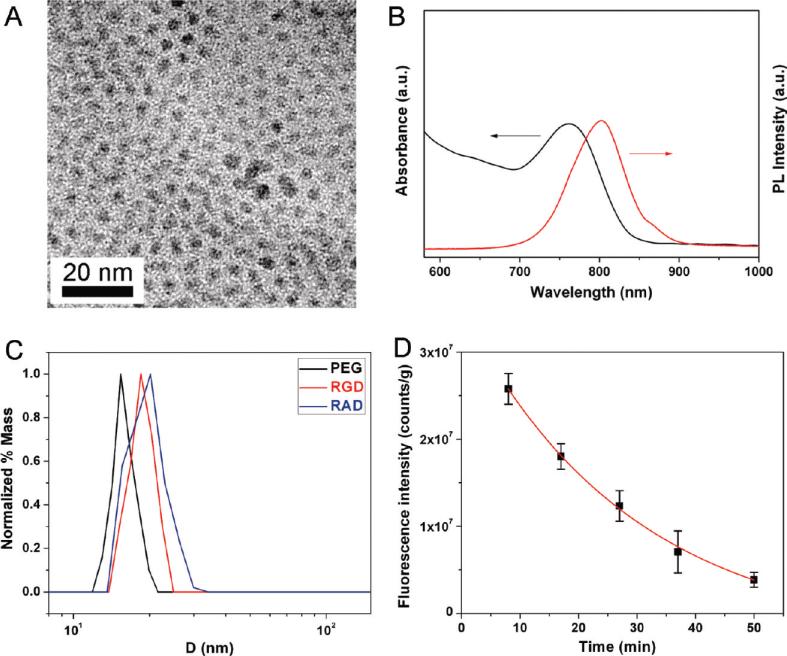
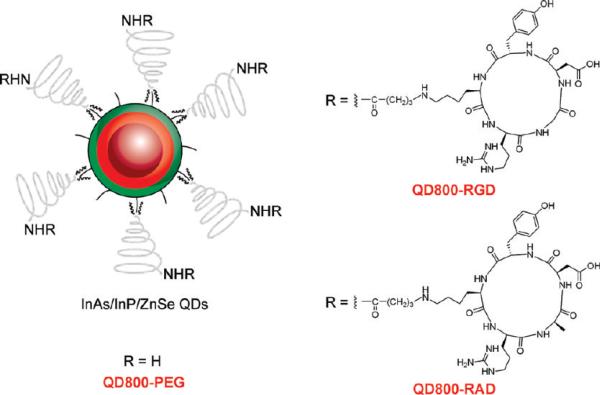
The as-synthesized InAs/InP/ZnSe core/shell/shell QDs (emission maximum at about 800 nm) with TOPO as surfactant only dispersed in nonpolar organic solvents, such as hexane and chloroform (Figure 2A,B). Poly(ethylene glycol) phosphatidylethanolamine (e.g., DSPE-PEG2000 amine) is one kind of micelle-forming hydrophilic polymer-grafted lipids (28). Therefore, the TOPO capped QDs could be encapsulated in the hydrophobic core of this micelle. We used DSPE-PEG2000 amine to coat QDs to make the QDs become water-dispersible and improve their biocompability. The procedure of coating is very facile and highly repeatable. The water-dispersible QD800-PEG (~19% in QY) with an amine terminal group allows further modification and bioconjugation on the surface of nanoparticles. In order to maintain the binding activity of the circle (RGDyK), we used 4-maleimidobutyric acid N-succinimidyl ester as the heterodimeric cross-linker to conjugate QD800-PEG with the thiolated RGD peptide c(RGDy(ε-acethylthiol)K) to yield QD800-RGD (Figure 1). We also conjugated QD800-PEG with the thiolated RAD peptide c(RADy(ε-acethylthiol)K) to produce QD800-RAD as the negative control.
Figure 2.
(A) TEM image and (B) absorbance and fluorescence emission spectra of InAs/InP/ZnSe core/shell/shell nanoparticles dispersed in chloroform, showing that the size of QDs is about 5 nm in diameter with the maximum emission peak at about 800 nm. (C) DLS analysis of QD800-PEG, QD800-RGD, and QD800-RAD with the HDs in PBS buffer of 16.5 nm, 19.6 nm, and 20.1 nm, respectively. (D) Circulation half-life analysis of QD800-PEG in nude mice, showing that the half-life of QD800-PEG is 29.0 ± 9.1 min.
Figure 1.
Structure of QD800-PEG, QD800-RGD, and QD800-RAD.
Analysis of Hydrodynamic Diameter (HD) and Circulation Half-Life
After surface coating and modification, all three samples (QD800-PEG, QD800-RGD, and QD800-RAD) could disperse well in PBS buffer. The absorbance and fluorescence emission spectra indicated that these water-dispersible QD samples maintain the optical properties with an emission maximum at ~800 nm in PBS buffer or 90% mouse serum (Figures S1 and S2, Supporting Information). After incubation of QD samples in mouse serum under typical body temperature (37 °C) for 24 h, over 80% of the emission intensity of QD800-RGD and QD800-RAD remained (Figure S3, Supporting Information), suggesting the good physiological stability of these peptide-labeled QDs. Dynamic light scattering (DLS) analysis showed that the HDs of QD800-PEG, QD800-RGD, and QD800-RAD are about 16.5 nm, 19.6 nm, and 20.1 nm, respectively (Figure 2C). On the basis of the size of these QD samples, the number of amine groups on the surface of each QD800-PEG (60–70 free amine groups) and the maximum ligand conjugation efficiency (40%–50%) (37), we estimated that there are 20–35 RGD peptides or RAD peptides on each peptide-labeled QD. In comparison with the small molecule mercaptopropionic acid (MPA) capped QD800-MPA (about 10 nm in HD) (34), QD800-PEG has a larger size in HD because of polymer coating. After the bioconjugation of RGD or RAD peptides on the surface of nanoparticles, the HDs of nanoparticles were slightly increased. In order to test the circulation half-life of QD800-PEG, we collected the blood samples within 1 h after the tail vein injection of QD particles in nude mice. Following the one-phase exponential decay, the analysis of the decrease in fluorescence intensity (i.e., ROI measurement) per gram of blood sample during blood circulation indicated that the half-life of QD800-PEG is about 29 min (Figure 2D). With the increase of HDs after peptide coupling, we estimated that the half-lives of QD800-RGD and QD800-RAD might be slightly shorter than that of QD800-PEG.
In Vivo Tumor-Targeted Imaging
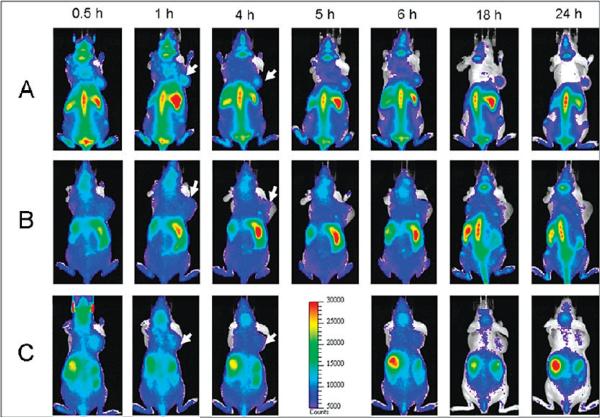
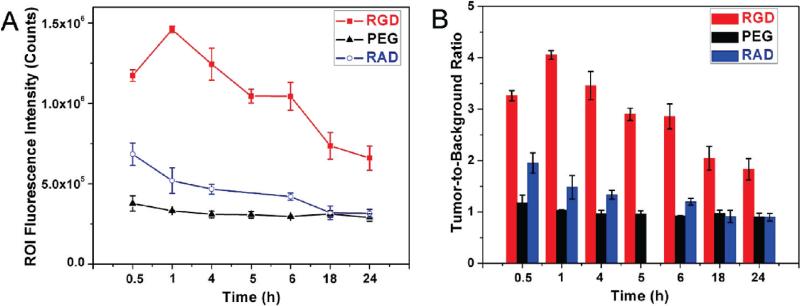
After the preparation of these three samples (QD800-PEG, QD800-RGD, and QD800-RAD) with the final concentration of 1 μM in PBS buffer, we administered intravenous injections (200 μL per mouse) into the athymic nude mice bearing subcutaneous U87MG human glioblastoma tumors. We used an IVIS 100 series to take the fluorescence images at multiple time points (0.5, 1, 4, 5, 6, 18, and 24 h). We set the Cy5.5 excitation filter (615–665 nm) and the ICG emission filter (800–875 nm) to take the fluorescence images with a strong fluorescent signal and low background signal. As shown in Figure 3, as early as 0.5 h postinjection (p.i.), the fluorescence signal derived from QD800-RGD and QD800-RAD both appeared in the tumors. After about 1 h, the tumors were very distinguishable from other tissues with good fluorescence contrast (arrows) in the mice injected with QD800-RGD (Figure 3A), indicating highly specific tumor targeting of QD800-RGD. However, the tumor fluorescence intensity decreased over the time in the mice injected with QD800-RAD (arrows, Figure 3C). We did not observe the tumor contrast in the mice injected with QD800-PEG (Figure 3B). The particularly bright fluorescence from the liver, spleen, and bone marrow reflected the reticuloendothelial system (RES)'s accumulation of QDs at these sites, which accounts for the relatively short half-lives of these QDs. The rapid uptake of QDs by the RES may significantly reduce their half-lives. It is noticed that the tumor contrast was still obvious even after 24 h in the mice injected with QD800-RGD, indicating that the tumor targeting of QD800-RGD induces high retention of QDs in the tumor site, which was further confirmed by the analysis of ROI. Under the assistance of Living Image software, we recorded the information of ROI and computed the statistical data for the ROI measurements. As shown in Figure 4A, after about 1 h p.i. of QD800-RGD, the fluorescence signal of the tumor reached the maximum and then slightly decreased over time (tumor-to-background ratios were 3.26 ± 0.10, 4.26 ± 0.08, 3.46 ± 0.27, 2.90 ± 0.12, 2.85 ± 0.24, 2.04 ± 0.23, and 1.83 ± 0.21 at 0.5, 1, 4, 5, 6, 18, and 24 h p.i., respectively, n = 3/group; Figure 4B), while there was little to no tumor contrast in the mice injected with QD800-PEG or QD800-RAD (Figure 4B).
Figure 3.
In vivo fluorescence imaging of U87MG tumor-bearing mice (arrows) injected with (A) QD800-RGD, (B) QD800-PEG, and (C) QD800-RAD.
Figure 4.
(A) Tumor fluorescence intensity-time and (B) tumor-to-background ratios of mice injected with QD800-RGD, QD800-PEG, and QD800-RAD. The data are represented as mean ± standard deviation (SD), n = 3/group.
Ex Vivo Fluorescence Imaging and Semiquantitative Analysis
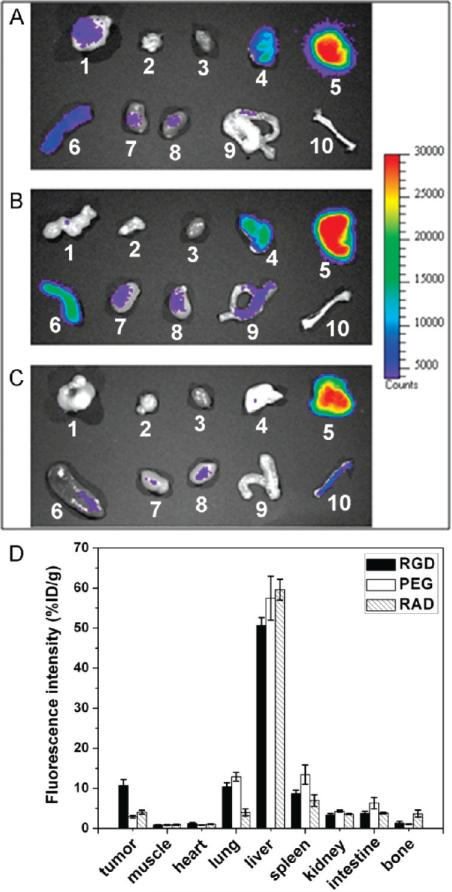
At 4 h p.i., the mice injected with QD800-RGD, QD800-PEG, or QD800-RAD were sacrificed. We collected the tumors and major organs to acquire fluorescence images under the same conditions as those in immediate in vivo imaging. As shown in Figure 5, ex vivo imaging further confirmed the obvious fluorescence signal in the U87MG tumor of mice injected with QD800-RGD (Figure 5A), whereas there was virtually no fluorescence signal in the tumors of mice injected with QD800-PEG or QD800-RAD (Figure 5B,C). Although the fluorescence intensity of the liver was highest among all of the organs, the difference between tumor fluorescence signals indicated that only QD800-RGD has the capability to specifically target and detect the U87MG tumor.
Figure 5.
Ex vivo NIR fluorescence imaging after 4 h p.i. of (A) QD800-RGD, (B) QD800-PEG, and (C) QD800-RAD. In each image 1, U87MG tumor; 2, muscle; 3, heart; 4, lung; 5, liver; 6, spleen; 7, kidney (left); 8, kidney (right); 9, intestine; and 10, bone. (D) ROI analysis of major organs in ex vivo fluorescence imaging after 4 h p.i. of QD800-RGD, QD800-PEG, and QD800-RAD. The data are represented as mean ± standard deviation (SD), n = 3/group.
The fluorescence signal intensity of ex vivo imaging is close to a true reflection of the QDs retained inside the organs because of deep penetration in the NIR region and no antofluorescence in ex vivo images. Then, we performed the ROI analysis on the ex vivo fluorescence images to semiquantitatively study the uptake ratio of QDs in each organ. As shown in Figure 5D, the ROI analysis showed high tumor uptake of 10.7 ± 1.5%ID/g in the mice injected with QD800-RGD, while the tumor uptakes of QD800-PEG and QD800-RAD under the same conditions were 2.9 ± 0.3%ID/g and 4.0 ± 0.5%ID/g, respectively. The semiquantitative ROI analysis further confirmed that QD800-RGD could be an excellent candidate as a probe for tumor-targeted fluorescence imaging. In order to verify the highly specific targeting of QD800-RGD to the integrin αvβ3-positive tumor, we used the LS174T tumor model with very low αvβ3 overexpression (38) as the negative control to do the fluorescence imaging (Figure S4, Supporting Information). The low LS174T tumor uptake of QD800-RGD (~2.8%ID/g at 4 h p.i.) indicated that QD800-RGD specifically targets integrin αvβ3 in living mice.
Histology Study
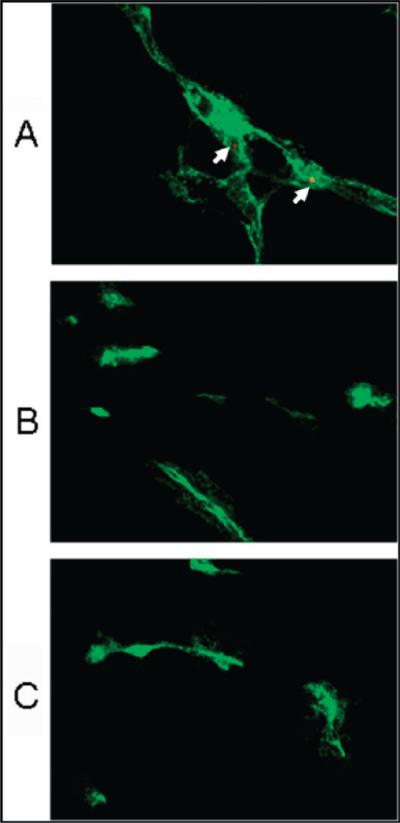
In order to investigate the microscopic localization of QDs in the tumors, CD31 immunostaining of tumor tissue slides would allow the visualization of tumor vasculature. From the fluorescence overlay images (Figure 6), we indeed found the presence of QD800-RGD in the tumor vessels (arrows, Figure 6A) but no QD fluorescence signal in the tumor vessels of mice injected with QD800-PEG or QD800-RAD (Figure 6B,C). The excellent overlay between QD fluorescence and CD31 staining of tumor vessels confirmed that QD800-RGD did not extravasate the tumor vessels, suggesting that these QDs with big size (about 20 nm in HD) could only target vascular integrin but not tumor cell integrin (9, 10, 39). However, the QDs with smaller size (<10 nm in HD) may facilitate extravasation due to the enhanced permeability and retention (EPR) effect, enhance the specific targeting to tumor cells, and minimize the RES uptake (40–43). Indeed, the coating, size, and surface charge of NIR QDs are three key features to influence the in vivo behavior of QDs and should be considered for future designs of QDs as imaging probes for clinical uses (43–45).
Figure 6.
Immunofluorescence staining (CD31, green) of frozen U87MG tumor tissue slices from mice after 4 h p.i. of (A) QD800-RGD, (B) QD800-PEG, or (C) QD800-RAD. Arrows point to QD800-RGD nanoparticles staying within the tumor angiogenic vessel. Magnification: 400×.
CONCLUSIONS
In this work, we have investigated in vivo tumor-targeted fluorescence imaging using QD800-RGD. The QD800-RGD nanoparticles are NIR fluorescent (emission wavelength higher than 750 nm), non-cadmium containing (lower toxic than Cd-based QDs (34)), and specific to target integrin αvβ3. In comparison with QD800-PEG and QD800-RAD, the tumor uptake of QD800-RGD is much higher with good contrast from the surrounding tissues, indicating specific tumor targeting of QD800-RGD. The results shown here, together with our previous work (9, 10, 36), fully demonstrated the reproducibility of bioconjugation between QDs and RGD peptide, the feasibility of QD-RGD bioconjugates as tumor-targeted fluorescence probes, and the possibility of QDs in the applications of molecular imaging and diagnosis.
Supplementary Material
ACKNOWLEDGMENT
This work was partially supported by NCI/NIH R21 CA121842 and U54 CA119367.
Footnotes
Supporting Information Available: Absorbance and fluorescence emission spectra, serum stability, fluorescence imaging, and fluorescence microscopic images. This material is available free of charge via the Internet at http://pubs.acs.org.
LITERATURE CITED
- 1.Whitesides GM. The ‘right’ size in nanobiotechnology. Nat. Biotechnol. 2003;21:1161–1165. doi: 10.1038/nbt872. [DOI] [PubMed] [Google Scholar]
- 2.Rosler A, Vandermeulen GWM, Klok HA. Advanced drug delivery devices via self-assembly of amphiphilic block copolymers. Adv. Drug Delivery Rev. 2001;53:95–108. doi: 10.1016/s0169-409x(01)00222-8. [DOI] [PubMed] [Google Scholar]
- 3.Corot C, Robert P, Idee JM, Port M. Recent advances in iron oxide nanocrystal technology for medical imaging. Adv. Drug Delivery Rev. 2006;58:1471–1504. doi: 10.1016/j.addr.2006.09.013. [DOI] [PubMed] [Google Scholar]
- 4.Cai WB, Chen XY. Nanoplatforms for targeted molecular imaging in living subjects. Small. 2007;3:1840–1854. doi: 10.1002/smll.200700351. [DOI] [PubMed] [Google Scholar]
- 5.McCarthy JR, Weissleder R. Multifunctional magnetic nanoparticles for targeted imaging and therapy. Adv. Drug Delivery Rev. 2008;60:1241–1251. doi: 10.1016/j.addr.2008.03.014. [DOI] [PMC free article] [PubMed] [Google Scholar]
- 6.Gao JH, Xu B. Applications of nanomaterials inside cells. Nano Today. 2009;4:37–51. [Google Scholar]
- 7.Gao JH, Gu HW, Xu B. Multifunctional magnetic nanoparticles: design, synthesis, and biomedical applications. Acc. Chem. Res. 2009;42:1097–1107. doi: 10.1021/ar9000026. [DOI] [PubMed] [Google Scholar]
- 8.Bruchez M, Moronne M, Gin P, Weiss S, Alivisatos AP. Semiconductor nanocrystals as fluorescent biological labels. Science. 1998;281:2013–2016. doi: 10.1126/science.281.5385.2013. [DOI] [PubMed] [Google Scholar]
- 9.Cai WB, Shin DW, Chen K, Gheysens O, Cao QZ, Wang SX, Gambhir SS, Chen XY. Peptide-labeled near-infrared quantum dots for imaging tumor vasculature in living subjects. Nano Lett. 2006;6:669–676. doi: 10.1021/nl052405t. [DOI] [PubMed] [Google Scholar]
- 10.Cai WB, Chen K, Li ZB, Gambhir SS, Chen XY. Dual-function probe for PET and near-infrared fluorescence imaging of tumor vasculature. J. Nucl. Med. 2007;48:1862–1870. doi: 10.2967/jnumed.107.043216. [DOI] [PubMed] [Google Scholar]
- 11.Jayagopal A, Russ PK, Haselton FR. Surface engineering of quantum dots for in vivo vascular Imaging. Bioconjugate Chem. 2007;18:1424–1433. doi: 10.1021/bc070020r. [DOI] [PMC free article] [PubMed] [Google Scholar]
- 12.Diagaradjane P, Orenstein-Cardona JM, Colon-Casasnovas NE, Deorukhkar A, Shentu S, Kuno N, Schwartz DL, Gelovani JG, Krishnan S. Imaging epidermal growth factor receptor expression in vivo: Pharmacokinetic and biodistribution characterization of a bioconjugated quantum dot nanoprobe. Clin. Cancer Res. 2008;14:731–741. doi: 10.1158/1078-0432.CCR-07-1958. [DOI] [PubMed] [Google Scholar]
- 13.Chen K, Li ZB, Wang H, Cai WB, Chen XY. Dual-modality optical and positron emission tomography imaging of vascular endothelial growth factor receptor on tumor vasculature using quantum dots. Eur. J. Nucl. Med. Mol. Imaging. 2008;35:2235–2244. doi: 10.1007/s00259-008-0860-8. [DOI] [PubMed] [Google Scholar]
- 14.Lei Y, Tang H, Yao L, Yu R, Feng M, Zou B. Applications of mesenchymal stem cells labeled with Tat peptide conjugated quantum dots to cell tracking in mouse body. Bioconjugate Chem. 2008;19:421–427. doi: 10.1021/bc0700685. [DOI] [PubMed] [Google Scholar]
- 15.Smith AM, Duan HW, Mohs AM, Nie SM. Bioconjugated quantum dots for in vivo molecular and cellular imaging. Adv. Drug Delivery Rev. 2008;60:1226–1240. doi: 10.1016/j.addr.2008.03.015. [DOI] [PMC free article] [PubMed] [Google Scholar]
- 16.Gao XL, Chen J, Chen JY, Wu BX, Chen HZ, Jiang XG. Quantum dots bearing lectin-functionalized nanoparticles as a platform for in vivo brain imaging. Bioconjugate Chem. 2008;19:2189–2195. doi: 10.1021/bc8002698. [DOI] [PubMed] [Google Scholar]
- 17.Kim S, Lim YT, Soltesz EG, De Grand AM, Lee J, Nakayama A, Parker JA, Mihaljevic T, Laurence RG, Dor DM, Cohn LH, Bawendi MG, Frangioni JV. Near-infrared fluorescent type II quantum dots for sentinel lymph node mapping. Nat. Biotechnol. 2004;22:93–97. doi: 10.1038/nbt920. [DOI] [PMC free article] [PubMed] [Google Scholar]
- 18.Kim SW, Zimmer JP, Ohnishi S, Tracy JB, Frangioni JV, Bawendi MG. Engineering InAsxP1-x/InP/ZnSe III-V alloyed core/shell quantum dots for the near-infrared. J. Am. Chem. Soc. 2005;127:10526–10532. doi: 10.1021/ja0434331. [DOI] [PubMed] [Google Scholar]
- 19.Allen PM, Bawendi MG. Ternary I-III-VI quantum dots luminescent in the red to near-infrared. J. Am. Chem. Soc. 2008;130:9240–9241. doi: 10.1021/ja8036349. [DOI] [PMC free article] [PubMed] [Google Scholar]
- 20.Xie RG, Peng XG. Synthesis of Cu-doped InP nanocrystals (d-dots) with ZnSe diffusion barrier as efficient and color-tunable NIR emitters. J. Am. Chem. Soc. 2009;131:10645–10651. doi: 10.1021/ja903558r. [DOI] [PubMed] [Google Scholar]
- 21.Derfus AM, Chan WCW, Bhatia SN. Probing the cytotoxicity of semiconductor quantum dots. Nano Lett. 2004;4:11–18. doi: 10.1021/nl0347334. [DOI] [PMC free article] [PubMed] [Google Scholar]
- 22.Kirchner C, Liedl T, Kudera S, Pellegrino T, Javier AM, Gaub HE, Stolzle S, Fertig N, Parak WJ. Cytotoxicity of colloidal CdSe and CdSe/ZnS nanoparticles. Nano Lett. 2005;5:331–338. doi: 10.1021/nl047996m. [DOI] [PubMed] [Google Scholar]
- 23.Hoshino A, Fujioka K, Oku T, Suga M, Sasaki YF, Ohta T, Yasuhara M, Suzuki K, Yamamoto K. Physicochemical properties and cellular toxicity of nanocrystal quantum dots depend on their surface modification. Nano Lett. 2004;4:2163–2169. [Google Scholar]
- 24.Hardman R. A toxicologic review of quantum dots: Toxicity depends on physicochemical and environmental factors. Environ. Health Perspect. 2006;114:165–172. doi: 10.1289/ehp.8284. [DOI] [PMC free article] [PubMed] [Google Scholar]
- 25.Lewinski N, Colvin V, Drezek R. Cytotoxicity of nanoparticles. Small. 2008;4:26–49. doi: 10.1002/smll.200700595. [DOI] [PubMed] [Google Scholar]
- 26.Xie RG, Rutherford M, Peng XG. Formation of high-quality I-III-VI semiconductor nanocrystals by tuning relative reactivity of cationic precursors. J. Am. Chem. Soc. 2009;131:5691–5697. doi: 10.1021/ja9005767. [DOI] [PubMed] [Google Scholar]
- 27.Sun YP, Zhou B, Lin Y, Wang W, Fernando KAS, Pathak P, Meziani MJ, Harruff BA, Wang X, Wang HF, Luo PJG, Yang H, Kose ME, Chen BL, Veca LM, Xie SY. Quantum-sized carbon dots for bright and colorful photoluminescence. J. Am. Chem. Soc. 2006;128:7756–7757. doi: 10.1021/ja062677d. [DOI] [PubMed] [Google Scholar]
- 28.Dubertret B, Skourides P, Norris DJ, Noireaux V, Brivanlou AH, Libchaber A. In vivo imaging of quantum dots encapsulated in phospholipid micelles. Science. 2002;298:1759–1762. doi: 10.1126/science.1077194. [DOI] [PubMed] [Google Scholar]
- 29.Xiong JP, Stehle T, Zhang RG, Joachimiak A, Frech M, Goodman SL, Aranout MA. Crystal structure of the extracellular segment of integrin alpha V beta 3 in complex with an Arg-Gly-Asp ligand. Science. 2002;296:151–155. doi: 10.1126/science.1069040. [DOI] [PubMed] [Google Scholar]
- 30.Felding-Habermann B, O'Toole TE, Smith JW, Fransvea E, Ruggeri ZM, Ginsberg MH, Hughes PE, Pampori N, Shattil SJ, Saven A, Mueller BM. Integrin activation controls metastasis in human breast cancer. Proc. Natl. Acad. Sci. U.S.A. 2001;98:1853–1858. doi: 10.1073/pnas.98.4.1853. [DOI] [PMC free article] [PubMed] [Google Scholar]
- 31.Albelda SM, Mette SA, Elder DE, Stewart RM, Damjanovich L, Herlyn M, Buck CA. Integrin distribution in malignant melanoma: association of the beta 3 subunit with tumor progression. Cancer Res. 1990;50:6757–6764. [PubMed] [Google Scholar]
- 32.Kanamori M, Vanden Berg SR, Bergers G, Berger MS, Pieper RO. Integrin beta 3 overexpression suppresses tumor growth in a human model of gliomagenesis: Implications for the role of beta 3 overexpression in glioblastoma multiforme. Cancer Res. 2004;64:2751–2758. doi: 10.1158/0008-5472.can-03-3354. [DOI] [PubMed] [Google Scholar]
- 33.Gasparini G, Brooks PC, Biganzoli E, Vermeulen PB, Bonoldi E, Dirix LY, Ranieri G, Miceli R, Cheresh DA. Vascular integrin alpha(v)beta(3): A new prognostic indicator in breast cancer. Clin. Cancer Res. 1998;4:2625–2634. [PubMed] [Google Scholar]
- 34.Xie RG, Chen K, Chen XY, Peng XG. InAs/InP/ZnSe core/shell/shell quantum dots as near-infrared emitters: bright, narrow-band, non-cadmium containing, and biocompatible. Nano Res. 2008;1:457–464. doi: 10.1007/s12274-008-8048-x. [DOI] [PMC free article] [PubMed] [Google Scholar]
- 35.Carion O, Mahler B, Pons T, Dubertret B. Synthesis, encapsulation, purification and coupling of single quantum dots in phospholipid micelles for their use in cellular and in vivo imaging. Nat. Protoc. 2007;2:2383–2390. doi: 10.1038/nprot.2007.351. [DOI] [PubMed] [Google Scholar]
- 36.Cai WB, Chen XY. Preparation of peptide-conjugated quantum dots for tumor vasculature-targeted imaging. Nat. Protoc. 2008;3:89–96. doi: 10.1038/nprot.2007.478. [DOI] [PubMed] [Google Scholar]
- 37.Gao XH, Cui YY, Levenson RM, Chung LWK, Nie SM. In vivo cancer targeting and imaging with semiconductor quantum dots. Nat. Biotechnol. 2004;22:969–976. doi: 10.1038/nbt994. [DOI] [PubMed] [Google Scholar]
- 38.Su ZF, Liu GZ, Gupta S, Zhu ZH, Rusckowski M, Hnatowich DJ. In vitro and in vivo evaluation of a technetium-99m-labeled cyclic RGD peptide as a specific marker of alpha(V)beta(3) integrin for tumor imaging. Bioconjugate Chem. 2002;13:561–570. doi: 10.1021/bc0155566. [DOI] [PubMed] [Google Scholar]
- 39.Akerman ME, Chan WCW, Laakkonen P, Bhatia SN, Ruoslahti E. Nanocrystal targeting in vivo. Proc. Natl. Acad. Sci. U.S.A. 2002;99:12617–12621. doi: 10.1073/pnas.152463399. [DOI] [PMC free article] [PubMed] [Google Scholar]
- 40.Choi HS, Liu WH, Misra P, Tanaka E, Zimmer JP, Ipe BI, Bawendi MG, Frangioni JV. Renal clearance of quantum dots. Nat. Biotechnol. 2007;25:1165–1170. doi: 10.1038/nbt1340. [DOI] [PMC free article] [PubMed] [Google Scholar]
- 41.Park JH, Gu L, von Maltzahn G, Ruoslahti E, Bhatia SN, Sailor MJ. Biodegradable luminescent porous silicon nanoparticles for in vivo applications. Nat. Mater. 2009;8:331–336. doi: 10.1038/nmat2398. [DOI] [PMC free article] [PubMed] [Google Scholar]
- 42.Gao JH, Chen K, Xie RG, Xie J, Lee S, Cheng Z, Peng XG, Chen XY. Ultrasmall near-infrared non-cadmium quantum dots for in vivo tumor imaging. Small. 2010;6:256–261. doi: 10.1002/smll.200901672. [DOI] [PMC free article] [PubMed] [Google Scholar]
- 43.Choi HS, Liu W, Liu F, Nasr K, Misra P, Bawendi MG, Frangioni JV. Design considerations for tumour-targeted nanoparticles. Nat. Nanotechnol. 2010;5:42–47. doi: 10.1038/nnano.2009.314. [DOI] [PMC free article] [PubMed] [Google Scholar]
- 44.Schipper ML, Cheng Z, Lee SW, Bentolila LA, Iyer G, Rao JH, Chen XY, Wu AM, Weiss S, Gambhir SS. MicroPET-based biodistribution of quantum dots in living mice. J. Nucl. Med. 2007;48:1511–1518. doi: 10.2967/jnumed.107.040071. [DOI] [PMC free article] [PubMed] [Google Scholar]
- 45.Schipper ML, Iyer G, Koh AL, Cheng Z, Ebenstein Y, Aharoni A, Keren S, Bentolila LA, Li JQ, Rao JH, Chen XY, Banin U, Wu AM, Sinclair R, Weiss S, Gambhir SS. Particle size, surface coating, and PEGylation influence the biodistribution of quantum dots in living mice. Small. 2009;5:126–134. doi: 10.1002/smll.200800003. [DOI] [PMC free article] [PubMed] [Google Scholar]
Associated Data
This section collects any data citations, data availability statements, or supplementary materials included in this article.


