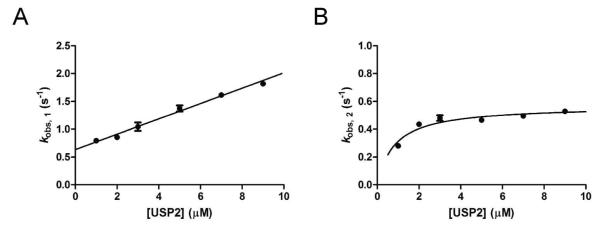
Figure 6.

Concentration dependence of the observed rate constants of K48-linked IQF diubiquitin binding to USP2. In A and B the rate constants kobs, 1 and kobs, 2 determined by fitting the fluorescence data reporting the K48-linked IQF diubiquitin binding to USP2 (see figure 5) were plotted against the concentration of USP2. Individual microscopic binding constants were derived from linear regression analysis of the plot of kobs, 1 (A) and nonlinear curve fitting to a hyperbola of the plot of kobs, 2 (B).
