

Abstract
In spite of a large number of transforming growth factor β1 (TGF-β1)-regulated genes, the nature of its targets with roles in transformation continues to be poorly understood. Here we discovered that TGF-β1 stimulates transcription of metastasis associated protein 1 (MTA1), a dual master coregulator, in epithelial cells, and that MTA1 status is a determinant of TGF-β1-induced epithelial-to-mesenchymal transition phenotypes. In addition, we found that MTA1/Pol II/AP1 coactivator complex interacts with the FosB-gene chromatin and stimulates its transcription, and FosB in-turn, utilizes FosB/HDAC2 complex to repress E-cadherin expression in TGF-β1 stimulated mammary epithelial cells. These findings suggest that TGF-β1 regulates the components of EMT via stimulating the expression of MTA1 which in turn, induces FosB to repress E-cadherin expression and thus, revealed an inherent function of MTA1 as a target and effector of TGF-β1 signaling in epithelial cells.
Keywords: TGF-β1 signaling, MTA1, FosB, target gene transcription, Epithelial to mesenchymal transition
Introduction
Inappropriate Transforming growth factor beta1 (TGF-β1)-signaling has been linked with dedifferentiation, epithelial-mesenchymal transition (EMT), and tumor progression (Condeelis and Segall, 2003; Peinado et al., 2003). During EMT, epithelial cells lose its polarity and repress E-cadherin but express mesenchymal markers such as vimentin and α-smooth muscle actin (α-SMA) (Hugo et al., 2007; Radisky, 2005; Thiery, 2002; Zavadil and Bottinger, 2005). The process of cancer progression involves a rapid modulation of TGF-β1-responsive genes with roles in EMT and metastasis via remodeling of target gene chromatin in response to upstream signals. The TGF-β1-signaling is largely mediated by Smad proteins (Massague et al., 2005) where Smad2 and Smad3 are phosphorylated by TGF-β1-receptors and associate with the common mediator Smad4, which translocates to the nucleus to participate in the expression of TGF-β1-target genes (Deckers et al., 2006). Previous studies have shown that CUTL1, also known as CDP (CCAAT displacement protein), a target of TGF-β1, is needed for its short term effects of TGF-β1 on cell motility involving Smad4 dependent pathway (Michl et al., 2005).
In addition to TGF-β1-signaling, the process of breast cancer progression is profoundly influenced by the levels of metastatic tumor antigen 1 (MTA1), an integral role in nucleosome remodeling and histone deacetylation (NuRD) complex (Manavathi and Kumar, 2007). The MTA1 regulates the transcriptional outcome of its targets due to its ability to modify the acetylation status on the target gene chromatin and thus, controlling accessibility of various coregulators to DNA (Gururaj et al., 2006). In addition of its interaction with histone deacetylases (HDACs) and NuRD complex, it functions as a corepressor on its targets (Mazumdar et al., 2001; Molli et al., 2008), MTA1 also interacts with RNA polymerase II (Pol II) and acts as a coactivator on some targets (Balasenthil et al., 2007; Gururaj et al., 2006). Earlier studies from this and other laboratories have shown that increased MTA1 expression in murine mammary epithelial or tumor cells is associated with not only increased invasiveness but also a reduced expression of E-cadherin, a hallmark of EMT (Dannenmann et al., 2008; Tong et al., 2007; Zhang et al., 2006). However, in spite of an inverse correlation in the levels of MTA1 and E-cadherin in tumor cells, it remains unknown whether TGF-β1-signaling, a known modifier of E-cadherin expression and EMT, require MTA1. Here we examined the role of MTA1 in TGF-β1-signaling and discovered that MTA1 is a target and an essential modifier of TGF-β1-signaling in epithelial cells.
Results
MTA1 is required for TGF-β1-signaling in epithelial cells
In-spite of a widespread up regulation of MTA1 in breast cancer and metastasis, it remains unknown whether MTA1 has any role in EMT, a prerequisite for tumor metastasis. Hence we wished to investigate whether MTA1 plays a role in TGF-β1-induced EMT using HC11 cells as a model system. HC11 cells are mammary epithelial cells with polygonal morphology while TGF-β1 stimulates its trans-differentiation into mesenchymal phenotype with an elongated morphology (Figure 1a) (Radisky, 2005). We found that MTA1-depletion by selective siRNA compromises the ability of TGF-β1 to induce elongated morphology in HC11 cells (Figure 1b). In parallel, MTA1-knockdown also suppressed the effect of TGF-β1 to up regulate α-SMA (Figure 1c) and down regulate epithelial marker E-cadherin (Figure 1c). Furthermore, HC11 cells stably over-expressing MTA1 exhibited a distinct mesenchymal morphology (Figure 1d) as well as downregulation of E-cadherin (Figure 1e). MTA1 over-expression or knockdown in the NMuMG primary mammary cells also modulated the levels of E-cadherin and α-SMA (Figure 1f, g). These findings suggested that MTA1 is a modifier of TGF-β1- signaling and its net levels affect EMT.
Figure 1.
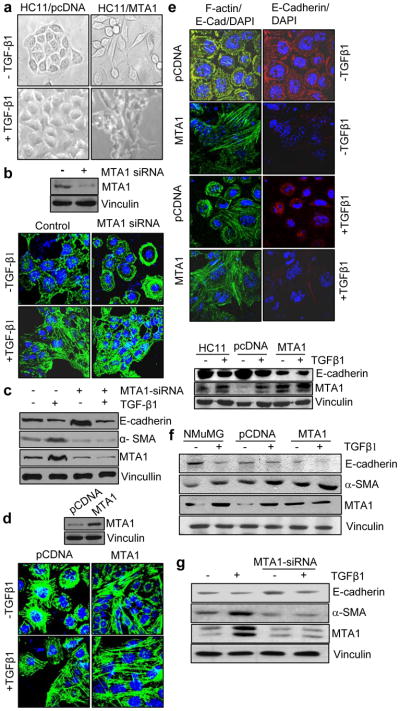
MTA1 induces EMT in the mammary epithelial cells. (a) Bright-phase microscopic analysis of HC11/ pcDNA and HC11/ MTA1 stable clones treated with and without TGF-β1. (b) F-actin staining of HC11 cells transfected with MTA1 siRNA with or without TGFβ1. Upper panel, Western blot analysis for MTA1. (c) Western blot analysis for E-cadherin, α-SMA and MTA1 expression from the cell lysates isolated from HC11 cells treated with MTA1-siRNA in presence and absence of TGF-β1. Vinculin was used as the loading control. (d) F-actin staining of HC11 pcDNA and MTA1 stable clones with and without TGF-β1. Upper panel represents the western blot analysis showing the expression of MTA1 in HC11 pcDNA and MTA1 stable clones. (e) Confocal staining (upper panel) and Western blot analysis (lower panel) for E-cadherin in pcDNA and MTA1 stable clones with and without TGF-β1 treatment. Nucleus is stained with DAPI. (f) Western blot analysis for E-cadherin, α-SMA and MTA1 expression in the cell lyastes of NMuMG (Normal murine mammary gland) cells transfected with pcDNA and MTA1 in presence and absence of TGF-β1. (g) Western blot analysis for E-cadherin and α-SMA expression from the cell lysates of NMuMG cells treated with specific MTA1-siRNA in presence and absence of TGF-β1. NMuMG cells were transfected with control siRNA and MTA1-siRNA. After 48 hrs of transfection cells were serum starved and treated with TGF-β1 for 12 hrs. Cells were harvested and western blot analysis was carried out with specified antibodies. Panels a–g, cells were treated with 2ng/ml of TGF-β1 for 12 hrs.
TGF-β-signaling induces MTA1 expression through CDP
During the course of preceding studies, we consistently noticed that TGF-β1-stimulation of cells accompanies with an increased expression of MTA1 protein (Figure 1c, 1f), raising the hypothesis that MTA1 might be regulated by TGF-β1-signaling. To test this notion, we next treated HC11 cells with TGF-β1 and showed that indeed, TGF-β1 stimulates the level of MTA1 protein and mRNA (Figure 2a,b) and represses the expression of E-cadherin protein (Figure 2a) and that transcriptional inhibitor Actinomycin D substantially reduces the levels of TGF-β1 inducible MTA1 mRNA and protein (Figure 2b, 2c). These findings suggested that MTA1 may be a target of TGF-β1.
Figure 2.

TGF-β1 induces MTA1 expression in HC11 cells. (a) Western blot analysis for MTA1 and E-cadherin proteins from the cell lysates isolated from HC11 cells treated with TGF-β1 (2ng/ml) for 4, 8, 12 and 24 hrs. (b) qPCR analysis of MTA1 mRNA expression in HC11 cells treated with TGF-β1 (2 ng/ml for 12 hrs) in presence and absence of Actinomycin D (250 ng/ml). Cells were treated with Actinomycin D one hour prior to TGF-β1 treatment. Results are presented in-terms of a fold change after normalizing MTA1 mRNA levels with β-actin mRNA. Each value represents the mean of ± S. E. of three independent experiments. (c) Western blot analysis for MTA1 from the cell lysates isolated from HC11 cells treated with TGF-β1 in presence and absence of Actinomycin D (250 ng/ml) (upper panel) and its quantitation using image quant (lower panel). (d) MTA1 promoter (both minimal and full length) activity in HC11 cells treated with TGF-β1 (2ng/ml for 12 hrs). HC11 cells were transfected with murine MTA1-pGL3 luciferase reporter plasmid and pCMVβ vector carrying β-galactosidase gene as an internal control for transfection efficiency. After 36 hrs of transfection cells were serum starved for 14 hrs, treated with TGF-β (2ng/ml for 12 hrs) and luciferase activities in triplicate samples were measured. Results were presented in terms of fold change and the values represent the mean of ± S.E. from three independent transfection experiments. (e) MTA1 promoter activity after cotransfecting with CDP-pMX in presence of TGF-β1 (2ng/ml for 12hrs) in HC11 cells. CDP-pMX plasmid with different concentration (0.25 μg and 1 μg) was transfected along with MTA1-pGL3 luciferase reporter plasmid and promoter luciferase assay was carried out as described in figures legends to 2d. (f) MTA1 promoter activity in TGF-β1 (2ng/ml for 12 hrs) activated HC11 cells with and without CDP knockdown. HC11 cells were transfected with CDP-siRNA and after 36 hrs of transfection MTA1-pGL3 luciferase reporter plasmid and pCMVβ vector carrying β-galactosidase gene were transfected and luciferase assay was carried out as described in figure legend to 2d. (g) Western blot analysis of MTA1, CDP and α-SMA protein expression from the cell lysates of HC11 treated with TGF-β1 (2ng/ml for 12 hrs) after selective knock down of CDP. (h) MTA1 promoter activity in TGF-β1 (2ng/ml for 12hrs) activated HC11 cells with and without Smad4 knockdown. After Smad4 knockdown using Smad4-siRNA, HC11 cells were transfected with MTA1-pGL3 luciferase reporter plasmid following the method described earlier.
MTA1 gene resides on chromosome 14q32.3 locus in human and chromosome 12f1 locus in mouse. To study the TGF-β1 regulation of MTA1 transcription, we cloned the 5 kb promoter region of mouse MTA1 and generated a series of promoter-luc reporter systems (Figure S1a). The MTA1 region of −5200 to −2872 bp upstream to the first ATG showed the maximum potential for promoter like sequence. Both the minimal and full length MTA1 promoter was equally responded to TGF-β1 stimulation (Figure 2d and Figure S1a).
Since MTA1 is involved in promoting tumor invasiveness and motility (Hofer et al., 2004; Mahoney et al., 2002) and is now induced by TGF-β1 (this study), we next performed Transfac analysis of the MTA1 promoter to identify the bindings sites for transcription factors that might be responsive to TGF-β1 signaling and thus, involved in the noted TGF-β1 stimulation of MTA1 transcription. We found that MTA1 promoter harbors binding sites for TGF-β1 related factors CDP, CEBPα and YY1 (Figure S1b and Table S1). CDP is a direct target of TGF-β1 signaling and in-turn, regulates other TGF-β1 responsive genes and promotes tumor cell invasiveness (Michl et al., 2005; Michl and Downward, 2006) while YY1 and CEBPα (CAAT enhancer binding protein) inhibits TGFβ1 signaling (Gery et al., 2005; Kurisaki et al., 2003; Lee et al., 1994; MacLellan et al., 1994). Since TGF-β1 signaling stimulates (and not inhibits) MTA1 transcription, we choose to concentrate on CDP in the subsequent studies.
The presence of seven consensus motifs for CDP on the MTA1 promoter provided clues that MTA1 might be regulated by TGF-β1-responsive transcription factors. We found that transient expression of CDP alone is sufficient to induce MTA1 promoter activity (Figure 2e), suggesting that TGF-β1 may indeed, utilize CDP to stimulate MTA1 transcription (Figure S2a). To validate this finding, we next examined the impact of CDP-knockdown on the ability of TGF-β1 to stimulate MTA1 transcription. We found that CDP-depletion prevents TGF-β1 stimulation of MTA1 promoter activity (Figure 2f). As expected, TGF-β1 stimulates the expression of CDP and α-SMA. Interestingly, CDP-knockdown also abolished the stimulation of the endogenous MTA1 and α-SMA by TGF-β1 (Figure 2g). As Smad4 dependent signaling is involved in the transcriptional regulation of CDP (Michl et al., 2005), we next examined the effect of Smad4-knockdown upon MTA1 transcription. We found that Smad4 depletion prevents the ability of TGF-β1 stimulation of MTA1 transcription (Figure 2h). These results suggest a mechanistic role of CDP in TGF-β1 stimulation of MTA1 transcription.
To gain a deeper insight into the molecular mechanism involved in CDP regulation of MTA1 stimulation, we next mapped the recruitment of CDP to MTA1 promoter by chromatin immunoprecipitation (ChIP). CDP was recruited to regions II, IV, V and VI of the MTA1 promoter (Figure 3a). Interestingly, CDP interaction at these regions was further increased upon TGF-β1 treatment. To further characterize the responsive active sites on MTA1 promoter, we determined the status of acetylated histone H4 at all these regions. We found that TGF-β1 stimulation leads to recruitment of acetylated histone H4 at region IV and VI, suggesting that this could be the functional regions in vivo (Figure 3b). On the other hand, there was no recruitment of acetylated histone H3 onto MTA1 promoter in TGF-β1-stimulated cells (Figure S2b). Sequential double-ChIP analysis involving CDP followed by acetylated H4 antibodies indicated that CDP and acetyl histone H4 are co-recruited only to region VI of MTA1 promoter (Figure 3c).
Figure 3.

TGF-β1 induces MTA1 expression through CDP. (a) Recruitment of CDP on to the mouse MTA1 promoter in HC11 cells treated with TGF-β1. HC11 cells stimulated with TGF-β1 were treated with 1% formaldehyde to cross link the histones to DNA and lysed by sonication, immunoprecipitated either by anti-CDP antibody or IgG antibody. The immunoprecipitants were then collected by adding beads, washed, eluted the DNA from the beads and purified DNA was subjected to PCR (b) Recruitment of Acetyl histone H4 (AcH4) on to mouse MTA1 promoter in HC11 cells treated with TGF-β1. ChIP analysis was carried out with AcH4 antibody as described earlier. (c) Recruitment of CDP followed by AcH4 complex onto MTA1 promoter (−3368 to −3604) by sequential double ChIP assay in HC11 cells treated with TGF-β1. The first ChIP was carried out with anti-CDP antibody followed by second ChIP with anti-AcH4 antibody. (d) EMSA analysis of GST-CDP binding to the binding site 2 (BS2) of region VI of mouse MTA1 promoter in the nuclear extracts prepared from TGF-β1 stimulated HC11 cells. (e) EMSA analysis showing super shift with CDP antibody on BS2 of region VI of mouse MTA1 promoter in the nuclear extract prepared from TGF-β1 stimulated HC11 cells. (f) Recruitment of CDP on to the BS2 of region VI of mouse MTA1 promoter in the nuclear extracts prepared from the HC11 cells treated with TGF-β1. (g) Model diagram showing the requirement of CDP for the induction of MTA1 expression by TGF-β1. Panels a–f, cells were treated with 2ng/ml of TGF-β1 for 12 hrs.
Next we examined whether CDP directly binds to the region VI of MTA1 promoter which harbors two putative sites for CDP. Probes for both sites, designated BS1 and BS2, were used to examine binding to GST-CDP by EMSA. Results indicated that CDP does not bind to region BS1 but effectively binds to region BS2, indicating that BS2 may represent the actual CDP binding site in the region VI of MTA1 promoter (Figure 3d and Figure S2c). Accordingly, results from the nuclear extracts from control and TGF-β1 stimulated HC11 cells revealed the formation of CDP-DNA complex(s) at the BS2 region and the observed complex could be super-shifted by an anti-CDP-Ab but not control IgG (Figure 3e). To further confirm the binding of CDP to the BS2 motif in the region VI in vivo, we performed ChIP for CDP recruitment to these regions using specific primers and found that, indeed, CDP binding sites are limited to the BS2 motif in region VI of MTA1 promoter in TGF-β1 stimulated cells (Figure 3f). These findings suggest that TGF-β1 utilizes CDP to stimulate MTA1 transcription (Figure 3g).
TGF-β1-mediated FosB expression requires MTA1
To understand the physiologic significance of TGF-β1 regulation of MTA1 expression, we next investigated the possibility of a role of MTA1 in TGF-β1 signaling. While these studies were in-progress, results from ongoing, in-house, genome-wide analyses of MTA1 targets in MCF-7 cells using NimbleGen promoter platform revealed that MTA1 might be recruited to genes involved in the TGF-β1 pathway (Table S2). Since previous studies has implicated Fos family genes in TGF-β1induced EMT (Eferl and Wagner, 2003) and because FosB is now being identified as a MTA1 target in our ChIP-on-ChIP analysis (this study), we decided to focus on FosB as a potential MTA1 target and asked whether MTA1 is required for TGF-β1 induction of FosB. We found that both TGF-β1 stimulation as well as MTA1 overexpression alone induces FosB mRNA or protein in HC11 cells (Figure 4a, 4b). Further selective siRNA-mediated knockdown of MTA1 in HC11 cells reduced FosB mRNA and protein (Figure 4c, 4d). Since the outcome of siRNA-mediated knockdown studies is dependent on the extent of target knockdown, we next examined the effect of MTA1-depletion in MEFs (mouse embryonic fibroblasts) from wild-type and MTA1−/− mice treated with TGF-β1. We found that MTA1-deficiency substantially compromised the ability of TGF-β1 to induce FosB protein expression and promoter activity in MEFs (Figure 4e, 4f). Further cotransfection of MTA1 in MTA1−/− MEFs results in increased FosB promoter activity (Figure 4f), implying an important role of MTA1 in the noted upregulation of FosB in TGF-β1 stimulated cells. The observed effect of TGF-β1 on FosB expression was transcriptional in nature as inclusion of Actinomycin D alone repressed FosB expression which can not be rescued by TGF-β1 stimulation (Figure 4g). This may be due to the fact that Actinomycin D is a board range transcriptional inhibitor and as expected, it also blocked TGF-β1 stimulation of MTA1, a new FosB coactivator (this study). Consistent with these results, we found that MTA1 over-expression induces FosB promoter activity in HC11 cells (Figure 4h).
Figure 4.

TGF-β1-mediated FosB expression requires MTA1. (a) qPCR analysis of Fos B and MTA1 mRNA expression in HC11 cells after cotransfecting with pcDNA and MTA1 with and without TGF-β1 treatment. Results are presented in-terms of a fold change after normalizing with β-actin mRNA. Each value represents the mean of ± S. E. of three independent experiments. (b) Western blot analysis for FosB and MTA1 protein expression from the cell lysates prepared from HC11 cells treated with TGF-β1 (2ng/ml) for 4, 8, 12 and 24 hours. (c) qPCR analysis of FosB mRNA expression in TGF-β1 stimulated HC11 cells after selective knockdown of MTA1 using MTA1-siRNA. Results are presented in-terms of a fold change after normalizing the FosB and MTA1 mRNA expression levels with β-actin mRNA. Each value represents the mean of ± S. E. of three independent experiments. (d) Western blot analysis for FosB protein expression in the cell lysates prepared from TGF-β1 stimulated HC11 cells after selective knockdown of MTA1 using MTA1-siRNA. (e) Western blot analysis for FosB protein in MTA1+/+ and MTA1−/− MEFs after treating with TGF-β1. (f) FosB promoter activity in MTA1+/+ and MTA1−/− MEFs after cotransfecting with MTA1 in presence and absence of TGF-β1. FosB-pGL3 luciferase reporter plasmid and pCMVβ vector carrying β-galactosidase gene were transfected and after 36 hours of transfection cells were serum starved and treated with TGF-β1. Luciferase assay was carried out as mentioned in figure legend 2d. (g) qPCR analysis for FosB mRNA expression in HC11 cells treated with TGF-β1 in presence and absence of Actinomycin D (250 ng/ml). Actinomycin D was added one hour prior to the TGF-β1 treatment. The results were represented in terms of fold change after normalizing the FosB mRNA levels with β-actin mRNA. Each value respresents the mean of ± S.E. of three independent experiments. (h) FosB promoter activity in HC11 cells after cotransfecting with MTA1 in presence and absence of TGF-β1. Luciferase assay was carried out in triplicates and results were presented in-terms of fold change and the values represent the mean of ± S.E. from the three independent transfection experiments. Panels a, c–f, and h, cells were treated with 2ng/ml of TGF-β1 for 12 hrs.
To determine the underlying mechanism of MTA1 regulation of FosB expression, we next carried out a ChIP-based promoter walk in HC11 cells treated with or without TGF-β1. We found the recruitment of MTA1 to only region III (−644 to −794) of the FosB promoter and TGF-β1 stimulation further enhances such recruitment (Figure 5a). We also found that RNA Pol II and MTA1/ Pol II coactivator complex is also recruited onto region III of FosB promoter (Figure 5a). Interestingly, complexes containing MTA1/Acetyl hitsone H4 but not MTA1/HDAC2 is recruited to the same region, supporting the functional active nature of the region (Figure 5a). A schematic representation of recruitment of MTA1, RNA Pol II and Acetyl histone H4 onto FosB promoter is presented in Figure S3a.
Figure 5.

MTA1 regulation of FosB transcription. (a) Recruitment of MTA1, Pol II, MTA1>Pol II, MTA1>AcH4, MTA1> HDAC2, c-Jun and MTA1> c-Jun on to the FosB promoter (either on to region I or II or III) in HC11 cells after treatment with TGF-β1. Single ChIP analysis was carried out with MTA1, Pol II and c-Jun antibodies where as double ChIP analysis was carried out either with MTA1 followed by Pol II (1st ChIP: MTA1 Ab; 2nd ChIP: Pol II Ab) or MTA1 followed by c-Jun (1st ChIP: MTA1 Ab; 2nd ChIP: c-Jun Ab) or MTA1 followed by AcH4 (1st ChIP: MTA1 Ab; 2nd ChIP: AcH4 Ab) or MTA1 followed by HDAC2 antibody (1st ChIP: MTA1 Ab; 2nd ChIP: HDAC2 Ab) in TGF-β1 stimulated HC11 cells. (b) FosB promoter activity in HC11 cells after cotransfecting either with MTA1-pcDNA or c-Jun-pcDNA or both in presence of TGF-β1. (c) Western blot analysis for Pol II, c-Jun and HDAC2 after IP with MTA1 in HC11 cells treated with TGF-β1. (d) EMSA analysis of c-Jun and MTA1 binding to the FosB promoter using the PCR product encompassing the region III (−644 to −794) of FosB promoter in the nuclear extract of HC11 cells treated with TGF-β1. Panels a–d, cells were treated with 2ng/ml of TGF-β1 for 12 hrs.
Transfac analysis of the region III of FosB promoter revealed the presence of one potential AP-1 site (CGAGTCACAC, −708 to −717). Members of the Jun/Fos family form hetero- or homo-dimers and constitute AP-1 transcription factors. Hence we next carried out single or sequential c-Jun-Ab based ChIP analysis onto FosB-promoter. To our surprise, c-Jun and MTA1/c-Jun complexes are also recruited to the region III of FosB-promoter (Figure 5a). To determine whether c-Jun plays a mechanistic role along with MTA1 in TGF-β1-mediated stimulation of FosB expression, we examined the effects of c-Jun alone or in combination of MTA1 on FosB-promoter (−1000 to +307) and a truncated FosB promoter lacking AP1 site (−603 to +307) in TGF-β1-stimulated cells. We found that MTA1 and c-Jun stimulates FosB-promoter activity in a cooperative manner and that AP1-site on Fos-B-promoter is indispensable for stimulation of Fos-B activity by MTA1 and/or TGF-β1 (Figure 5b). Collectively, these results suggest that MTA1/ Pol II/ c-Jun may exist in the same complex under physiologic condition. To support this notion, we showed that indeed, RNA Pol II and c-Jun could be co-immunoprecipitated along with MTA1 in both basal and TGF-β1 stimulated HC11 cells but the amount of co-IP proteins were significantly increased in stimulated cells, presumably due to increased levels of MTA1 protein (Figure 5c). To demonstrate a potential direct binding of c-Jun to FosB-promoter, we next performed EMSA using the PCR product encompassing region III of the murine FosB-promoter, and nuclear extracts from TGF-β1-stimulated HC11 cells. We found that TGF-β1 stimulation of cells promotes the formation of distinct protein/DNA complexes. To gain insights into the components of complexes, we attempted to supershift the protein/DNA band by inclusion of anti-MTA1-Ab, anti-c-Jun-Ab, or both (Figure 5d). Interestingly, anti-MTA1 or anti-c-Jun-Abs had similar effects on the mobility of the protein/DNA complex. However, the complex could be further super shifted by co-treatment with both antibodies, suggesting the existence of MTA1-cJun complex and its ability to interact FosB-DNA. In brief, these findings reveal that MTA1 behaves as a coactivator in stimulating the expression of Fos-B in TGF-β1-stimulated epithelial cells.
MTA1/HDAC2/FosB corepressor complex downregulates E-cadherin
Based on the cDNA microarray analysis, an earlier study has suggested but not established that FosB may negatively regulate E-cadherin (Ohnishi et al., 2008). Having shown that MTA1 is a target of TGF-β1 signaling and plays an important role in TGF-β1-mediated stimulation of FosB expression, we next investigated the role of this newly identified MTA1-FosB pathway in the regulation of E-cadherin. We next examined the effects of MTA1 or FosB on the regulation of E-cadherin transcription. Co-expression of either MTA1 or FosB substantially downregulates E-cadherin promoter activity in HC11 cells and there is no addition effect of TGF-β1 stimulation (Figure 6a). To demonstrate a role of MTA1 in the regulation of E-cadherin transcription, we showed a significant reduction in the ability of TGF-β1 to inhibit E-cadherin promoter activity in MTA1−/− MEFs (Figure 6b). However, overexpression of FosB, a target of MTA1, could inhibit E-cadherin promoter activity in MTA1−/− MEFs. To independently validate these results, we next showed that FosB knockdown in HC11 cells (Figure 6c) antagonizes the ability of TGF-β1 stimulation or MTA1 overexpression to inhibit E-cadherin transcription (Figure 6c). These findings suggest that FosB may constitute a downstream effect of MTA1 in repressing E-cadherin transcription, at-least in-part.
Figure 6.

Effect of MTA1 and FosB expression on E-cadherin transcription. (a) E-cadherin promoter activity in HC11 cells after cotransfecting either with pcDNA or MTA1 or FosB in presence of TGF-β1. (b) E-cadherin promoter activity in MTA1−/− MEFs after cotransfecting with either pcDNA or FosB in presence and absence of TGF-β1. (c) E-cadherin promoter activity in HC11 cells after cotransfecting with MTA1 followed by selective knockdown of FosB in presence of TGF-β1. The upper panel represents the western blot analysis showing the knock down of FosB in HC 11 cells from the luciferase samples. Panels a–c, cells were treated with 2ng/ml of TGF-β1 for 12 hrs.
To delineate the molecular mechanism involved in the observed repression of E-cadherin transcription by MTA1-FosB pathway, we next performed a ChIP-based promoter walk onto E-cadherin promoter. We found the recruitment of MTA1, FosB, and MTA1/FosB complex to the regions II and III of E-cadherin promoter (Figure 7a) but not to region I, IV, V and VI (Figure S3b) in HC11 cells. Interestingly, TGF-β1 stimulation of HC11 cells results in an enhanced recruitment of these proteins onto E-cadherin promoter (Figure 7a). Since MTA1 is known to interact with HDACs (Molli et al., 2008) and the fact that both MTA1 and HDAC2 are components of the NuRD corepressor (Manavathi and Kumar, 2007) we next showed that HDAC2 as well as FosB/HDAC2 complex are also recruited to the regions II and III of E-cadherin-promoter in TGF-β responsive manner (Figure 7a). We also showed that knockdown of FosB in HC11 cells inhibits MTA1 recruitment onto E-cadherin DNA, while there was no effect of MTA1-siRNA on the recruitment of FosB to E-cadherin DNA (Figure 7b). In addition to this no effect was observed on the recruitment of FosB to E-cadherin promoter even in MTA1+/+ and MTA1−/−MEFs (Figure S3c). This is presumably, due to downstream nature of FosB in relation to MTA1. These findings suggested the possibility of an enhanced interaction among MTA1, HDAC2 and FosB in TGF-β1-stimulated cells. Indeed, we found that both MTA1 and HDAC2 could be efficiently co-immunoprecipated along with FosB in TGF-β1-stimulated HC11 cells (Figure 7c).
Figure 7.
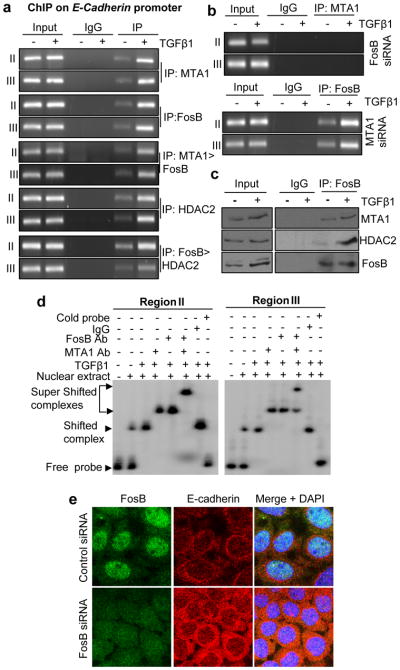
Down regulation of E-cadherin expression by MTA1/ FosB/ HDAC2 complex. (a) Recruitment of MTA1, FosB, MTA1>FosB, HDAC2, FosB > HDAC2 on to the region II (−521 to −709) and III (−979 to −1151) of E-cadherin promoter in TGF-β1 stimulated HC11 cells. Single ChIP analysis was carried out with either MTA1 or FosB or HDAC2 antibodies whereas double ChIP analysis was carried out either with MTA1 followed by FosB antibody (1st ChIP: MTA1 Ab, 2nd ChIP: FosB) or FosB followed by HDAC2 (1st ChIP: FosB; 2nd ChIP: HDAC2) in the TGF-β1 stimulated HC11 cells. (b) Recruitment of MTA1 after slective knockdown of FosB (upper panel) and FosB recruitment after MTA1 knockdown (lower panel), on to the region II and III of E-cadherin promoter in HC11 cells stimulated with TGF-β1. (c) Western blot analysis showing the interaction of FosB with MTA1 and HDAC2 in TGF-β1 stimulated HC11 cells. Immunoprecipitation was carried out with anti-FosB antibody from the HC11 cells treated with or with TGF-β1 for 12 hours and western blot analysis was carried out with MTA1, HDAC2 and FosB antibodies. (d) EMSA analysis of FosB and MTA1 binding to the E-cadherin promoter using the PCR product encompassing the region II (−521 to −709) and III (−979 to −1151) of E-cadherin promoter in the nuclear extract of HC11 cells treated with TGF-β1. (e) Confocal analysis for E-cadherin expression after selective knock down of FosB using FosB-siRNA in HC11 cells. Panels a–e, cells were treated with 2ng/ml of TGF-β1 for 12 hrs.
To demonstrate a potential direct binding of FosB to the mouse E-cadherin-DNA, we next performed EMSA using the PCR product encompassing region II or III (Figure 7d) and nuclear extracts from TGF-β1-stimulated HC11 cells. We found the formation of distinct protein/DNA complexes. Interestingly, the binding of these complexes to the test DNA could be super shifted by the inclusion of anti-FosB or anti-MTA1 but not control IgG; while co-incubation of anti-MTA1 and FosB Abs resulted in an additional retardation of mobility of the complex (Figure 7d). These findings suggest a potential role of MTA1/FosB/ HDAC2 corepressor complex in TGF-β1-mediated suppression of E-cadherin transcription. Consistent with these results, we showed that FosB downregulation in HC11 leads to an enhanced E-cadherin expression (Figure 7e). In summary, findings presented here suggest that TGF-β1 signaling targets MTA1 and that MTA1 plays an important role in the action of TGF-β1and in supporting the expression of FosB which in-turn, facilitates the repression of E-cadherin – a target of both TGF-β1 and MTA1 in epithelial cells (Figure 8).
Figure 8.
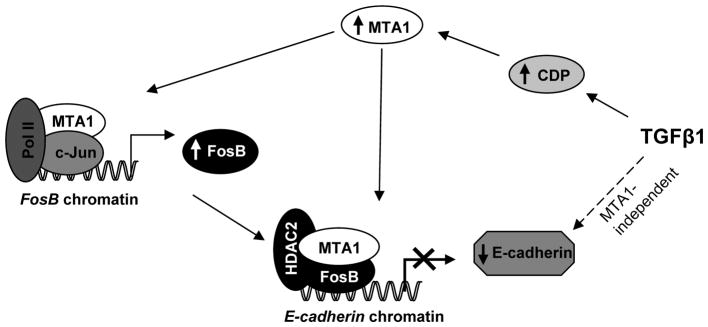
Schematic representation of MTA1 regulation of FosB and E-cadherin expression: TGF-β1 stimulation of mammary epithelial cells results in the induction of MTA1. Once MTA1 is induced, it form a coactivator complex along with c-Jun and Pol II and gets recruited to FosB promoter leading to induced FosB expression, which in turn, represses the transcription of E-cadherin by recruiting on to its chromatin along with MTA1 and HDAC2. Dotted line shows MTA1-independent regulation of E-cadherin by other mechanisms not investigated here.
Discussion
Our core findings that MTA1 downregulates the expression of E-cadherin has introduced a new regulatory player in the event of EMT. E-cadherin down regulation is one of the principle events during EMT in embryonic development and cancer progression. EMT represents a key event in the progression of tumor cells to dedifferentiated and invasive phenotypes (Thiery, 2002) and in cancer metastasis (Hugo et al., 2007; Radisky, 2005). It is evident that many transcriptional factors such as Snail, Slug, SIP1, Twist, LIV1 and δEF were involved in the repression of E-cadherin (Thiery, 2002; Zavadil and Bottinger, 2005) and there-by stimulates the process of epithelial plasticity in breast cancer cells. Although many signaling pathways converge with the function and expression of E-cadherin, the transcriptional regulation of E-cadherin expression continue to be poorly understood. In this context, the present study establishes a definitive contribution of MTA1 in downregulation of E-cadherin expression, leading to EMT. As MTA1 regulates its target genes by acting either as a transcriptional corepressor or coactivator (Balasenthil et al., 2007; Gururaj et al., 2006; Mazumdar et al., 2001; Molli et al., 2008), our results show that E-cadherin is target of MTA1 and it down regulates E-cadherin expression at the level of transcription by directly interacting with its promoter as a part of FosB/HDAC2 complex.
MTA1 over expression is associated with metastatic growth of cell lines and with invasive growth of tumors (Manavathi and Kumar, 2007). Studies presented here provide a mechanistic basis of earlier correlative studies between MTA1 and E-cadherin (Dannenmann et al., 2008; Tong et al., 2007; Zhang et al., 2006). Recently Burstin et. al. reported the role of HDACs in silencing of E-cadherin during the metastatic process of pancreatic cancer cells. Although there is existence of a strong relationship exits between the MTA family, HDACs and E-cadherin, the study explains the mechanistic basis of the regulation of E-cadherin by these molecules during breast cancer progression. In this context, our study demonstrates the contribution of MTA1 in the regulation of TGF-β1 mediated E-cadherin repression, which may be one of the mechanisms that attributes to the metastatic function of MTA1. Overall, our results strongly suggest that MTA1 induces EMT by regulating the expression of E-cadherin, which has a key role in regulating the motility, invasion and metastatic potential of cancer cell.
Materials and methods
Antibodies and cell culture
Antibodies against MTA1 (A300-280A), and RNA Polymerase II (A300-653A) purchased from Bethyl labs, Montgomery, TX. HDAC2 (sc-9959), FosB(sc-48), E-cadherin (sc-1500), c-Jun (sc-1694) were purchased from Santa Cruz Biotechnology (Santa Cruz, CA). α-smooth muscle actin(A2547), normal mouse IgG, rabbit IgG, and antibodies against vinculin were purchased from Sigma Chemical Co. (St. Louis, MO). Acetyl histone H3 (06-599) and H4 (06- 598) antibodies were purchased from UBI Inc. All cells were cultured in Dulbecco’s modified Eagle’s medium/F12 medium supplemented with 10% fetal bovine serum. HC11 cells were maintained in RPMI-1640 medium supplemented with 10% fetal calf serum, 10 ng/ml epidermal growth factor, and 5μg/ml insulin. TGF-β1 was obtained from PeproTech Inc, NJ, USA. Cells were treated with TGF-β1 (2ng/ ml of the medium for 12 hours) after 12–14 hours of serum starvation in serum free medium.
qPCR
For qPCR total RNA was extracted using TRIzol reagent (Invitrogen, Carlsbad, CA), and first-strand cDNA synthesis was carried out with SuperScript II reverse transcriptase (Invitrogen) using 2 μg of total RNA and poly (dT) primer. Quantitative RT-PCR (qPCR) was performed with the gene-specific primers listed in supplementary Table 3 using a 7900HT sequence detection system (Applied Biosystems, Foster City, CA). The levels of mRNA of all the genes were normalized to that of β-actin mRNA.
Reporter and immunoprecipitation assays
MTA1-luc, FosB-luc and E-cadherin-luc assays were performed according to the manufacturer’s instructions (Promega), and the results were standardized against the β-galactosidase activity, an internal control. Some assays were performed in the presence of control siRNA or MTA1 siRNA and FosB- siRNA. Cell lysates were prepared in RIPA lysis buffer, and western blot analysis was performed as previously described (Kumar et al., 2002). For immunoprecipitation assays, 1 mg of cell lysate was incubated with MTA1 or FosB antibody and agarose beads with constant rotation followed by extensive washing with NP-40 buffer (20 mM HEPES [pH 7.6], 150 mM KCl, 1 mM DTT, 0.1% NP-40, and 8% glycerol). The immunoprecipitated proteins were resolved on sodium dodecyl sulfate-polyacrylamide gel electrophoresis (SDS-PAGE), transferred to nitrocellulose membrane and analyzed by western blotting using antibodies for TGF-β1 signaling components.
Cloning of murine MTA1 promoter
Full-length murine MTA1 promoter and its deletion constructs were generated by following the procedures described elsewhere (Pakala et al., 2010).
siRNA transfection
siRNA against MTA1 and negative control siRNA were purchased from Dharmacon (Lafayette, CO). HC11 cells were seeded at 40% density the day before transfection in 6-well plates, and siRNA transfections were performed with oligofectamine reagent (Invitrogen) according to the manufacturer’s instructions. Cells were harvested 48 h after transfection and cell lysates were prepared.
Chromatin immunoprecipitation (ChIP) assay
ChIP assays were performed as described previously (Mazumdar et al., 2001). Briefly, cells were cross-linked with formaldehyde (1% final concentration) and sonicated on ice to fragment the chromatin into an average length of 500 bp to 1 kb. The lysates were diluted using chromatin-dilution buffer. MTA1 or CDP or Acetyl histone H4 or Acetyl Histone H3 or Pol II or HDAC2 or FosB or c-Jun or mouse IgG were used to immunoprecipitate the respective antigens at 4°C overnight. Protein A Sepharose beads saturated with bovine serum albumin and single-strand DNA were added to the lysate to isolate the antibody-bound complexes. The beads were washed to remove nonspecific binding, and the antibody-bound chromatin was eluted. The eluate was “de-crosslinked” by heating at 65°C for 6 h. RNase was added during this step to digest the RNA contaminants. Samples were treated with proteinase K for 1 h at 45°C to digest the immunoprecipitated proteins, and finally, the DNA was extracted using the phenol chloroform method. For the double ChIP experiment, an initial ChIP assay was done with either MTA1 or FosB antibody to immunoprecipitate MTA1-bound chromatin, which was eluted from the protein A Sepharose beads and subjected to a second ChIP assay with either Pol II or anti-HDAC2 antibody. With the DNA isolated at the end of the ChIP analysis, PCR was performed using the primers mentioned in supplementary table 4.
Electrophoretic mobility shift assay (EMSA)
Nuclear extracts were prepared using a Nonidet P-40 lysis method (Bui-Nguyen et al., 2010) EMSA for CDP or FosB or E-cadherin DNA binding was performed using the annealed and [γ32P] ATP end-labeled oligonuclotides (Supplementary table 5) or PCR products in a 20-μl reaction mixture for 15 min at 20°C. Samples were run on a nondenaturing 5% polyacrylamide gel and imaged by autoradiography. Specific competitions were performed by adding a 100-molar excess of competitor to the incubation mixture, and supershift EMSAs were performed by adding 1.5 μl of the either MTA1 or CDP or FosB or c-Jun antibodies.
Confocal analysis
After transfecting HC11 cells with MTA1-siRNA or FosB-siRNA, E-cadherin and α-SMA expression was determined by indirect immunofluorescence. The cells were grown on sterile glass cover slips, fixed in 4% paraformaldehyde, permeabilized in 0.1% Triton X-100, and blocked in 10% normal goat serum in PBS. Cells were incubated with FosB or E-cadherin antibody, washed three times in PBS, and then incubated with goat anti-rabbit secondary antibodies conjugated with 488-Alexa from Molecular Probes (Eugene, OR). The DAPI (Molecular Probes) was used as a nuclear stain. Microscopic analysis was performed using an Olympus FV300 laser-scanning confocal microscope (Olympus America Inc., Melville, NY) using sequential laser excitation to minimize fluorescence emission bleed-through.
Statistical analysis
The results are given as the mean ± standard error. Statistical analysis of the data was performed by using Student’s t-test.
Supplementary Material
Acknowledgments
We would like to thank Dr. Toshio Matsumoto for FosB promoter constructs and Dr. Eric R. Fearon for E-cadherin promoter construct. The work was supported by NIH Grant CA98823 (RK).
References
- Balasenthil S, Gururaj AE, Talukder AH, Bagheri-Yarmand R, Arrington T, Haas BJ, et al. Identification of Pax5 as a target of MTA1 in B-cell lymphomas. Cancer Res. 2007;67:7132–7138. doi: 10.1158/0008-5472.CAN-07-0750. [DOI] [PubMed] [Google Scholar]
- Bui-Nguyen TM, Pakala SB, Sirigiri RD, Xia W, Hung MC, Sarin SK, et al. NF-kappaB signaling mediates the induction of MTA1 by hepatitis B virus transactivator protein HBx. Oncogene. 2010;29:1179–1189. doi: 10.1038/onc.2009.404. [DOI] [PMC free article] [PubMed] [Google Scholar]
- Condeelis J, Segall JE. Intravital imaging of cell movement in tumours. Nat Rev Cancer. 2003;3:921–930. doi: 10.1038/nrc1231. [DOI] [PubMed] [Google Scholar]
- Dannenmann C, Shabani N, Friese K, Jeschke U, Mylonas I, Bruning A. The metastasis- associated gene MTA1 is upregulated in advanced ovarian cancer, represses ERbeta, and enhances expression of oncogenic cytokine GRO. Cancer Biol Ther. 2008;7:1460–1467. doi: 10.4161/cbt.7.9.6427. [DOI] [PubMed] [Google Scholar]
- Deckers M, van Dinther M, Buijs J, Que I, Lowik C, van der Pluijm G, et al. The tumor suppressor Smad4 is required for transforming growth factor beta-induced epithelial to mesenchymal transition and bone metastasis of breast cancer cells. Cancer Res. 2006;66:2202–2209. doi: 10.1158/0008-5472.CAN-05-3560. [DOI] [PubMed] [Google Scholar]
- Eferl R, Wagner EF. AP-1: A double-edged sword in tumorigenesis. Nat Rev Cancer. 2003;3:859–868. doi: 10.1038/nrc1209. [DOI] [PubMed] [Google Scholar]
- Gery S, Tanosaki S, Bose S, Bose N, Vadgama J, Koeffler HP. Down-regulation and growth inhibitory role of C/EBPalpha in breast cancer. Clin Cancer Res. 2005;11:3184–3190. doi: 10.1158/1078-0432.CCR-04-2625. [DOI] [PubMed] [Google Scholar]
- Gururaj AE, Singh RR, Rayala SK, Holm C, den Hollander P, Zhang H, et al. MTA1, a transcriptional activator of breast cancer amplified sequence 3. Proc Natl Acad Sci U S A. 2006;103:6670–6675. doi: 10.1073/pnas.0601989103. [DOI] [PMC free article] [PubMed] [Google Scholar]
- Hofer MD, Menke A, Genze F, Gierschik P, Giehl K. Expression of MTA1 promotes motility and invasiveness of PANC-1 pancreatic carcinoma cells. Br J Cancer. 2004;90:455–462. doi: 10.1038/sj.bjc.6601535. [DOI] [PMC free article] [PubMed] [Google Scholar]
- Hugo H, Ackland ML, Blick T, Lawrence MG, Clements JA, Williams ED, et al. Epithelial--mesenchymal and mesenchymal--epithelial transitions in carcinoma progression. J Cell Physiol. 2007;213:374–383. doi: 10.1002/jcp.21223. [DOI] [PubMed] [Google Scholar]
- Kumar R, Wang RA, Mazumdar A, Talukder AH, Mandal M, Yang Z, et al. A naturally occurring MTA1 variant sequesters oestrogen receptor-alpha in the cytoplasm. Nature. 2002;418:654–657. doi: 10.1038/nature00889. [DOI] [PubMed] [Google Scholar]
- Kurisaki K, Kurisaki A, Valcourt U, Terentiev AA, Pardali K, Ten Dijke P, et al. Nuclear factor YY1 inhibits transforming growth factor beta- and bone morphogenetic protein- induced cell differentiation. Mol Cell Biol. 2003;23:4494–4510. doi: 10.1128/MCB.23.13.4494-4510.2003. [DOI] [PMC free article] [PubMed] [Google Scholar]
- Lee TC, Zhang Y, Schwartz RJ. Bifunctional transcriptional properties of YY1 in regulating muscle actin and c-myc gene expression during myogenesis. Oncogene. 1994;9:1047–1052. [PubMed] [Google Scholar]
- MacLellan WR, Lee TC, Schwartz RJ, Schneider MD. Transforming growth factor-beta response elements of the skeletal alpha-actin gene. combinatorial action of serum response factor, YY1, and the SV40 enhancer-binding protein, TEF-1. J Biol Chem. 1994;269:16754–16760. [PubMed] [Google Scholar]
- Mahoney MG, Simpson A, Jost M, Noe M, Kari C, Pepe D, et al. Metastasis-associated protein (MTA)1 enhances migration, invasion, and anchorage-independent survival of immortalized human keratinocytes. Oncogene. 2002;21:2161–2170. doi: 10.1038/sj.onc.1205277. [DOI] [PubMed] [Google Scholar]
- Manavathi B, Kumar R. Metastasis tumor antigens, an emerging family of multifaceted master coregulators. J Biol Chem. 2007;282:1529–1533. doi: 10.1074/jbc.R600029200. [DOI] [PubMed] [Google Scholar]
- Massague J, Seoane J, Wotton D. Smad transcription factors. Genes Dev. 2005;19:2783–2810. doi: 10.1101/gad.1350705. [DOI] [PubMed] [Google Scholar]
- Mazumdar A, Wang RA, Mishra SK, Adam L, Bagheri-Yarmand R, Mandal M, et al. Transcriptional repression of oestrogen receptor by metastasis-associated protein 1 corepressor. Nat Cell Biol. 2001;3:30–37. doi: 10.1038/35050532. [DOI] [PubMed] [Google Scholar]
- Michl P, Downward J. CUTL1: A key mediator of TGFbeta-induced tumor invasion. Cell Cycle. 2006;5:132–134. doi: 10.4161/cc.5.2.2311. [DOI] [PubMed] [Google Scholar]
- Michl P, Ramjaun AR, Pardo OE, Warne PH, Wagner M, Poulsom R, et al. CUTL1 is a target of TGF(beta) signaling that enhances cancer cell motility and invasiveness. Cancer Cell. 2005;7:521–532. doi: 10.1016/j.ccr.2005.05.018. [DOI] [PubMed] [Google Scholar]
- Molli PR, Singh RR, Lee SW, Kumar R. MTA1-mediated transcriptional repression of BRCA1 tumor suppressor gene. Oncogene. 2008;27:1971–1980. doi: 10.1038/sj.onc.1210839. [DOI] [PMC free article] [PubMed] [Google Scholar]
- Ohnishi YN, Sakumi K, Yamazaki K, Ohnishi YH, Miura T, Tominaga Y, et al. Antagonistic regulation of cell-matrix adhesion by FosB and DeltaFosB/Delta2DeltaFosB encoded by alternatively spliced forms of fosB transcripts. Mol Biol Cell. 2008;19:4717–4729. doi: 10.1091/mbc.E07-08-0768. [DOI] [PMC free article] [PubMed] [Google Scholar]
- Pakala SB, Bui-Nguyen TM, Reddy SD, Li DQ, Peng S, Rayala SK, et al. Regulation of NF-kappaB circuitry by a component of the nucleosome remodeling and deacetylase complex controls inflammatory response homeostasis. J Biol Chem. 2010;285:23590–23597. doi: 10.1074/jbc.M110.139469. [DOI] [PMC free article] [PubMed] [Google Scholar] [Retracted]
- Peinado H, Quintanilla M, Cano A. Transforming growth factor beta-1 induces snail transcription factor in epithelial cell lines: Mechanisms for epithelial mesenchymal transitions. J Biol Chem. 2003;278:21113–21123. doi: 10.1074/jbc.M211304200. [DOI] [PubMed] [Google Scholar]
- Radisky DC. Epithelial-mesenchymal transition. J Cell Sci. 2005;118:4325–4326. doi: 10.1242/jcs.02552. [DOI] [PubMed] [Google Scholar]
- Thiery JP. Epithelial-mesenchymal transitions in tumour progression. Nat Rev Cancer. 2002;2:442–454. doi: 10.1038/nrc822. [DOI] [PubMed] [Google Scholar]
- Tong D, Heinze G, Schremmer M, Schuster E, Czerwenka K, Leodolter S, et al. Expression of the human MTA1 gene in breast cell lines and in breast cancer tissues. Oncol Res. 2007;16:465–470. doi: 10.3727/096504007783338322. [DOI] [PubMed] [Google Scholar]
- Zavadil J, Bottinger EP. TGF-beta and epithelial-to-mesenchymal transitions. Oncogene. 2005;24:5764–5774. doi: 10.1038/sj.onc.1208927. [DOI] [PubMed] [Google Scholar]
- Zhang H, Stephens LC, Kumar R. Metastasis tumor antigen family proteins during breast cancer progression and metastasis in a reliable mouse model for human breast cancer. Clin Cancer Res. 2006;12:1479–1486. doi: 10.1158/1078-0432.CCR-05-1519. [DOI] [PubMed] [Google Scholar]
Associated Data
This section collects any data citations, data availability statements, or supplementary materials included in this article.