

Abstract
A microfluidic chip integrating DNA extraction, amplification, and detection for the identification of bacteria in saliva is described. The chip design integrated a monolithic aluminum oxide membrane (AOM) for DNA extraction with seven parallel reaction wells for real-time polymerase chain reaction (rtPCR) amplification of the extracted DNA. Samples were first heated to lyse target organisms and then added to the chip and filtered through the nanoporous AOM to extract the DNA. PCR reagents were added to each of the wells and the chip was thermocycled. Identification of Streptococcus mutans in a saliva sample is demonstrated along with the detection of 300 fg (100–125 copies) of both methicillin-susceptible Staphylococcus aureus (MSSA) and methicillin-resistant S. aureus (MRSA) genomic DNA (gDNA) spiked into a saliva sample. Multiple target species and strains of bacteria can be simultaneously identified in the same sample by varying the primers and probes used in each of the seven reaction wells. In initial tests, as little as 30 fg (8–12 copies) of MSSA gDNA in buffer has been successfully amplified and detected with this device.
1. Introduction
A point-of-care (POC) device able to rapidly identify bacteria in clinical samples would provide more immediate and accurate information for better treatment options at clinical or primary care facilities. Current methods of diagnosing bacterial infections using labor-intensive culture methods can take more than 24 hours, delaying effective treatment and limiting potential options.1, 2 Nucleic acid tests, including techniques such as the polymerase chain reaction (PCR), are alternatives to culture for identifying bacteria. These tests can positively identify bacteria in a few hours from specific nucleic acid sequences. Traditional PCR methods require the use of specialized equipment, expensive reagents, and trained personnel to complete the assays.3–5 Thus PCR is generally still performed in centralized laboratories by trained technicians with results supplied in a similar time frame (~24 h) to many culture techniques.4, 6 Microfluidic devices integrating PCR can make this diagnostic tool available for POC testing. Microfluidics offers many advantages over current tube-based PCR procedures including lower reagent consumption, faster cycling times, lower cost per test, and automated processing for use by minimally trained personnel.1, 3, 4, 7, 8 Microfluidic systems can be designed to be portable, with disposable chips that eliminate contamination concerns between samples. The small device footprints achievable can incorporate parallel processing units, increasing throughput and thus detection of multiple pathogens simultaneously.3, 8–10
To fully integrate a PCR assay onto a POC device for sample-in answer-out capability, the following steps are required: cell lysis, DNA extraction and removal of PCR inhibitors, amplification via thermocycling, and amplicon detection.11–13 Several chip designs have been described that integrate cell lysis and DNA extraction with PCR by using silica-based separations or magnetic beads for extraction.3, 4, 14, 15 Since silica and some magnetic beads are PCR inhibitors, the DNA must be eluted, often with ethanol, a strong PCR inhibitor, before downstream amplification.16–19 Chip designs have been reported that performed cell lysis in the PCR chamber without DNA extraction or isolation of the targeted cells, also called direct PCR.13, 20 This is sufficient for samples that do not contain PCR inhibitors, but many clinical samples contain a wide variety of inhibitors and require extraction for successful PCR. Cell lysis in the PCR chamber without DNA extraction has also been demonstrated with antibody-functionalized magnetic beads used to separate the target cells from the rest of the sample.21 If more than one species is targeted, antibody-functionalized beads would be needed for each type, making the addition of new targets difficult. Many chip designs incorporating cell lysis and DNA extraction are limited to only a few reaction chambers,3, 4, 13–15, 21 reducing the potential for multiplexing reactions. A chip design containing 12 reaction chambers for easy multiplexing has been described22 but it does not integrate cell lysis or DNA extraction on-chip.
AOMs have previously been used to extract DNA from samples with subsequent PCR amplification directly on the AOM.16, 17, 23–26 The amount of DNA extracted has been found to depend not only on the size of the AOM’s pores, but also on pH and salt concentration, with larger pores sometimes performing better than smaller pores.17 AOMs can also inhibit PCR to some degree, but the basic pH of the master mix along with adding BSA and extra Taq polymerase to the reaction mixture will release nucleic acids bound to the membrane and minimize the inhibition.16, 17, 23, 26
We have developed a chip that utilizes these properties of the AOM to integrate DNA extraction and PCR in multiple reaction chambers with on-chip detection in a simple and functional device. Figure 1 shows an image of the PDMS/AOM/glass hybrid chip (a) and a schematic of its cross-section (b). The device uses an AOM sandwiched between an array of seven parallel reaction wells and a microfluidic layer to control fluid flow through the membrane. Sample is added to the reaction wells and pulled through the AOM to extract and concentrate DNA. This simplifies the chip design compared to devices that rely on PCR inhibiting silica-based solid phase extraction for DNA extraction. After DNA extraction, PCR master mix and species-specific primers and probes are added directly to the individual wells followed by thermocycling and imaging. By using different primer and probe sets in different wells (multiplexing in space), detection of multiple analytes from the same sample is possible.
Fig. 1.

Image of a chip (A) and a schematic of its cross-section (B). Schematic is not to scale. The glass cover slip is 150 μm thick, the microfluidic base of the chip is ~400 μm thick, The AOM is 60 μm thick, and the reaction wells are ~2.8 mm tall. The microposts are 75 μm in diameter and 18 μm tall. The microfluidic channel is 30 μm deep and 1.6 cm long.
The chip we describe here was tested with saliva as a sample, although other types of samples could be used. Saliva is easily and painlessly obtained without requiring trained personnel. Needles are not required, reducing the danger of accidental blood-borne pathogen transmission and improving patient compliance. Saliva contains many of the same analytes as blood, and in the case of respiratory infections it is likely to contain the bacteria causing the infection.27–32 Some variations in salivary bacterial profiles have even been associated with pancreatic cancer, for which there is a low survival rate and a lack of biomarkers for early detection and treatment.33 In addition, saliva contains many ubiquitous species of bacteria that are not infectious and can be used as control organisms.32, 34
2. Materials and methods
2.1 Chip fabrication and design
The microfluidic chip design consisted of three main parts: the wells used for sampling and PCR reactions, the AOM (13 mm diameter, 60 μm thickness, and 0.2 μm diameter pores, Whatman, Piscataway, NJ) that captured gDNA from sample solutions, and a microfluidic channel and AOM-support structure for fluid handling. An image of the device and a schematic of its cross-section are shown in Figure 1. The microfluidic chip base was composed of a PDMS layer with a channel bonded to a 150-μm-thick glass cover slip. The top of the PDMS layer contained an 11-mm-diameter region of microposts that supported the AOM for fluid flow through the membrane when vacuum was applied at the waste reservoir. A 1-mm biopsy punch (Miltex, York, PA) was used to punch a hole through the PDMS to connect the micropost region to the fluidic channel underneath. A monolithic PDMS casting formed a reservoir containing seven wells, with each well measuring 2.4 mm in diameter and 3.0 mm in height with a volume of ~13.5 μL. The bottom of the 7-well PDMS reservoir was coated with a very thin layer (~100 μm thick) of uncured PDMS (Sylgard 184, Dow Corning, Midland, MI) and affixed on top of the AOM supported by the microfluidic base.
Molds for the 7-well PDMS reservoir were designed using BOBCAD/CAM software and fabricated in brass blanks (brass alloy 360, McMaster Carr, Chicago, IL) using a MicroMill DSLS 3000 (MicroProto Systems, Chandler, AZ) computer numeric controlled (CNC) machine. A double-sided molding strategy (supplemental information Fig. S1) was employed where a brass master mold was used to cast a flexible PDMS casting that mated with a second brass master. The PDMS casting was pretreated with octyltrichlorosilane (Sigma Aldrich, St. Louis, MO) that acted as a mold release agent. The PDMS casting and the second brass master were filled with uncured PDMS and degassed under vacuum, mated together to form the double-sided mold, and cured at 150°C. The resulting 7-well PDMS reservoirs were then demolded.
A double-sided molding strategy was also used for the microfluidic base of the chip.35 To make the AOM support pad, an array of approximately 75 μm diameter, 18 μm deep holes were etched into a silicon wafer (Silicon Quest International, San Jose, CA) using deep reactive ion etching (Alcatel AMS 100 Deep Reactive Ion Etcher) with a low-roughness Bosch process. A secondary mold was cast in PDMS from this wafer and used to make a tertiary mold, also in PDMS, for chip manufacture. Another silicon wafer was etched to give an array of 300 μm wide, 1.6 cm long channels approximately 30 μm high. Uncured PDMS (~10 mL) was spin-coated onto this wafer at 750 rpm for 1 min, degassed under vacuum, and cured for 5 min at 150°C. An additional 10 mL of uncured PDMS was spun onto the PDMS mold of the posts at 550 rpm for 1 min and the PDMS mold was mated to a PDMS layer on the silicon channel mold with the post regions aligned to the ends of the channels. The mold sandwich was degassed under vacuum and then cured for 15 min at 150°C. The resulting chips were demolded, excess PDMS was trimmed, 1-mm holes were punched to connect the post region to the fluidic channel, and waste reservoirs were made with a 3-mm biopsy punch (Sklar Instruments, West Chester, PA). The chips were washed on both sides with isopropanol (Fisher Scientific, Fair Lawn, NJ) and dried with N2 gas. Glass cover slips (20 mm × 35 mm, 0.15 mm thick, Fisher Scientific, Pittsburgh, PA) were cleaned with ELIMINase (Decon Labs, King of Prussia, PA) and dried with N2 gas. The PDMS chips were bonded to the glass cover slips by plasma cleaning both the cover slip and chip for 12 sec at 18 W in a Harrick plasma cleaner (Model PDC-32G, Pleasantville, NY) and then pressing the channel side of the chip onto the cover slip.36 Then an AOM was placed over the post region of the chip using vacuum tweezers. The underside of a 7-well PDMS reservoir was coated with a thin layer of uncured PDMS and placed over the AOM. The cover slip-PDMS-AOM-reservoir sandwich was heated to 95°C for 15 min to cure the PDMS and complete chip fabrication. Chips were stored dry at room temperature. It should be noted that while unsupported AOMs can be fragile and prone to breakage if handled roughly, AOMs integrated into devices can be remarkably robust if properly supported. We have found that the thin layer of PDMS along with the close proximity of the rigid glass substrate sufficiently reinforce the AOM such that no damage was observed in our experiments, even from inadvertent contact with a wayward pipette tip.
2.2 Instrument set-up and detection
Fluorescence imaging was conducted using a modified AZ100 Multizoom microscope (Nikon Instruments Inc., Melville, NY) equipped with a Roper Scientific (Trenton, NJ) frame transfer camera (Model NTE/CCD-512-EBFT, GR-1). A filter set with 470/40 nm excitation, 495 nm dichroic, and 525/50 nm emission (Model 49002 ET - GFP, Chroma Technology Corp., Bellows Falls, VT) was used for fluorescence imaging of the FAM labeled probes.
Thermocycling of the chip was performed using a 40 mm × 40 mm Peltier stage built in-house using a high temperature Peltier device (Model VT-127-1.4-1.15-71; TE Technology, Inc. Traverse City, MI) driven with a Wavelength Electronics, Inc. (Bozeman, MT) model MPT5000 controller. A 250 μm thick layer of silver was bonded to the top of the Peltier device to ensure even heat distribution across its surface, and the bottom of the Peltier was mounted onto a custom temperature controlled heat sink held at 60 °C by a recirculating water bath. Custom software written in LabView using Automicromanager37 in conjunction with μManager38 was used to coordinate temperature cycling with fluorescence imaging.
2.3 PCR development
Ten μL of sample solution was added to each well and vacuum was applied to the waste reservoir until the entire sample had been pulled through the AOM, usually 5–10 minutes. Then 5 μL PCR master mix containing 1x Platinum qPCR Supermix-UDG (Invitrogen, Carlsbad, CA), 0.28 units of additional Platinum Taq DNA polymerase (Invitrogen), and 1% Blocker BSA (Thermo Scientific, Rockford, IL), as well as 0.5 μM of each primer and 0.25 μM of probe was added to each well. The PCR solution in the wells was then overlaid with 5 μL of DNase/RNase free mineral oil (Fisher Scientific). A drop of uncured PDMS was placed in the waste reservoir to seal the channel and prevent evaporation during thermocycling, and the chip was placed on the Peltier stage. The thermocycling program used for all experiments was 2 min at 50°C, 2 min at 95°C, 60 cycles of 30 s at 95°C followed by 65 s at 66°C, with a final extension step of 2 min at 66°C. No optimization of the DNA capture or PCR was required. Images were taken at the end of each amplification cycle with a 500 ms exposure time. Chips were discarded after thermocycling, and a new chip was used for each experiment.
Three bacterial targets were used as models for the development of this device: Streptococcus mutans (ATCC 25175), a control organism commonly found in the human mouth, methicillin-susceptible Staphylococcus aureus (MSSA, ATCC 25923), and methicillin-resistant Staphylococcus aureus (MRSA, ATCC 700699). Purified gDNA for each of the three targets was purchased from ATCC (Manassas, VA). Primer and probe sets for the three targets were purchased from IDT (Coralville, IA) and designed using IDT’s PrimerQuest PCR Design Tool and checked for specificity using NCBI’s Primer-BLAST (http://www.ncbi.nlm.nih.gov/tools/primer-blast/). Primer/probe sets were designed for the 16S rRNA gene of S. mutans, for the nuc gene of S. aureus, and for the mecA gene of MRSA. The sequences for the primers and probes are listed in Table 1. Purified gDNA and the primer/probe sets were resuspended following the instructions provided by each manufacturer.
Table 1.
Primer and probe sequences for the target genes
| Organism/Gene | Sequence |
|---|---|
| S. MUTANS/16S RRNA | |
| forward | 5′-TCTTGATTGGACAGGTCAAGGAAA-3′ |
| reverse | 5′-ACGGCCATTTGGTACATCAACCT-3′ |
| probe | 5′-/56-FAM/AACCCGGTG/ZEN/CCAATGATGTTTGGGTT/3IABkFQ/-3′ |
| S. AUREUS/NUC | |
| forward | 5′-GGTGTAGAGAAATATGGYCCTGAAGC-3′ |
| reverse | 5′-AGCCAAGCCTTGACGAACTAAAGC-3′ |
| probe | 5′-/56-FAM/TGGACGTGG/ZEN/CTTAGCGTATATTTATGCTGA/3IABkFQ/-3′ |
| MRSA/MECA | |
| forward | 5′-CTGGAACTTGTTGAGCAGAGGTTCT-3′ |
| reverse | 5′-ACTGCTATCCACCCTCAAACAGGT-3′ |
| probe | 5′-/56-FAM/GACGTCATA/ZEN/TGAAGGTGTGCTTACAAGTGC/3IABkFQ/-3′ |
For experiments using saliva, whole saliva was collected from a healthy volunteer drooling into a clean 50 mL centrifuge tube. All experiments were performed in compliance with the relevant laws and institutional guidelines, and informed consent was obtained for collecting saliva samples from a willing volunteer. Lysis was performed off-chip by heating the saliva to 95 °C.39, 40 Samples were collected immediately prior to analysis with a new sample collected for each experiment. For experiments using spiked saliva, whole saliva was spiked with purified gDNA to a concentration of 10–12 copies/μL prior to thermal lysis.
Images were analyzed using ImageJ41 (National Institutes of Health, USA) and IgorPro (Wavemetrics, Lake Oswego, OR) to determine if successful amplification had occurred. The average fluorescence signal from each well (~3000 pixels) was measured in each image and the fluorescence was plotted against cycle number. An image taken 3–5 cycles before the start of amplification was used as the background and subtracted from all of the other images.
3. Results
3.1 Primer testing and sensitivity
The primer/probe set designed for each type of bacteria was tested for specificity. These tests were done using a simplified chip design without the lower PDMS layer containing the microposts and channel. AOMs and 7-well PDMS reservoirs were sealed directly onto glass cover slips with uncured PDMS. The wells were filled with master mix containing primers and probes, followed by gDNA in solution. The PCR solution was overlaid with mineral oil to prevent evaporation during thermocycling. Each primer/probe set was tested with purified gDNA from each of the three strains of bacteria and found to be specific to the strain or strains for which it was designed (data not shown). A test of the limit of detection for the S. aureus nuc gene was also performed, as shown in Fig. 2. Amplification was seen in all wells containing template DNA, with amplification beginning at earlier cycles for the wells containing greater amounts of DNA. Duplicate reactions shown in the plot also have nearly identical cycle threshold (Ct) values and the change in Ct values was consistent across the range of concentrations tested. Amplification was seen from as little as 30 fg of MSSA gDNA which corresponds to 8–12 copies. Detecting 8–12 copies of template gDNA was thought to be sufficient for most clinical samples of interest, such that further optimization was not deemed necessary.
Fig. 2.

Real-time amplification plot for varying amounts of MSSA gDNA. 1 ng of MSSA gDNA corresponds to 3×10⁵–4×10⁵ copies, 1 pg of MSSA gDNA corresponds to 300–400 copies, and 30 fg of MSSA gDNA corresponds to 8–12 copies. Cycle threshold (Ct) value is a good indicator of starting concentration of template and duplicate reactions shown in this plot have nearly the same values. Amplification begins at a later cycle for wells containing a smaller amount of template DNA.
3.2 AOM effects and primer spotting
Past work26 and our own experiments (see supplemental information) have indicated that the AOM can inhibit PCR and that the degree of inhibition is directly proportional to the ratio of exposed surface area of membrane to reaction volume. Since PCR on-chip is performed directly on the AOM after DNA extraction, some inhibition is to be expected. Solutions of a basic pH can cause elution of DNA from an AOM17 and as the pH of the PCR master mix used was basic, nucleic acids such as the template DNA, primers, and PCR products are not expected to be bound to the AOM during amplification. The other major concern for PCR inhibition is enzyme adsorption to the membrane.42, 43 We confirmed that by adding BSA26, 42 and additional Taq polymerase to the master mix, the inhibitory effects of the AOM could be minimized (see supplemental information).
Since the contents of all the wells are identical except for the primer/probe set, the possibility of spotting primers and probes to preload them into the wells before DNA extraction was explored to simplify chip operation and reagent delivery. The primers and probes were spotted onto the AOM and allowed to dry before capturing DNA, adding master mix (without primers and probes), and thermocycling the chip as previously described. No amplification was observed, and the results were further investigated to determine why the PCR was unsuccessful. Although it was expected that the primers and probes would remain on the AOM along with the template DNA, we inferred from the lack of amplification that a significant fraction likely eluted during DNA extraction. This could be due to their reduced size compared to gDNA. Although previous work has indicated that high salt buffers can increase DNA retention on AOMs17, 26 the addition of salt to the DNA template solutions did not improve primer retention. Because the primer/probes were not retained, all subsequent experiments were performed by adding the primers and probes with the master mix, after DNA extraction.
3.3 Cross-contamination between wells
In a diagnostic test, the sample (saliva from a patient) will be the same in all wells while the primer and probe set sequences will vary. In this way, simultaneous testing for many species and strains of bacteria by multiplexing in space is possible. Since the same fluorophore is used for detection for all target sequences, it is critical that probes do not travel between wells and create false positives. There are three possible routes for primers and probes to travel into other wells and cause cross-contamination. The first is for cross-contamination over the top of the wells. The volume of mineral oil overlaid on each reaction and the lack of fluid connecting the wells at their tops makes this route unlikely. The second route is for cross-contamination at the interface between the wells and the membrane. When the 7-well reservoir is sealed to the AOM, uncured PDMS wicks into the pores of the AOM and is polymerized. This effectively seals the wells at the surface of the AOM and prevents fluid from flowing laterally through the AOM. Thus each well is fully isolated above the AOM. The third route is for cross-contamination underneath the AOM in the micropost region. Since the wells are not isolated from each other in this region, this is the most likely route of cross-contamination.
To test this cross-contamination scenario, 1 pg of MSSA gDNA was captured in all seven wells of a chip. S. aureus nuc primers and probes were added to three of the wells, S. aureus mecA primers and probes were added to another three wells, and the remaining well had no primers or probes added. A diagram showing the identity of the primers and probes added to each well is shown in the upper left of Fig. 3A. The primers and probes were added such that adjacent wells did not contain identical primers and probes. Figure 3A shows the images collected after amplification cycles 25, 35, and 45 with increases in fluorescence only from the three wells containing the S. aureus nuc primer/probe set. As shown in the amplification plot in Fig. 3B, the only wells showing amplification were those containing the primer/probe set for the S. aureus nuc gene. This indicates that each well remains isolated from the others to the extent that any amount of primers or probes traveling between the wells is not sufficient to result in an increase in fluorescence. As future experiments were performed, no false positives were detected in any known negative wells. This gives further confirmation that no cross-contamination is occurring between wells and any increases in fluorescence from a well can be attributed to the primers and probes initially added to that well.
Fig. 3.

(A) Fluorescence images of the wells following amplification cycles 25, 35, and 45. The upper left shows the primer set added to each well (colors correspond to the legend in B). (B) Real-time amplification plot for S. aureus nuc and S. aureus mecA genes from the same experiment as the images in A, demonstrating that there is no cross-contamination between wells. Each well contained 1 pg of MSSA gDNA as the sample while the primers were varied between the wells. There are three wells corresponding to each primer set and one blank well that did not contain any primers or probes.
3.4 Simultaneous multi-analyte detection
With no cross-contamination observed, the simultaneous detection of two bacterial species mixed in various combinations was undertaken. The initial test sample solution contained gDNA from both MSSA and S. mutans with 1 pg of gDNA from each species captured in each well. Primers and probes for the S. mutans 16S rRNA, S. aureus nuc, and S. aureus mecA genes were added to two wells each while the center well was left blank with no primers or probes. Amplification was seen for the target S. mutans 16S rRNA gene and the S. aureus nuc gene, shown in supplemental information Fig. S2. No amplification was seen in the blank and S. aureus mecA wells. Additional experiments with varying bacterial combinations showed positive identification in the appropriate wells with no false positives detected (data not shown). This demonstrates that multiplexing in space is possible with this chip design.
3.5 Detection of bacteria in saliva
The detection of bacteria from a whole saliva sample was used to simulate a clinical sample. A whole saliva sample was collected from a healthy volunteer and heated to 95°C to thermally lyse all cells.39, 40 On-chip DNA extraction was performed using the lysed sample. Each of the three primer and probe sets (S. mutans 16S rRNA, S. aureus nuc, and S. aureus mecA) was added to two wells and the seventh well was left as a blank. S. mutans was chosen as a control organism because it is commonly found in the human mouth and therefore assumed to be present in all collected saliva samples.34 The amplification plot in Fig. 4A shows that only the S. mutans 16S rRNA gene wells exhibited PCR amplification as would be expected for a sample from a healthy volunteer.
Fig. 4.
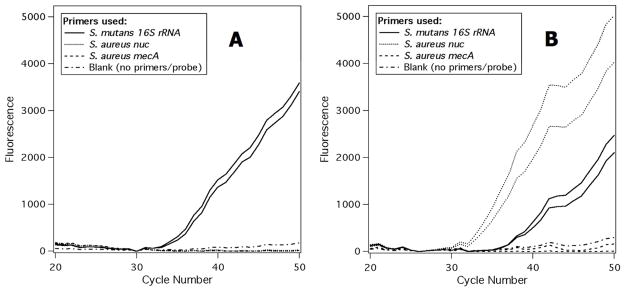
Real-time amplification plots for S. mutans 16S rRNA, S. aureus nuc, and S. aureus mecA genes. In each plot there are two wells corresponding to each primer set and one blank well that did not contain any primers or probes. (A) Whole saliva was used as the sample. Positive results are seen only for S. mutans, the control organism. (B) Whole saliva spiked with 0.33 pg MSSA gDNA was used as the sample. Positive results are seen for S. mutans and S. aureus but not for MRSA, as expected.
To simulate saliva from an infected individual, purified MSSA gDNA was spiked into saliva from the same healthy volunteer prior to thermal lysis. The sample was spiked with MSSA gDNA to a concentration of 10–12 copies/μL. A volume of 10 μL of spiked saliva was added to each well and on-chip DNA extraction was performed. Positive amplification was seen for the S. mutans 16S rRNA gene and S. aureus nuc gene (Fig. 4B) with the S. aureus mecA wells negative. This experiment was repeated with MRSA gDNA in place of the MSSA gDNA and, as expected, amplification was seen from all three primer and probe sets (data not shown).
4. Discussion
We have developed a PDMS/AOM/glass hybrid device integrating DNA extraction, PCR amplification, and on-chip detection. The analysis time to go from a whole saliva sample to results was less than 2.5 hours. The on-chip sample preparation is particularly fast and simple. The DNA extraction step takes only a few minutes while still capturing sufficient gDNA to detect 100–125 copies spiked into a whole saliva sample. This is considerably faster than other methods that can sometimes result in inhibition of downstream PCR.44 Unlike other DNA extraction procedures, no centrifugation or washing steps are required. The only actions performed by the user are pipetting reagents into the reaction wells and applying vacuum to the waste. This uncomplicated DNA extraction means the chip could be paired with automated reagent dispensing to make a device suitable for use in a clinical setting. While a 10 μL sample size was used for the experiments described here, a larger volume could be used if the sample is very dilute, taking advantage of the AOM to concentrate the DNA in the sample. If necessary, multiple volumes of sample could be filtered through the AOM in each well or larger wells could be accommodated.
There are several advantages to our design using multiple singleplex assays over a single, one-pot multiplexed assay. In multiple singleplex assays there will not be any competition between PCR primers and probes that can affect amplification efficiencies. In one-pot multiplexed assays, overlapping primers can produce dimers, reducing amplification of the target; other non-specific interactions between primers and DNA or amplicons from other primer sets can also prevent target amplification and detection.45 Moreover, for one-pot multiplexed real-time assays, different fluorophores are needed for each probe in order to distinguish between targets. Currently, the number of fluorophores that can be simultaneously analyzed is limited to approximately four due to spectral overlap.46 By multiplexing in space, the same fluorophore can be used for probes for all targets, simplifying the detector optical train. Fluorescence from a particular well denotes the presence of the target corresponding to the primer/probe set in that well.
No attempt was made to optimize the thermocycling conditions for these experiments as the focus of this study was on the integration of sample preparation with multiple, parallel rtPCR reactions. Therefore, the majority of the analysis time (>2 h) was due to thermocycling. While there are many examples of much more rapid thermocycling on a microfluidic chip,15, 47–50 the overall analysis time for this prototype is still much faster than receiving results from a centralized lab. Slow thermocycling conditions were used to ensure that both the PDMS and glass substrate had sufficient time to reach the desired temperatures. Additionally, the chip is heated from below so that it can be imaged from above. The PCR solutions are located above the AOM, so the glass substrate, AOM, and PDMS layers must be heated and cooled to the target temperature before the reaction mixture will reach the desired temperature. Alternative and more efficient heating strategies, use of more thermally conductive materials, and decreasing the volume of the wells would likely reduce the thermocycling time and allow more wells to fit on a chip, increasing the number of targets for which the sample can be simultaneously tested. A commercial PCR assay, Cepheid’s GeneXpert™ system (Sunnyvale, CA), can test for a variety of targets in less than an hour including sample preparation and thermocycling but a different cartridge must be used for each target. Our prototype can test for the presence of up to seven targets simultaneously, saving time as testing for multiple targets is often needed in clinical analysis.
For the development of the chip, rtPCR data was collected. Real-time data makes assessing experimental effects such as air bubbles or evaporation possible, and can give quantitative information when properly calibrated. Monitoring the time when amplification begins as well as the shape of the amplification curves also makes it easier to determine if any experimental changes are inhibiting PCR. For a diagnostic device, the use of end-point detection would be satisfactory for determining a positive or negative response. This would simplify the data processing requirements. For detection of oral microbes used as biomarkers for diseases such as pancreatic cancer, the concentration of the organism is important rather than just its presence,33 so quantitative real-time data collected in a manner similar to our approach would be necessary.
5. Conclusions
We have developed a microfluidic chip to perform DNA extraction and rtPCR amplification of the extracted DNA. We have successfully used it to detect bacteria (S. mutans) and spiked pathogenic bacterial gDNA (from S. aureus) in a whole saliva sample in less than 2.5 hours. By using a PCR-compatible AOM for DNA extraction, we integrated an important sample preparation step onto the chip without requiring complex chip architecture to move DNA from a sample preparation region to an amplification region. Using rtPCR, detection was simultaneously performed during amplification, eliminating the need for a detection region separate from the PCR region. Different primer sets were used in the chip’s seven reaction wells, testing for multiple organisms without the complications of designing a multiplexed PCR reaction. The strategy of using many reaction wells, each containing a singleplex PCR reaction, also simplified the instrumentation needed for detection and allows the chip to be easily adapted for different target organisms. The primer and probe sets can be easily switched for sets corresponding to new targets.
Supplementary Material
Acknowledgments
This work was supported by National Institutes of Health (NIH) and National Institute of Dental and Craniofacial Research (NIDCR) grant number U01DE017788-2. Fabrication of Si molds using DRIE was developed with funding from the University Cancer Research Fund (UCRF) Core Facility Pilot Project Award in collaboration with the Chapel Hill Analytical and Nanofabrication Laboratory (CHANL).
References
- 1.Mairhofer J, Roppert K, Ertl P. Sensors. 2009;9:4804–4823. doi: 10.3390/s90604804. [DOI] [PMC free article] [PubMed] [Google Scholar]
- 2.McPherson RA, Pincus MR, editors. Henry’s Clinical Diagnosis and Management by Laboratory Methods. Saunders Elsevier; Philadelphia: 2007. [Google Scholar]
- 3.Lien KY, Liu CJ, Kuo PL, Lee GB. Anal Chem. 2009;81:4502–4509. doi: 10.1021/ac900453d. [DOI] [PubMed] [Google Scholar]
- 4.Sauer-Budge AF, Mirer P, Chatterjee A, Klapperich CM, Chargin D, Sharon A. Lab Chip. 2009;9:2803–2810. doi: 10.1039/b904854e. [DOI] [PubMed] [Google Scholar]
- 5.Tang YW, Procop GW, Persing DH. Clin Chem. 1997;43:2021–2038. [PubMed] [Google Scholar]
- 6.Doring G, Unertl K, Heininger A. Clin Chem Lab Med. 2008;46:909–918. doi: 10.1515/CCLM.2008.152. [DOI] [PubMed] [Google Scholar]
- 7.Yeung SW, Lee TMH, Cai H, Hsing IM. Nucleic Acids Res. 2006;34:e118. doi: 10.1093/nar/gkl702. [DOI] [PMC free article] [PubMed] [Google Scholar]
- 8.Zhang CS, Xing D. Nucleic Acids Res. 2007;35:4223–4237. doi: 10.1093/nar/gkm389. [DOI] [PMC free article] [PubMed] [Google Scholar]
- 9.Heo J, Hua SZ. Sensors. 2009;9:4483–4502. doi: 10.3390/s90604483. [DOI] [PMC free article] [PubMed] [Google Scholar]
- 10.Zhang CS, Xu JL, Ma WL, Zheng WL. Biotechnol Adv. 2006;24:243–284. doi: 10.1016/j.biotechadv.2005.10.002. [DOI] [PubMed] [Google Scholar]
- 11.Liu P, Mathies RA. Trends Biotechnol. 2009;27:572–581. doi: 10.1016/j.tibtech.2009.07.002. [DOI] [PubMed] [Google Scholar]
- 12.Mariella R. Biomed Microdevices. 2008;10:777–784. doi: 10.1007/s10544-008-9190-7. [DOI] [PMC free article] [PubMed] [Google Scholar]
- 13.Thaitrong N, Toriello NM, Del Bueno N, Mathies RA. Anal Chem. 2009;81:1371–1377. doi: 10.1021/ac802057f. [DOI] [PubMed] [Google Scholar]
- 14.Chen D, Mauk M, Qiu X, Liu C, Kim J, Ramprasad S, Ongagna S, Abrams W, Malamud D, Corstjens P, Bau H. Biomed Microdevices. 2010;12:705–719. doi: 10.1007/s10544-010-9423-4. [DOI] [PMC free article] [PubMed] [Google Scholar]
- 15.Easley CJ, Karlinsey JM, Bienvenue JM, Legendre LA, Roper MG, Feldman SH, Hughes MA, Hewlett EL, Merkel TJ, Ferrance JP, Landers JP. Proc Natl Acad Sci. 2006;103:19272–19277. doi: 10.1073/pnas.0604663103. [DOI] [PMC free article] [PubMed] [Google Scholar]
- 16.Dames S, Bromley LK, Herrmann M, Elgort M, Erali M, Smith R, Voelkerding KV. J Mol Diagn. 2006;8:16–21. doi: 10.2353/jmoldx.2006.040398. [DOI] [PMC free article] [PubMed] [Google Scholar]
- 17.Kim J, Gale BK. Lab Chip. 2008;8:1516–1523. doi: 10.1039/b804624g. [DOI] [PubMed] [Google Scholar]
- 18.Kim J, Johnson M, Hill P, Gale BK. Integr Biol. 2009;1:574–586. doi: 10.1039/b905844c. [DOI] [PubMed] [Google Scholar]
- 19.Wen J, Legendre LA, Bienvenue JM, Landers JP. Anal Chem. 2008;80:6472–6479. doi: 10.1021/ac8014998. [DOI] [PubMed] [Google Scholar]
- 20.Pjescic I, Crews N. Lab Chip. 2012;12:2514–2519. doi: 10.1039/c2lc00010e. [DOI] [PubMed] [Google Scholar]
- 21.Liu RH, Yang J, Lenigk R, Bonanno J, Grodzinski P. Anal Chem. 2004;76:1824–1831. doi: 10.1021/ac0353029. [DOI] [PubMed] [Google Scholar]
- 22.Ramalingam N, Liu HB, Dai CC, Jiang Y, Wang H, Wang QH, Hui KM, Gong HQ. Biomed Microdevices. 2009;11:1007–1020. doi: 10.1007/s10544-009-9318-4. [DOI] [PubMed] [Google Scholar]
- 23.Elgort MG, Herrmann MG, Erali M, Durtschi JD, Voelkerding KV, Smith RE. Clin Chem. 2004;50:1817–1819. doi: 10.1373/clinchem.2004.035162. [DOI] [PubMed] [Google Scholar]
- 24.Kim J, Voelkerding KV, Gale BK. IEEE/EMBS Special Topic Conference on Microtechnology in Medicine and Biology. Institute of Electrical and Electronics Engineers; Kahuku, HI, United States: 2005. pp. 5–7. [Google Scholar]
- 25.Kim J, Voelkerding KV, Gale BK. J Micromech Microeng. 2006;16:33–39. [Google Scholar]
- 26.Kim J, Mauk M, Chen DF, Qiu XB, Kim J, Gale B, Bau HH. Analyst. 2010;135:2408–2414. doi: 10.1039/c0an00288g. [DOI] [PMC free article] [PubMed] [Google Scholar]
- 27.Aas JA, Paster BJ, Stokes LN, Olsen I, Dewhirst FE. J Clin Microbiol. 2005;43:5721–5732. doi: 10.1128/JCM.43.11.5721-5732.2005. [DOI] [PMC free article] [PubMed] [Google Scholar]
- 28.Deutsch O, Fleissig Y, Zaks B, Krief G, Aframian DJ, Palmon A. Electrophoresis. 2008;29:4150–4157. doi: 10.1002/elps.200800207. [DOI] [PubMed] [Google Scholar]
- 29.Greiner O, Day PJR, Bosshard PP, Imeri F, Altwegg M, Nadal D. J Clin Microbiol. 2001;39:3129–3134. doi: 10.1128/JCM.39.9.3129-3134.2001. [DOI] [PMC free article] [PubMed] [Google Scholar]
- 30.Helton KL, Nelson KE, Fu E, Yager P. Lab Chip. 2008;8:1847–1851. doi: 10.1039/b811150b. [DOI] [PubMed] [Google Scholar]
- 31.Hofman LF. J Nutr. 2001;131:1621S–1625S. doi: 10.1093/jn/131.5.1621S. [DOI] [PubMed] [Google Scholar]
- 32.Roth SB, Jalava J, Ruuskanen O, Ruohola A, Nikkari S. J Clin Microbiol. 2004;42:4268–4274. doi: 10.1128/JCM.42.9.4268-4274.2004. [DOI] [PMC free article] [PubMed] [Google Scholar]
- 33.Farrell JJ, Zhang L, Zhou H, Chia D, Elashoff D, Akin D, Paster BJ, Joshipura K, Wong DTW. Gut. 2012;61:582–588. doi: 10.1136/gutjnl-2011-300784. [DOI] [PMC free article] [PubMed] [Google Scholar]
- 34.Petti S, Pezzi R, Cattaruzza MS, Osborn JF, Darca AS. J Dent. 1997;25:257–262. doi: 10.1016/s0300-5712(96)00035-8. [DOI] [PubMed] [Google Scholar]
- 35.Lucas N, Demming S, Jordan A, Sichler P, Büttgenbach S. J Micromech Microeng. 2008;18:075037. [Google Scholar]
- 36.Sia SK, Whitesides GM. Electrophoresis. 2003;24:3563–3576. doi: 10.1002/elps.200305584. [DOI] [PubMed] [Google Scholar]
- 37.Ashcroft BA, Oosterkamp T. Rev Sci Instrum. 2010;81:4. doi: 10.1063/1.3499370. [DOI] [PubMed] [Google Scholar]
- 38.Edelstein A, Amodaj N, Hoover K, Vale R, Stuurman N. Current Protocols in Molecular Biology. John Wiley & Sons, Inc; 2001. [DOI] [PMC free article] [PubMed] [Google Scholar]
- 39.Holmes DS, Quigley M. Anal Biochem. 1981;114:193–197. doi: 10.1016/0003-2697(81)90473-5. [DOI] [PubMed] [Google Scholar]
- 40.Membrillo-Hernández J, Núñez-de la Mora A, del Rio-Albrechtsen T, Camacho-Carranza R, Gomez-Eichelmann MC. J Basic Microbiol. 1995;35:41–46. doi: 10.1002/jobm.3620350112. [DOI] [PubMed] [Google Scholar]
- 41.Rasband WS. ImageJ. U.S. National Institutes of Health; Bethesda, MD, USA: 1997–2011. http://imagej.nih.gov/ij/ [Google Scholar]
- 42.Kolari K, Satokari R, Kataja K, Stenman J, Hokkanen A. Sensors Actuators B: Chem. 2008;128:442–449. [Google Scholar]
- 43.Wilson IG. Appl Environ Microbiol. 1997;63:3741–3751. doi: 10.1128/aem.63.10.3741-3751.1997. [DOI] [PMC free article] [PubMed] [Google Scholar]
- 44.van Tongeren SP, Degener JE, Harmsen HJM. Eur J Clin Microbiol Infect Dis. 2011;30:1053–1061. doi: 10.1007/s10096-011-1191-4. [DOI] [PMC free article] [PubMed] [Google Scholar]
- 45.SantaLucia J., Jr . In: PCR Primer Design. Yuryev A, editor. Humana Press; Totowa, NJ: 2007. pp. 3–33. [Google Scholar]
- 46.Huang QY, Zheng LL, Zhu YM, Zhang JF, Wen HX, Huang JW, Niu JJ, Zhao XL, Li QG. Plos One. 2011;6:e16033. doi: 10.1371/journal.pone.0016033. [DOI] [PMC free article] [PubMed] [Google Scholar]
- 47.Ahmad F, Hashsham SA. Anal Chim Acta. 2012;733:1–15. doi: 10.1016/j.aca.2012.04.031. [DOI] [PubMed] [Google Scholar]
- 48.Prakash AR, De La Rosa C, Fox JD, Kaler K. Microfluid Nanofluid. 2008;4:451–456. [Google Scholar]
- 49.Wang CH, Lien KY, Hung LY, Lei HY, Lee GB. Microfluid Nanofluid. 2012;13:113–123. [Google Scholar]
- 50.Yu Y, Li B, Baker CA, Zhang X, Roper MG. Anal Chem. 2012;84:2825–2829. doi: 10.1021/ac203307h. [DOI] [PMC free article] [PubMed] [Google Scholar]
Associated Data
This section collects any data citations, data availability statements, or supplementary materials included in this article.