Abstract
Fatty acid synthase (FASN) is a key enzyme in the synthesis of palmitate, the precursor of major nutritional, energetic, and signaling lipids. FASN expression is upregulated in many human cancers and appears to be important for cancer cell survival. Overexpression of FASN has also been found to associate with poor prognosis and higher risk of recurrence of human cancers. Indeed, elevated FASN expression has been shown to contribute to drug resistance. However, the mechanism of FASN-mediated drug resistance is currently unknown. In this study, we show that FASN overexpression causes resistance to multiple anticancer drugs via inhibiting drug-induced ceramide production, caspase 8 activation, and apoptosis. We also show that FASN overexpression suppresses tumor necrosis factor-α production and nuclear factor-κB activation as well as drug-induced activation of neutral sphingomyelinase. Thus, TNF-α may play an important role in mediating FASN function in drug resistance.
Keywords: tumor necrosis factor, NK-kappa B, neutral sphingomyelinase, doxorubicin
Fatty acid synthase (FASN) is a key enzyme in the biosynthesis of palmitate, a precursor of some biologically important lipids, such as phosphoinositides (for a review, see Ref. 1). Mammalian FASN is a homo-dimer of a multifunctional protein of ∼270 kDa containing seven catalytic domains: β-ketoacyl synthase, malonyl/acetyltransferase, dehydrogenase, enoyl reductase, β-ketoacyl reductase, acyl carrier protein, and thioesterase. Under normal physiological conditions, circulating free fatty acids (FAs) from diet are the preferred source, and de novo FA synthesis is minimally needed. Thus, the FASN expression level is low in normal nonadipose tissues/cells. Cancer cells, however, synthesize more than 90% of their triacylglycerol de novo, requiring increased FASN expression (1). The important role of FASN in cancer cell proliferation/survival and its potential oncogenic function have been demonstrated in several previous studies (2–8).
Overexpression of FASN has been associated with poor prognosis and higher risk of recurrence of human cancers of the breast (9–12) and prostate (13), as well as many other types of cancers (1), suggesting that increased FASN expression may also contribute to disease progression and treatment failure. In particular, FASN overexpression has been found in a drug-selected breast cancer cell line, and this elevation contributes to cellular resistance to Adriamycin (doxorubicin) and mitoxantrone in breast (14) and to gemcitabine in pancreatic cancer cells (15). However, the mechanism by which FASN contributes to drug resistance is currently unknown.
In this study, we investigated the molecular mechanism of FASN-mediated drug resistance using FASN overexpression stable clones of MCF7 cells and found that FASN overexpression causes resistance to multiple anticancer drugs as well as to γ-irradiation via inhibiting treatment-induced ceramide production, caspase 8 activation, and apoptosis. Further studies showed that FASN overexpression suppresses tumor necrosis factor (TNF)-α production, nuclear factor (NF)-κB activation, and drug-induced activation of neutral sphingomyelinase (nSMase). Hence, FASN overexpression may cause drug resistance by inhibiting TNF-α expression, which in turn suppresses activation of NF-κB and nSMase and, thus, reduced ceramide production, caspase 8 activation, and apoptosis.
MATERIALS AND METHODS
Materials
All electrophoresis reagents and polyvinylidene difluoride (PVDF) membranes were purchased from Bio-Rad (Hercules, CA). Doxorubicin, mitoxantrone, cisplatin, etopside, paclitaxel, vinblastine, verapamil, and DTT were from Sigma (St. Louis, MO). Cell culture mediums DMEM and typsin-versene mixture were purchased from Media Tech (Herndon, CA) or Lonza (Walkersville, MD). Monoclonal antibody against human FASN and ceramide were purchased from BD Biosciences (San Jose, CA) and Enzo Life Sciences (Farmingdale, NY), respectively. Monoclonal antibody against cleaved poly(ADP-ribose) polymerase (PARP), caspase-8, cleaved caspase-8, and cleaved caspase-9 were obtained from Cell Signaling (Danver, MA). G418 was from Invitrogen (Carlsbad, CA). Specific siRNA targeting human FASN mRNA (sc-43758) was purchased from Santa Cruz Biotechnology. Specific siRNAs targeting human nSMase-2 and FASN were purchased from Qiagen and Santa Cruz Biotechnology, respectively. The NF-κB reporter expression construct and its negative control plasmid of the PathDetect NF-κB Cis-Reporting System were from Agilent Technologies (Santa Clara, CA). All other chemicals were of molecular biology grade from Sigma (St. Louis, MO) or Fisher Scientific (Chicago, IL).
Cell culture
FASN-overexpressing MCF7 clones (FASN1 and FASN2) and vector-transfected control clone (Vec) were generated previously (14) and maintained in DMEM medium supplemented with 10% fetal bovine serum, 100 units/ml penicillin, 100 mg/ml streptomycin, and 400 µg/ml G418. MCF7/AdVp3000 and its stable clone with FASN knockdown were also generated in the previous study (14) and maintained in DMEM as previously described (14).
Cell lysate preparation and Western blot analysis
Cells were washed with phosphate-buffered saline (PBS) and then lysed in a buffer [1% Triton X-100, l50 mM NaCl, 10 mM Tris (pH 7.4), 1 mM EDTA, 1 mM EGTA (pH 8.0), 0.2 mM sodium orthovanadate, 0.2 mM phenylmethylsulfonyl fluoride, 0.5% Nonidet P-40, and 0.1% SDS) for 30 min at 4°C with constant agitation. The cell lysates were sonicated briefly followed by centrifugation (16,000 g, 4°C) for 15 min to remove insoluble materials. The protein concentration of the soluble fraction (cell lysates) was determined using a Bio-Rad protein assay kit.
Western blot analysis was done as described previously (12–14). Briefly, cell lysates were separated by SDS-polyacrylamide gel electrophoresis followed by transfer to a PVDF membrane. The blot was then probed with a monoclonal antibody to FASN, cleaved PARP, AKT, NF-κB p65, c-FLIP, or caspases, followed by reaction with horseradish peroxidase-conjugated secondary antibodies. The signal was captured by X-ray film using enhanced chemiluminescence.
FASN activity assay
FASN activity was determined using a protocol previously described (14). Briefly, 120 μg of particle-free supernatant of cell lysate was mixed with a buffer containing 200 mM potassium phosphate (pH 6.6), 1 mM DTT, 1 mM EDTA, 0.24 mM NADPH, and 30 μM acetyl-CoA in a final volume of 0.3 ml, and the reaction was monitored at 340 nm for 3 min to measure background NADPH oxidation. After addition of 50 μM malonyl-CoA, the reaction was monitored for an additional 15 min to determine FASN-dependent oxidation of NADPH using a Synergy H1 hybrid reader with Gen5 2.0 software (BioTek Instruments). The rate change of OD340nm was corrected for the background rate of NADPH oxidation. The change in concentration of NADPH during oxidation was calculated using the following equation:
where ΔC is change in the concentration of NADPH, ΔA is change in absorbance, and E is extinction coefficient of NADPH (E340nm = 6.22 mM−1∙cm−1). FASN activity was expressed as nmol NADPH oxidized/min/mg protein.
Real-time RT-PCR
Real-time RT-PCR was performed as described previously (14, 16). Briefly, cells were harvested, and total RNA was extracted using the RNeasy Mini Kit (Qiagen, Valencia, CA) followed by real-time RT-PCR using the Power SYBR Green RNA-to-CT 1-Step kit (Applied Biosystem, Carlsbad, CA). Data were normalized to an internal control gene, glyceraldehyde-3-phosphate dehydrogenase (GAPDH). Primer pairs used were 5′-GCTGACCCCAGGCTGTGA-3′ (forward) and 5′-TGCTCCATGTCCGTGAACTG-3′ (reverse) for FASN; 5′-CCCAGGCAGTCAGATCATCTTC-3′ (forward) and 5′-GGTTTGCTACAACATGGGCTACA-3′ (reverse) for TNF-α and 5′-AGGACTGGCTGGCTGATTTC-3′ (forward) and 5′-TGTCGTCAGAGGAGCAGTTATC-3′ (reverse) for nSMase-2. Analysis of a single PCR product was confirmed by melt-curve analysis.
ELISA
TNF-α level in the medium was measured using Human TNF-α ELISA kit (Thermo Fisher Scientific, Rockford, IL) according to the manufacturer's instructions. Briefly, vector-transfected or FASN1 and FASN2 clones of MCF7 cells were seeded at 1 × 10⁵ cells/well in 48-well plates and on the next day treated with 1 µM doxorubicin or control vehicle for 6 h followed by collection of medium and determination of TNF-α protein concentration.
Cytotoxicity assay
The cytotoxicity of the cells to anticancer drugs or γ-irradiation was determined using the sulforhodamine B (SRB) colorimetric assay as previously described (6). Briefly, cells in 96-well plates were cultured for 24 h and treated with different concentrations of anticancer drugs for three days. The culture medium was then removed, and the cells were fixed and stained by 0.4% (w/v) sulforhodamine B (Sigma) in 1% acetic acid followed by washing with 1% acetic acid to remove the unbound SRB. The bound SRB was then solubilized with 10 mM Tris base, and the OD570 nm was determined using a 96-well plate reader (MRX; Dynex Technologies, Chantilly, VA).
TNF-α promoter reporter construct engineering
TNF-α promoter was amplified using genomic DNA from MCF7 cells as template and primers 5′-ACTCGAGGCCGCCAGACTGCTGCAGGG-3′ (forward) and 5′-ACCATGGAGAGGGTGGAGCCGTGGGTCA-3′ (reverse) derived from the sequence of human TNF-α promoter in GenBank (AY274896). The PCR product was first cloned into pGEM-T easy vector (Promega, Madison, WI) and reengineered into the promoterless luciferase reporter vector pGL4.10 (Promega). The final luciferase report construct was verified by double-strand DNA sequencing.
Luciferase reporter assay
For the assay of TNF-α promoter activity, MCF7 cells with stable FASN overexpression or MCF7/AdVp3000 cells with stable FASN knockdown and their respective control cells were seeded at 5 × 10⁴ cells/well in 24-well plates and transfected with the firefly luciferase reporter construct driven by the TNF-α promoter. Renilla luciferase reporter with a TK promoter was used as a control for transfection efficiency. Forty-eight hours after transfection, cells were washed three times with PBS and lysed in passive lysis buffer (Promega, Madison, WI). Luciferase activity was measured using the dual luciferase reporter assay system according to the manufacturer's instructions (Promega).
For the assay of NF-κB activity, the same procedures were followed as described above using the PathDetect NF-κB Cis-Reporting System along with the renilla luciferase reporter driven by a TK promoter as a control for transfection efficiency. Basal NF-κB activity was detected 48 h after transfection. For doxorubicin-induced NF-κB activity, MCF7/AdVp3000 cells were treated with 0.1 µM doxorubicin for 24 h in the presence of 10 µM FTC after reporter transfection, followed by determination of luciferase activity.
Transient knockdown of target genes
For transient knockdown of FASN and nSMase-2, ∼30 nM siRNA duplexes along with control scrambled siRNAs were transiently transfected into cells using Metafectene Pro transfection reagent (Biontex, CA) as previously described (14). nSMase-2 isoform was chosen among the nSMase family because nSMase-2, but not nSMase-1 or nSMase-3, has been identified as the major TNF-α-responsive nSMase in MCF7 cells (17, 18).
Apoptosis assay
The cell death detection ELISA (Roche, Mannheim, Germany) assay was conducted to determine apoptosis in control and FASN-overexpression MCF7 cells after treatment with or without 1 μM doxorubicin for 48 h. PARP cleavage, another indicator of apoptosis, was analyzed using Western blot probed with an antibody that detects only the large fragment of the cleaved PARP to avoid potential confusion from detection of the uncleaved PARP.
Determination of ceramide level
Ceramides were extracted as previously described (19). Briefly, MCF7 cells with stable FASN overexpression and vector-transfected control cells were resuspended in 0.5 ml PBS, mixed with 10 µl of 2.5 ng/l 17:0 ceramide as internal standards and 3 ml of methanol/chloroform (2:1), followed by incubation on ice for 10 min. Chloroform (1 ml) and water (1.3 ml) were then added to the mixture and vortexed for 1 min prior to centrifugation at 1,750 g for 10 min at 10°C. The organic phase was transferred to a new glass tube for evaporation of the solvent under nitrogen at room temperature. The dried lipids were dissolved in 1 ml of methanol for ESI-MS analyses using API-4000 (Applied Biosystems/MDS SCIEX, Forster City, CA) with an Analyst data acquisition system. Samples (10 µl each) were delivered into the electrospray ionization (ESI) source through a LC system (Agilent 1100) with an auto sampler. The mobile phase was methanol/water/ammonium hydroxide (90:10:0.1, v/v/v). Standard curves for all ceramides were established quantitative analyses.
The effect of GW4869 on total ceramide production was determined using immunofluorescence staining as previously described (20). Briefly, MCF7 cells were treated with 10 μM GW4869 or 5% methane sulfonic acid vehicle for 30 min, and then treated with 1 μM ADR or vehicle DMSO for 24 h. Cells were then harvested, fixed, and permeabilized using the BD Cytofix/Cytoperm Plus kit (BD, Franklin Lakes, NJ), followed by staining with monoclonal anti-ceramide antibody and FITC-conjugated secondary antibody. DAPI was used to stain total DNA as a control. Fluorescence was measured using a Synergy H1 plate reader with FITC at excitation/emission of 485/535 nm and DAPI at 350/470 nm. FITC fluorescence intensity was adjusted by that of the DAPI.
nSMase activity assay
nSMase activity was determined using the sphingomyelinase assay kit from Echelon Biosciences (Salt Lake City, UT) following manufacturer's instructions. Briefly, vector-transfected and FASN1 or FASN2 stable clones of MCF7 cells were treated with or without 1 μM doxorubicin for 48 h. Cells were then harvested, lysed, and centrifuged at 20,000 g for 10 min to remove insoluble and noncytosolic proteins. About 100 µg of cytosolic proteins were used for determination of nSMase activity.
RESULTS
FASN overexpression causes resistance to multiple chemotherapeutic agents and γ-irradiation
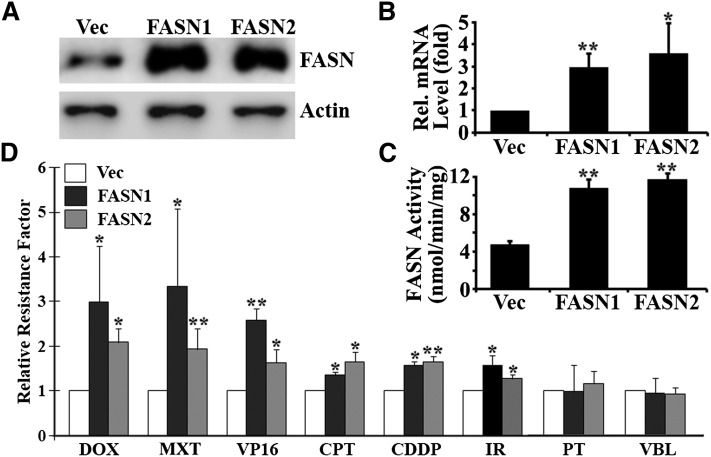
We have shown previously that ectopic overexpression of FASN increases cellular resistance to doxorubicin and mitoxantrone (14). To determine whether FASN overexpression contributes to multidrug resistance, we tested the response of two previously established MCF7 clones with ectopic overexpression of FASN (FASN1 and FASN2) to multiple anticancer drugs in comparison with control cells transfected with vector (Vec). Fig. 1A–C shows that both FASN1 and FASN2 clones have increased FASN mRNA and protein levels as well as FASN activity compared with the Vec control cells. However, the two clones do not appear to differ significantly in FASN expression and activity. Fig. 1D shows that both FASN1 and FASN2 cells are significantly more resistant than the control Vec clone to doxorubicin, mitoxantrone, etopside, camptothecin, and cisplatin with 1.5- to 3-fold increases in relative resistance factor. However, the relative resistance factor between FASN1 and FASN2 cells is not significantly different, consistent with FASN expression level and activity between the two cells. Interestingly, FASN overexpression had no significant effect on cellular response to vinblastine and paclitaxel. These observations suggest that FASN overexpression may cause cellular resistance to DNA-damaging drugs but not to microtubule modulators, such as vinca alkaloids, in MCF7 cells. To further test this notion, these cells were treated with γ-irradiation followed by survival analysis. Fig. 1D shows that both FASN1 and FASN2 cells are also significantly more resistant to γ-irradiation than the Vec control cells.
Fig. 1.
Effect of FASN overexpression on cellular resistance to chemotherapeutic agents and γ-irradiation. Stable MCF7 cells with FASN overexpression (FASN1 and FASN2) and vector-transfected control (Vec) cells were tested for their level of FASN expression using Western blot analysis (A), real-time RT-PCR (B), and FASN activity assay (C), and for their resistance to various anticancer drugs and γ-irradiation using SRB cytotoxicity assay (D) as described in Materials and Methods. Dose response of SRB assay was analyzed by GraphPad Prism (version 3.02) to generate IC50. Relative resistance factor = IC50 of FASN overexpressing cells/IC50 of vector-transfected control cells. CDDP, cisplatin; CPT, camptothecin; DOX, doxorubicin; IR, γ-irradiation; MXT, mitoxantrone; PT, paclitaxel; VBL, vinblastine; VP16, etopside. *P < 0.05; **P < 0.01.
FASN overexpression protects cancer cells from drug-induced apoptosis via inhibiting caspase 8 activation
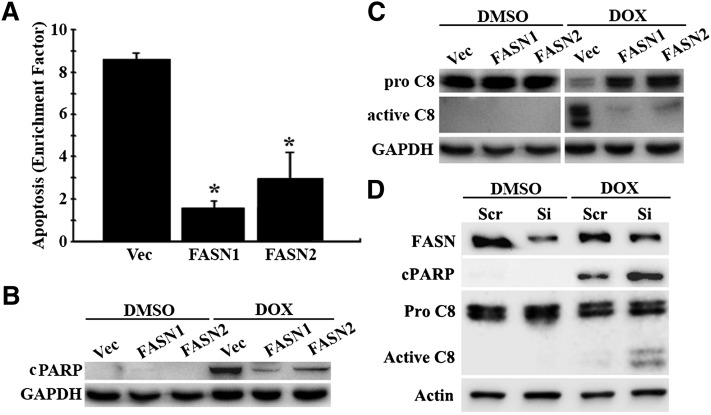
To determine whether FASN overexpression protects cells from drug-induced apoptosis, we first tested the drug-induced apoptosis rate of FASN1 and FASN2 stable clones compared with Vec control cells using the cell death detection ELISA kit that quantifies the level of DNA fragmentation. As shown in Fig. 2A, both FASN1 and FASN2 clones had significantly lower levels of doxorubicin-induced DNA fragmentation compared with the Vec control cells. We next analyzed cleaved PARP, another indicator of apoptosis (21, 22), using Western blot and found that the production of the 89 kDa cleaved PARP was significantly less in response to doxorubicin treatment in FASN1 and FASN2 cells than in the Vec control cells (Fig. 2B), consistent with the findings using ELISA assay. Together, these results show that FASN overexpression likely inhibits drug-induced apoptosis and thus contributes to doxorubicin resistance in MCF7 cells.
Fig. 2.
Effect of FASN overexpression on drug-induced apoptosis. Stable MCF7 cells with FASN overexpression (FASN1 and FASN2) and vector-transfected control (Vec) cells were treated with 1 μM doxorubicin (DOX) or DMSO vehicle control for 48 h followed by analysis of apoptosis using DNA fragmentation ELISA (A), Western blot analysis of cleaved PARP (B), and activated caspase 8 (C8) (C). D: Western blot analysis of cleaved PARP and activated caspase 8 following a 48 h doxorubicin (0.2 µM) or DMSO treatment of MDA-MB-468 cell line transfected with FASN siRNA (Si) or scrambled (Scr) control siRNAs. Enrichment factor = ratio of DNA fragmentation of cells treated with doxorubicin/DNA fragmentation of cells treated without doxorubicin. GADPH or actin was used as a loading control for Western blot analysis. *P < 0.05.
We next determined whether FASN affects drug-induced activation of caspases 8 or 9 using Western blot analysis. As shown in Fig. 2C, caspase 8 in the Vec control cells is activated following doxorubicin treatment, whereas this activation in FASN1 and FASN2 clones is inhibited. Caspase 9, on the other hand, failed to be activated by doxorubicin treatment in the cells tested, and there is no difference in caspase 9 activation between the Vec control cells and the FASN1 and FASN2 cells (data not shown). Thus, FASN may protect cells from drug-induced apoptosis by suppressing drug-induced caspase 8 activation.
To determine whether the above observation is cell-line specific and whether knocking down FASN in a parental cell line would have the opposite effect on apoptosis and caspase 8 activation, we transiently knocked down FASN expression in human breast cancer cell line MDA-MB-468 as we previously described (14), followed by doxorubicin treatment and determination of PARP cleavage and caspase 8 activation. As shown in Fig. 2D, FASN knockdown sensitized/enhanced the parental MDA-MB-468 cells to doxorubicin-induced apoptosis and caspase 8 activation. This observation is consistent with our previous finding that FASN knockdown in MDA-MB-468 cells causes sensitization to anticancer drugs (14). Thus, the effect of FASN on drug-induced apoptosis and caspase 8 activation is not cell-line specific and confirms the role of FASN in suppressing drug-induced caspase 8 activation.
FASN overexpression has no effect on c-FLIP level and AKT activation
Because c-FLIP is a well-known inhibitor of caspase 8 activation and its degradation following drug treatment releases caspase 8 for activation (23, 24), we next determined whether FASN overexpression affects drug-induced degradation of c-FLIP using Western blot analysis. As shown in supplementary Fig. I-A, both c-FLIPL and c-FLIPS appeared to be at similar level between the Vec control cells and stable clones with FASN overexpression (FASN1 and FASN2). Following doxorubicin treatment, both c-FLIPL and c-FLIPS are completely degraded in all three cell lines and FASN overexpression does not inhibit drug-induced c-FLIP degradation. Thus, c-FLIP unlikely mediates FASN inhibition of drug-induced caspase 8 activation.
FASN has been shown to have a positive feedback relationship with AKT in multiple studies (for a review, see Ref. 1), and AKT is an important regulator of cell survival and apoptosis (for a review, see Ref. 25). It has also been shown that doxorubicin increases PI3K-dependent AKT phosphorylation/activation as early as 1 h with a peak at 24 h (26). Consequently, we tested whether FASN overexpression affects doxorubicin-induced AKT activation and phosphorylation at 24 h following doxorubicin treatment using Western blot analysis. Supplementary Fig. I-B shows that the basal level of phosphorylated AKT is not detectable in all three (Vec, FASN1, and FASN2) cell lines. Following a 24 h doxorubicin treatment, the level of phosphorylated AKT increased dramatically in all three cell lines. However, the level of phosphorylated AKT in FASN1 and FASN2 cells is not different from that in the Vec control cells. Thus, FASN overexpression in MCF7 cells does not appear to affect doxorubicin-induced AKT activation. Although AKT has been mainly involved in preventing apoptosis, it is also known to activate c-FLIP (27, 28). Together with the data shown in supplementary Fig. I-A, we conclude that FASN does not have an effect on the AKT→cFLP→caspase 8 signaling pathway in MCF7 cells.
FASN overexpression decreases doxorubicin-induced ceramide generation via neutral sphingomyelinase
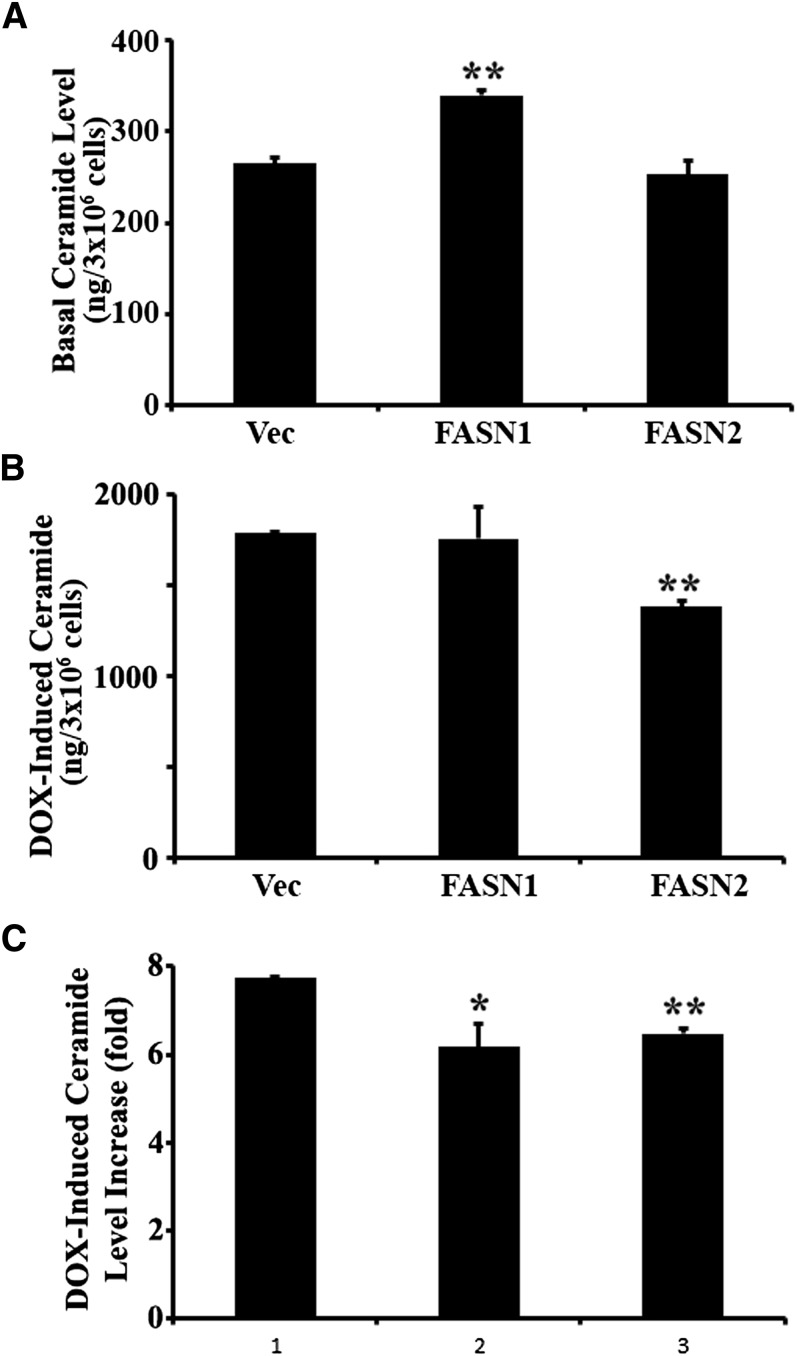
Another known upstream mediator of drug-induced caspase 8 activation is ceramide (29). In addition, the metabolism of different classes of lipids is highly intertwined. Thus, we tested the potential effects of FASN on ceramide production. As shown in Fig. 3, the basal total ceramide level in FASN1 and FASN2 stable clones is slightly higher than in the Vec control cells (Fig. 3A), and doxorubicin treatment dramatically induced ceramide level in all cell lines (Fig. 3B). However, the doxorubicin-induced increase in total ceramide production is compromised in the FASN stable clone (more significantly in FASN2 clone) compared with that in the Vec control cells (Fig. 3B, C). The basal and doxorubicin-induced production of individual ceramide is shown in supplementary Fig. II. It is clear that the C16:0 ceramide is the major constituent of the total ceramide and that doxorubicin-induced C16:0 ceramide production is compromised in both FASN1 and FASN2 cells compared with the Vec control cells. Doxorubicin-induced production of other ceramides, such as C18:1 and C24:0, also appears to be reduced in FASN-overexpression cells. It is noteworthy that FASN1 cells may be more tolerant than FASN2 cells to ceramide because its basal level of ceramide is significantly higher. Although doxorubicin-induced absolute level of total ceramide is not significantly lower in the FASN1 clone, the fold increase in doxorubicin-induced ceramide production is significantly less in FASN1, similar to FASN2, than in the Vec control cells. The individual ceramides also have the similar trend of decrease.
Fig. 3.
Effect of FASN overexpression on basal and doxorubicin-induced ceramide generation. A, B: Basal and doxorubicin-induced level of total ceramide. Basal and doxorubicin-induced levels of total ceramide in stable MCF7 cells with FASN overexpression (FASN1 and FASN2) and vector-transfected control (Vec) cells were determined using mass spectrometry as described in Materials and Methods. C: Doxorubicin-induced ceramide increase. Total ceramides were determined in stable MCF7 cells with FASN overexpression (FASN1 and FASN2) and vector-transfected control cells (Vec) following treatment with 1 µM doxorubicin for 48 h. DOX-induced ceramide level increase (fold) = total ceramide in cells treated with doxorubicin/total ceramide in cells treated without doxorubicin. Representative data of three independent experiments are presented. *P < 0.05; **P < 0.01.
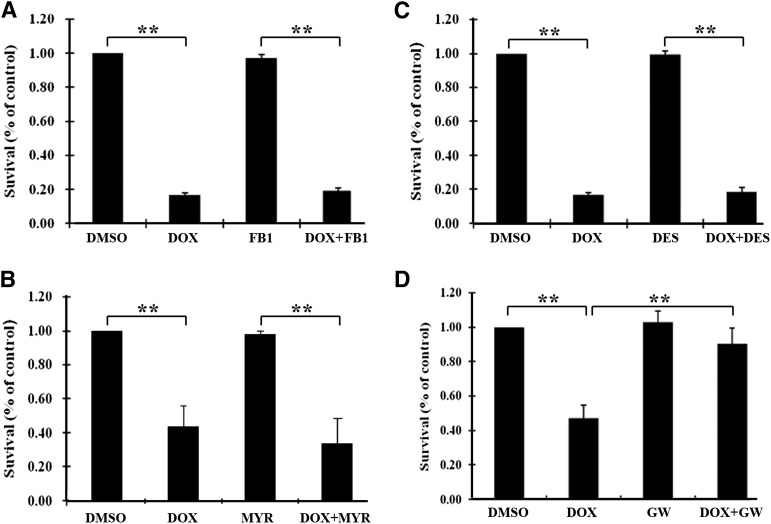
Ceramide can be generated either by de novo synthesis from palmitoyl CoA and serine or by breaking down sphingomyelin by acid or neutral sphingomyelinase (aSMase or nSMase). To determine which pathway is used in doxorubicin-induced ceramide generation and subsequent cell death in MCF7 cells, several selective inhibitors were used in combination with doxorubicin for survival assay. As shown in Fig. 4, fumonisin B1 and myriosin (inhibitors of de novo ceramide synthesis; Fig. 4A, B) and desipramine (aSMase inhibitor; Fig. 4C) had no effect on doxorubicin inhibition of cell survival. However, GW4869, an nSMase inhibitor that can effectively inhibit doxorubicin-induced ceramide production in MCF7 cells (supplementary Fig. III), blocked the inhibitory effect of doxorubicin on cell survival (Fig. 4D). Because nSMase-2 is the major nSMase in MCF7 cells (17, 18) and it is known to be activated by dunarubicin (an analog of doxorubicin) (30), we next tested whether knocking down nSMase-2 expression using siRNA could block the inhibitory effect of doxorubicin on cell survival. As shown in supplementary Fig. IV, knocking down nSMase-2 expression significantly attenuated the doxorubicin effect on MCF7 cell survival. Thus, the nSMase→ceramide→caspase 8→apoptosis pathway may contribute to doxorubicin-induced apoptosis of MCF7 cells, and this pathway may be inhibited by FASN overexpression.
Fig. 4.
Role of different ceramide generation pathways in doxorubicin-induced inhibition of cell survival. MCF7 cells were pretreated with or without fumonisin B1 (FB1) (A), myriosin (MYR) (B), desipramine (DES) (C), or GW4869 (GW) (D) for 1 h followed by treatment with 1 µM doxorubicin (DOX) or DMSO vehicle control for 48 h and SRB assay for survival as described in Materials and Methods. **P < 0.01.
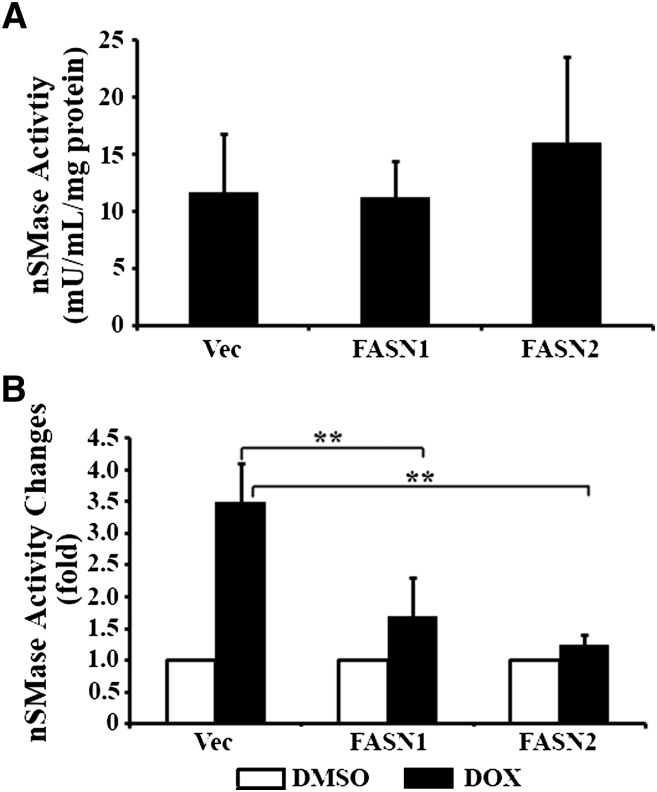
To test this possibility, we compared the nSMase activity among FASN1, FASN2, and the Vec control cells. Fig. 5A shows that the basal nSMase activity had no significant difference among all three cell lines. Upon doxorubicin treatment, the nSMase activity in the Vec control cells is dramatically increased (Fig. 5B). However, the doxorubicin-induced increase in nSMase activity is significantly suppressed by FASN overexpression in the FASN1 and FASN2 cells. Thus, nSMase may be a major target and mediator of FASN in doxorubicin resistance.
Fig. 5.
Role of FASN overexpression in doxorubicin-induced nSMase activation. A: Basal nSMase activity. The basal nSMase activity of stable MCF7 cells with FASN overexpression (FASN1 and FASN2) and vector-transfected control (Vec) cells were determined as described in Materials and Methods. B: Drug-induced nSMase activity. Stable MCF7 cells with FASN overexpression (FASN1 and FASN2) and vector-transfected control cells (Vec) were treated with 1 µM doxorubicin (DOX) or DMSO vehicle control for 48 h followed by determination of nSMase activity as described in Materials and Methods. **P < 0.01.
TNF-α expression is suppressed by FASN overexpression
To elucidate the signaling pathways further, a nonbiased comparative real-time RT-PCR SuperArray analysis of FASN1, FASN2, and the Vec control cells was conducted. Of the 89 genes analyzed, we found only 2 genes [interleukin (IL)-8 and TNF-α] that had greater than 1.5-fold change consistently in duplicated experiments between the Vec control and the FASN-overexpressing FASN1 and FASN2 cells (see supplementary Tables I and II). This array-based finding was verified in another independent FASN-overexpressing clone in duplicated experiments (supplementary Table III). The average reduction in IL-8 and TNF-α expression in all three stable clones with FASN overexpression was about 16- and 13-fold, respectively.
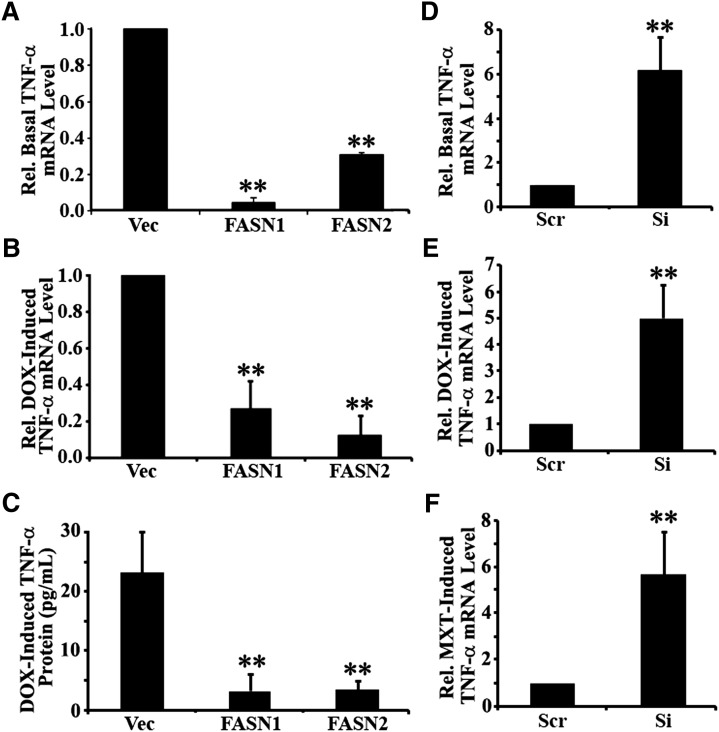
To verify the above findings, we performed a real-time RT-PCR analysis of TNF-α expression in the control Vec and FASN-overexpressing FASN1 and FASN2 cells. As shown in Fig. 6A, B, both the basal and doxorubicin-induced TNF-α mRNA levels are significantly reduced in FASN1 and FASN2 cells compared with the Vec control cells. To determine whether the production of TNF-α protein is also inhibited, we performed an ELISA assay. As shown in Fig. 6C, doxorubicin-induced production of TNF-α protein was significantly reduced in the FASN1 and FASN2 cells compared with the Vec control cells. We next performed analysis of TNF-α expression using the stable FASN knockdown MCF7/AdVp3000 cells (14), and we found that FASN knockdown drastically increased both basal and doxorubicin-induced TNF-α expression (Fig. 6D, E), consistent with the findings of FASN-overexpression cells. We also tested a different drug, mitoxantrone, in inducing TNF-α production and found that FASN knockdown similarly inhibited mitoxantrone-induced TNF-α expression (Fig. 6F).
Fig. 6.
Effect of FASN on TNF-α expression. A, D: Effect of FASN on basal TNF-α expression. Endogenous TNF-α mRNA was determined using real-time RT-PCR assay of total RNA from stable MCF7 cells with FASN overexpression (FASN1 and FASN2) and vector-transfected control (Vec) cells (A) and stable MCF7/AdVp3000 cells with FASN knockdown (Si) or cells transfected with scrambled control shRNA (Scr) (D). B, C, E, F: Effect of FASN on drug induced TNF-α expression. TNF-α mRNA and protein were determined using real-time RT-PCR (B, E, F) and ELISA (C) assays in stable MCF7 cells with FASN overexpression (FASN1 and FASN2) and vector-transfected control (Vec) cells following treatment with 1 µM doxorubicin (B, C) and in stable MCF7/AdVp3000 cells with FASN knockdown (Si) or transfected with scrambled control shRNA (Scr) following treatment with 1 µM doxorubicin (E) or 10 µM mitoxantrone (F) in the presence of 10 µM FTC. DOX-induced TNF-α protein increase represents the net increase of TNF-α protein following doxorubicin treatment over that of the untreated control cells. **P < 0.01.
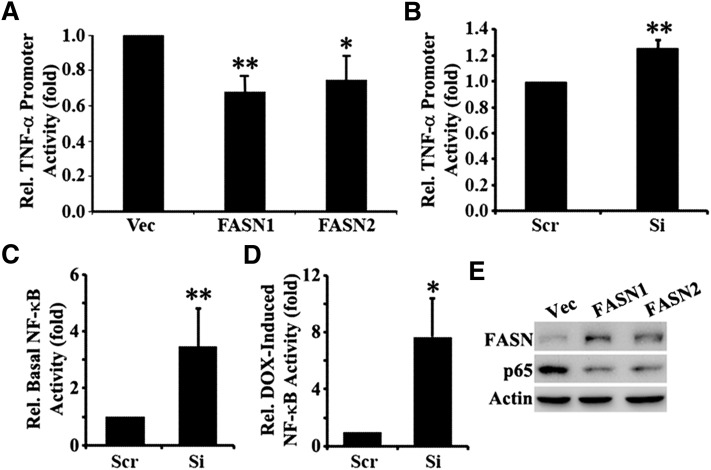
To determine whether the effect of FASN on TNF-α expression is possibly via inhibiting its transcription, FASN-overexpressing MCF7 cells and FASN-knockdown MCF7/AdVp3000 cells along with their vector or scrambled shRNA-harboring control cells were transfected with a firefly luciferase reporter construct driven by TNF-α promoter. A renilla luciferase reporter construct driven by thymidine kinase promoter was cotransfected into these cells as controls for transfection efficiency. As shown in Fig. 7A, both FASN1 and FASN2 cells show significantly lower relative TNF-α promoter activity than do the Vec control cells. MCF7/AdVp3000 cells with FASN knockdown (Si) have significantly higher relative TNF-α promoter activity than the control cells (Scr) (Fig. 7B).
Fig. 7.
Effect of FASN on TNF-α promoter and NF-κB activities. A–D: Stable MCF7 cells with FASN overexpression (FASN1 and FASN2) and vector-transfected control (Vec) cells (A) and stable MCF7/AdVp3000 cells with FASN knockdown (Si) or transfected with scrambled control shRNA (Scr) (B–D) were transiently transfected with a firefly luciferase reporter construct driven by TNF-α promoter (A, B) or by a luciferase reporter construct containing a NF-κB response element (C, D) followed by treatment without or with 1 µM doxorubicin (and in the presence of 10 µM FTC for MCF7/AdVp3000 cells) for 24 h and dual luciferase reporter assay as described in Materials and Methods. *P < 0.05; **P < 0.01. E: Western blot analysis of NF-κB p65 in FASN overexpression (FASN1 and FASN2) and vector-transfected control (Vec) cells. Actin is used as a loading control.
Because TNF-α is a known upstream regulator of and activates NF-κB, we hypothesize that the effect of FASN on TNF-α expression likely will consequently affect NF-κB activity. To test this possibility, we performed a reporter assay of NF-κB activity in MCF7/AdVp3000 cells with stable FASN knockdown and its scramble shRNA transfected control cell by transiently transfecting luciferase reporter construct driven by a promoter containing NF-κB response element followed by treatment with or without doxorubicin and determination of luciferase expression. As shown in Fig. 7C, D, both the basal and doxorubicin-induced NF-κB activity are dramatically increased in the cells with FASN knockdown compared with the control cells. Furthermore, we found that the expression level of NF-κB in the FASN overexpression cell lines is dramatically reduced compared with that of the Vec control cells (Fig. 7E). These observations are consistent with the negative relationship between FASN expression and TNF-α expression. Together, these findings suggest that FASN may downregulate the transcription and production of TNF-α, which in turn downregulates NF-κB level and activity and suppresses doxorubicin-induced ceramide production and apoptosis.
DISCUSSION
Altered and increased metabolism is one of the hallmarks of cancer (31). Despite the fact that the use of anticancer agents in appropriate combinations has led to major improvements in the treatment of malignant tumors, resistance to chemotherapy frequently occurs and is a major obstacle in cancer treatment. Hence, understanding metabolic-related drug resistance becomes critical. In this study, we show that FASN overexpression in breast cancer cell line MCF7 causes resistance to DNA damage-induced cell death possibly via inhibition of TNF-α production, which in turn increases NF-κB activity and reduces drug-induced production of ceramide possibly by nSMase and caspase 8-mediated apoptosis.
Previously, FASN overexpression was found in Adriamycin (doxorubicin)-selected and multidrug-resistant MCF7 cells, and it contributes to the observed drug resistance of these cells (14). It was also found that FASN overexpression contributes to gemcitabine resistance in pancreatic cancer cells (15). Interestingly, we did not find that FASN overexpression in MCF7 cells causes resistance to non-DNA-damaging drugs, such as paclitaxel and vinblastine. This finding is contradictory to the observations by Menendez et al. (32) who found that inhibiting FASN activity enhanced the cytotoxicity of docetaxel in the Her2-overexpressing breast cancer cell lines. The same group has also reported that inhibiting FASN expression or activity could sensitize breast cancer cells with a high Her2 level to vinorelbine (33) and paclitaxel (34). The reason for this discrepancy is currently unknown; however, it is possible that the high level of Her2 may affect the role of FASN in cellular response to docetaxel.
Although the detailed mechanism is not yet known, FASN has been shown to play a role in regulating gene expression. A previous genomic profiling analysis of a breast cancer cell line MDA-MB-435 showed that FASN knockdown upregulated the expression of IL-8 (35), consistent with our finding in this study. Because IL-8 is one of the downstream target genes of TNF-α signaling via NF-κB (36), the observed reduction of IL-8 in FASN-overexpressing clones may be the result of TNF-α reduction. Indeed, we also found that NF-κB activity in FASN knockdown cells is significantly upregulated, and its expression in FASN-overexpression cells is downregulated. Thus, the TNF-α signaling pathway may be inversely regulated by FASN, and it may mediate FASN-induced drug resistance.
It is noteworthy that the effect of FASN on TNF-α promoter activity (Fig. 7) is lesser compared with the effect on the expression of endogenous TNF-α (Fig. 6). The reason for this difference is currently unknown. However, it is likely that transfection efficiency of the reporter construct contributed to the lower effect of FASN on the promoter activity assay. It is also possible that the TNF-α promoter in the reporter construct does not constitute the proper structure as does the endogenous promoter for a more efficient effect. Further, it cannot be ruled out that the endogenous TNF-α mRNA is less stable in FASN-overexpression cells, whereas the stability of reporter mRNA is not affected by FASN expression. All these possibilities may contribute to the lower effect of FASN on the reporter assay than on the endogenous TNF-α, and further investigations are needed to delineate the detailed mechanism of FASN effect on TNF-α expression.
GW4869, among several other inhibitors, was found to be the only inhibitor that improved survival against doxorubicin treatment. GW4869 is a cell-permeable, noncompetitive, specific inhibitor of nSMase-2 (37), and it does not affect aSMase activity or other key TNF-mediated signaling effects, such as NF-κB activation (38), GW4869 has been shown repeatedly to suppress ceramide production. For example, GW4869 significantly inhibited TNF-α-induced ceramide production in MCF7 cells (38), significantly reduced the l-OHP-induced accumulation of ceramides in human colon cancer cell line HCT116 (39), and inhibited hypoxia-induced ceramide production in rat pulmonary artery smooth muscle cells (20). Furthermore, it has been shown that anthracycline drugs, such as doxorubicin, induce ceramide production in cancer cells by activating nSMase and that inhibiting nSMase attenuates doxorubicin-induced ceramide production (40). Thus, we conclude that the FASN function in drug resistance and in suppression of drug-induced ceramide production is likely mediated by nSMase. This conclusion is corroborated by our observation that specifically knocking down nSMase-2 significantly attenuates the doxorubicin effect on MCF7 cell survival and that inhibiting nSMase reduces doxorubicin-induced ceramide production.
It is noteworthy that FASN appears to inhibit doxorubicin-induced fold increase in ceramide level in two independent clones, although the absolute level of increase in one of the two clones is also significantly reduced by FASN overexpression (Fig. 3). Currently, it is not clear whether the inhibition in fold increase or absolute level of ceramide is the key to FASN function in doxorubicin resistance. Future studies will be needed to clarify this issue.
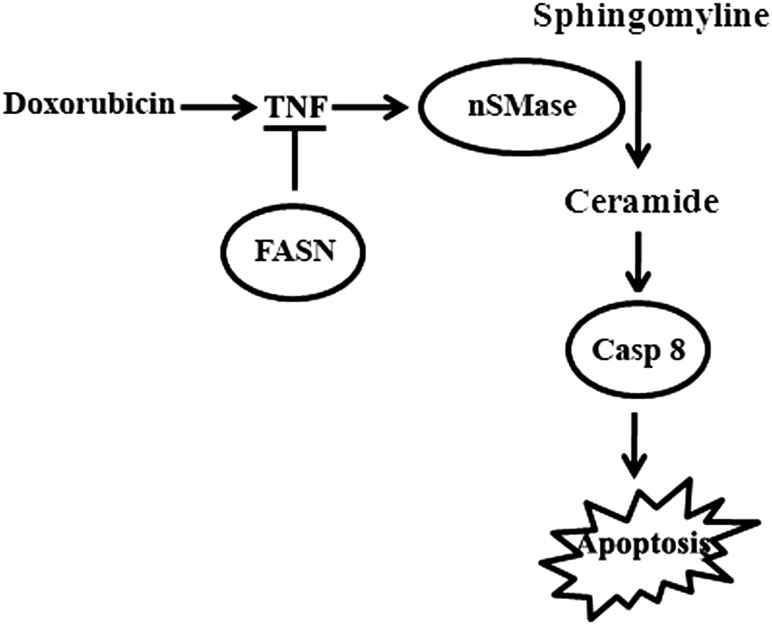
It has also been shown that TNF-α activates nSMase and initiates a rapid increase in ceramide production (37, 41–43) and that doxorubicin treatment increases TNF-α expression (44). Ceramide-induced apoptosis has also been shown to be mediated by caspase 8 (45). On the basis of our findings and previous observations, we propose that FASN overexpression suppresses production of TNF-α, which in turn reduces doxorubicin-induced production of ceramide possibly by reducing nSMase activity, resulting in lowered caspase 8 activation and apoptosis (Fig. 8). Because mitoxantrone, camptothecin, and etopside, similar to doxorubicin, are all topoisomerase II inhibitors, FASN may also use the same mechanism of resistance to these drugs as to doxorubicin (see Fig. 8). Indeed, we found that mitoxantrone-induced TNF-α expression is significantly increased by knocking down FASN expression. However, how FASN overexpression inhibits TNF-α production is currently unknown. Previously, it has been shown that supplementation of palimitate causes cellular resistance to doxorubicin and mitoxantrone (14). Thus, it is possible that palmitate, the final product of FASN, plays some role in inhibiting TNF-α production; this possibility is awaiting further investigation.
Fig. 8.
Mechanism of FASN action in drug resistance. FASN overexpression causes drug resistance possibly by inhibiting TNF-α production, which in turn inhibits drug-induced nSMase activation, production of ceramide from sphingomyelin, activation of caspase 8, and apoptosis.
It is also noteworthy that the anticancer drugs (doxorubicin, mitoxantrone, camptothecin, and etopside) that FASN causes resistance to are topoisomerase II inhibitors and that they as well as γ-irradiation induce double-strand DNA breaks. Cisplatin also causes DNA damage. Thus, it is tempting to speculate that FASN overexpression may protect MCF7 cells against DNA damage or facilitate the repair of damage. In support of this argument, it has been observed that FASN suppresses the expression of DNA damage-inducible transcript 4, a stress-response gene, which may also mediate the function of FASN in resistance to DNA-damaging treatments. We are currently investigating this possibility.
Supplementary Material
Acknowledgments
The authors thank Joleyn Khoo for her technical support in PCR analysis.
Footnotes
Abbreviations:
- FASN
- fatty acid synthase
- IL
- interleukin
- NF
- nuclear factor
- nSMase
- neutral SMase
- PARP
- poly(ADP-ribose) polymerase
- SRB
- sulforhodamine B
- TNF
- tumor necrosis factor
This work was supported in part by National Institutes of Health Grant CA-113384. Its contents are solely the responsibility of the authors and do not necessarily represent the official views of the National Institutes of Health. Hailan Liu and Xi Wu are recipients of US Department of Defense Predoctoral Fellowships W81XWH-06-1-0490 and W81XWH-10-1-0057.
The online version of this article (available at http://www.jlr.org) contains supplementary data in the form of eight figures.
REFERENCES
- 1.Liu H., Liu J. Y., Wu X., Zhang J. T. 2010. Biochemistry, molecular biology, and pharmacology of fatty acid synthase, an emerging therapeutic target and diagnosis/prognosis marker. Int. J. Biochem. Mol. Biol. 1: 69–89 [PMC free article] [PubMed] [Google Scholar]
- 2.Gao Y., Lin L. P., Zhu C. H., Chen Y., Hou Y. T., Ding J. 2006. Growth arrest induced by C75, a fatty acid synthase inhibitor, was partially modulated by p38 MAPK but not by p53 in human hepatocellular carcinoma. Cancer Biol. Ther. 5: 978–985 [DOI] [PubMed] [Google Scholar]
- 3.Knowles L. M., Axelrod F., Browne C. D., Smith J. W. 2004. A fatty acid synthase blockade induces tumor cell-cycle arrest by down-regulating Skp2. J. Biol. Chem. 279: 30540–30545 [DOI] [PubMed] [Google Scholar]
- 4.Li J. N., Gorospe M., Chrest F. J., Kumaravel T. S., Evans M. K., Han W. F., Pizer E. S. 2001. Pharmacological inhibition of fatty acid synthase activity produces both cytostatic and cytotoxic effects modulated by p53. Cancer Res. 61: 1493–1499 [PubMed] [Google Scholar]
- 5.Morikawa K., Ikeda C., Nonaka M., Suzuki I. 2007. Growth arrest and apoptosis induced by quercetin is not linked to adipogenic conversion of human preadipocytes. Metabolism. 56: 1656–1665 [DOI] [PubMed] [Google Scholar]
- 6.Vazquez-Martin A., Colomer R., Brunet J., Lupu R., Menendez J. A. 2008. Overexpression of fatty acid synthase gene activates HER1/HER2 tyrosine kinase receptors in human breast epithelial cells. Cell Prolif. 41: 59–85 [DOI] [PMC free article] [PubMed] [Google Scholar]
- 7.Migita T., Ruiz S., Fornari A., Fiorentino M., Priolo C., Zadra G., Inazuka F., Grisanzio C., Palescandolo E., Shin E., et al. 2009. Fatty acid synthase: a metabolic enzyme and candidate oncogene in prostate cancer. J. Natl. Cancer Inst. 101: 519–532 [DOI] [PMC free article] [PubMed] [Google Scholar]
- 8.Knowles L. M., Yang C., Osterman A., Smith J. W. 2008. Inhibition of fatty-acid synthase induces caspase-8-mediated tumor cell apoptosis by up-regulating DDIT4. J. Biol. Chem. 283: 31378–31384 [DOI] [PMC free article] [PubMed] [Google Scholar]
- 9.Kuhajda F. P., Piantadosi S., Pasternack G. R. 1989. Haptoglobin-related protein (Hpr) epitopes in breast cancer as a predictor of recurrence of the disease. N. Engl. J. Med. 321: 636–641 [DOI] [PubMed] [Google Scholar]
- 10.Kuhajda F. P., Jenner K., Wood F. D., Hennigar R. A., Jacobs L. B., Dick J. D., Pasternack G. R. 1994. Fatty acid synthesis: a potential selective target for antineoplastic therapy. Proc. Natl. Acad. Sci. USA. 91: 6379–6383 [DOI] [PMC free article] [PubMed] [Google Scholar]
- 11.Alò P. L., Visca P., Marci A., Mangoni A., Botti C., Di Tondo U. 1996. Expression of fatty acid synthase (FAS) as a predictor of recurrence in stage I breast carcinoma patients. Cancer. 77: 474–482 [DOI] [PubMed] [Google Scholar]
- 12.Alò P. L., Visca P., Trombetta G., Mangoni A., Lenti L., Monaco S., Botti C., Serpieri D. E., Di Tondo U. 1999. Fatty acid synthase (FAS) predictive strength in poorly differentiated early breast carcinomas. Tumori. 85: 35–40 [DOI] [PubMed] [Google Scholar]
- 13.Shurbaji M. S., Kalbfleisch J. H., Thurmond T. S. 1996. Immunohistochemical detection of a fatty acid synthase (OA-519) as a predictor of progression of prostate cancer. Hum. Pathol. 27: 917–921 [DOI] [PubMed] [Google Scholar]
- 14.Liu H., Liu Y., Zhang J. T. 2008. A new mechanism of drug resistance in breast cancer cells: fatty acid synthase overexpression-mediated palmitate overproduction. Mol. Cancer Ther. 7: 263–270 [DOI] [PubMed] [Google Scholar]
- 15.Yang Y., Liu H., Li Z., Zhao Z., Yip-Schneider M., Fan Q., Schmidt C. M., Chiorean E. G., Xie J., Cheng L., et al. 2011. Role of fatty acid synthase in gemcitabine and radiation resistance of pancreatic cancers. Int. J. Biochem. Mol. Biol. 2: 89–98 [PMC free article] [PubMed] [Google Scholar]
- 16.Dong Z., Liu Y., Zhang J. T. 2005. Regulation of ribonucleotide reductase M2 expression by the upstream AUGs. Nucleic Acids Res. 33: 2715–2725 [DOI] [PMC free article] [PubMed] [Google Scholar]
- 17.Wu B. X., Clarke C. J., Hannun Y. A. 2010. Mammalian neutral sphingomyelinases: regulation and roles in cell signaling responses. Neuromolecular Med. 12: 320–330 [DOI] [PMC free article] [PubMed] [Google Scholar]
- 18.Clarke C. J., Cloessner E. A., Roddy P. L., Hannun Y. A. 2011. Neutral sphingomyelinase 2 (nSMase2) is the primary neutral sphingomyelinase isoform activated by tumour necrosis factor-alpha in MCF-7 cells. Biochem. J. 435: 381–390 [DOI] [PMC free article] [PubMed] [Google Scholar]
- 19.Bligh E. G., Dyer W. J. 1959. A rapid method of total lipid extraction and purification. Can. J. Biochem. Physiol. 37: 911–917 [DOI] [PubMed] [Google Scholar]
- 20.Cogolludo A., Moreno L., Frazziano G., Moral-Sanz J., Menendez C., Castaneda J., Gonzalez C., Villamor E., Perez-Vizcaino F. 2009. Activation of neutral sphingomyelinase is involved in acute hypoxic pulmonary vasoconstriction. Cardiovasc. Res. 82: 296–302 [DOI] [PMC free article] [PubMed] [Google Scholar]
- 21.Lazebnik Y. A., Kaufmann S. H., Desnoyers S., Poirier G. G., Earnshaw W. C. 1994. Cleavage of poly(ADP-ribose) polymerase by a proteinase with properties like ICE. Nature. 371: 346–347 [DOI] [PubMed] [Google Scholar]
- 22.Han B., Xie H., Chen Q., Zhang J. T. 2006. Sensitizing hormone-refractory prostate cancer cells to drug treatment by targeting 14-3-3sigma. Mol. Cancer Ther. 5: 903–912 [DOI] [PubMed] [Google Scholar]
- 23.Kelly M. M., Hoel B. D., Voelkel-Johnson C. 2002. Doxorubicin pretreatment sensitizes prostate cancer cell lines to TRAIL induced apoptosis which correlates with the loss of c-FLIP expression. Cancer Biol. Ther. 1: 520–527 [DOI] [PubMed] [Google Scholar]
- 24.El-Zawahry A., McKillop J., Voelkel-Johnson C. 2005. Doxorubicin increases the effectiveness of Apo2L/TRAIL for tumor growth inhibition of prostate cancer xenografts. BMC Cancer. 5: 2. [DOI] [PMC free article] [PubMed] [Google Scholar]
- 25.Castaneda C. A., Cortes-Funes H., Gomez H. L., Ciruelos E. M. 2010. The phosphatidyl inositol 3-kinase/AKT signaling pathway in breast cancer. Cancer Metastasis Rev. 29: 751–759 [DOI] [PubMed] [Google Scholar]
- 26.Li X., Lu Y., Liang K., Liu B., Fan Z. 2005. Differential responses to doxorubicin-induced phosphorylation and activation of Akt in human breast cancer cells. Breast Cancer Res. 7: R589–R597 [DOI] [PMC free article] [PubMed] [Google Scholar]
- 27.Panner A., Crane C. A., Weng C., Feletti A., Parsa A. T., Pieper R. O. 2009. A novel PTEN-dependent link to ubiquitination controls FLIPS stability and TRAIL sensitivity in glioblastoma multiforme. Cancer Res. 69: 7911–7916 [DOI] [PMC free article] [PubMed] [Google Scholar]
- 28.Panner A., Crane C. A., Weng C., Feletti A., Fang S., Parsa A. T., Pieper R. O. 2010. Ubiquitin-specific protease 8 links the PTEN-Akt-AIP4 pathway to the control of FLIPS stability and TRAIL sensitivity in glioblastoma multiforme. Cancer Res. 70: 5046–5053 [DOI] [PMC free article] [PubMed] [Google Scholar]
- 29.Senchenkov A., Litvak D. A., Cabot M. C. 2001. Targeting ceramide metabolism--a strategy for overcoming drug resistance. J. Natl. Cancer Inst. 93: 347–357 [DOI] [PubMed] [Google Scholar]
- 30.Ito H., Murakami M., Furuhata A., Gao S., Yoshida K., Sobue S., Hagiwara K., Takagi A., Kojima T., Suzuki M., et al. 2009. Transcriptional regulation of neutral sphingomyelinase 2 gene expression of a human breast cancer cell line, MCF-7, induced by the anti-cancer drug, daunorubicin. Biochim. Biophys. Acta. 1789: 681–690 [DOI] [PubMed] [Google Scholar]
- 31.Hanahan D., Weinberg R. A. 2011. Hallmarks of cancer: the next generation. Cell. 144: 646–674 [DOI] [PubMed] [Google Scholar]
- 32.Menendez J. A., Lupu R., Colomer R. 2004. Inhibition of tumor-associated fatty acid synthase hyperactivity induces synergistic chemosensitization of HER-2/neu-overexpressing human breast cancer cells to docetaxel (taxotere). Breast Cancer Res. Treat. 84: 183–195 [DOI] [PubMed] [Google Scholar]
- 33.Menendez J. A., Colomer R., Lupu R. 2004. Inhibition of tumor-associated fatty acid synthase activity enhances vinorelbine (Navelbine)-induced cytotoxicity and apoptotic cell death in human breast cancer cells. Oncol. Rep. 12: 411–422 [PubMed] [Google Scholar]
- 34.Menendez J. A., Vellon L., Colomer R., Lupu R. 2005. Pharmacological and small interference RNA-mediated inhibition of breast cancer-associated fatty acid synthase (oncogenic antigen-519) synergistically enhances Taxol (paclitaxel)-induced cytotoxicity. Int. J. Cancer. 115: 19–35 [DOI] [PubMed] [Google Scholar]
- 35.Knowles L. M., Smith J. W. 2007. Genome-wide changes accompanying knockdown of fatty acid synthase in breast cancer. BMC Genomics. 8: 168. [DOI] [PMC free article] [PubMed] [Google Scholar]
- 36.Hoffmann E., Dittrich-Breiholz O., Holtmann H., Kracht M. 2002. Multiple control of interleukin-8 gene expression. J. Leukoc. Biol. 72: 847–855 [PubMed] [Google Scholar]
- 37.Marchesini N., Luberto C., Hannun Y. A. 2003. Biochemical properties of mammalian neutral sphingomyelinase2 and its role in sphingolipid metabolism. J. Biol. Chem. 278: 13775–13783 [DOI] [PubMed] [Google Scholar]
- 38.Luberto C., Hassler D. F., Signorelli P., Okamoto Y., Sawai H., Boros E., Hazen-Martin D. J., Obeid L. M., Hannun Y. A., Smith G. K. 2002. Inhibition of tumor necrosis factor-induced cell death in MCF7 by a novel inhibitor of neutral sphingomyelinase. J. Biol. Chem. 277: 41128–41139 [DOI] [PubMed] [Google Scholar]
- 39.Nemoto S., Nakamura M., Osawa Y., Kono S., Itoh Y., Okano Y., Murate T., Hara A., Ueda H., Nozawa Y., et al. 2009. Sphingosine kinase isoforms regulate oxaliplatin sensitivity of human colon cancer cells through ceramide accumulation and Akt activation. J. Biol. Chem. 284: 10422–10432 [DOI] [PMC free article] [PubMed] [Google Scholar]
- 40.Jaffrézou J. P., Levade T., Bettaieb A., Andrieu N., Bezombes C., Maestre N., Vermeersch S., Rousse A., Laurent G. 1996. Daunorubicin-induced apoptosis: triggering of ceramide generation through sphingomyelin hydrolysis. EMBO J. 15: 2417–2424 [PMC free article] [PubMed] [Google Scholar]
- 41.Clarke C. J., Truong T. G., Hannun Y. A. 2007. Role for neutral sphingomyelinase-2 in tumor necrosis factor alpha-stimulated expression of vascular cell adhesion molecule-1 (VCAM) and intercellular adhesion molecule-1 (ICAM) in lung epithelial cells: p38 MAPK is an upstream regulator of nSMase2. J. Biol. Chem. 282: 1384–1396 [DOI] [PubMed] [Google Scholar]
- 42.De Palma C., Meacci E., Perrotta C., Bruni P., Clementi E. 2006. Endothelial nitric oxide synthase activation by tumor necrosis factor alpha through neutral sphingomyelinase 2, sphingosine kinase 1, and sphingosine 1 phosphate receptors: a novel pathway relevant to the pathophysiology of endothelium. Arterioscler. Thromb. Vasc. Biol. 26: 99–105 [DOI] [PubMed] [Google Scholar]
- 43.Wheeler D., Knapp E., Bandaru V. V., Wang Y., Knorr D., Poirier C., Mattson M. P., Geiger J. D., Haughey N. J. 2009. Tumor necrosis factor-alpha-induced neutral sphingomyelinase-2 modulates synaptic plasticity by controlling the membrane insertion of NMDA receptors. J. Neurochem. 109: 1237–1249 [DOI] [PMC free article] [PubMed] [Google Scholar]
- 44.Tangpong J., Cole M. P., Sultana R., Joshi G., Estus S., Vore M., St Clair W., Ratanachaiyavong S., St Clair D. K., Butterfield D. A. 2006. Adriamycin-induced, TNF-alpha-mediated central nervous system toxicity. Neurobiol. Dis. 23: 127–139 [DOI] [PubMed] [Google Scholar]
- 45.Lin C. F., Chen C. L., Chang W. T., Jan M. S., Hsu L. J., Wu R. H., Tang M. J., Chang W. C., Lin Y. S. 2004. Sequential caspase-2 and caspase-8 activation upstream of mitochondria during ceramideand etoposide-induced apoptosis. J. Biol. Chem. 279: 40755–40761 [DOI] [PubMed] [Google Scholar]
Associated Data
This section collects any data citations, data availability statements, or supplementary materials included in this article.


