Abstract
Purpose: Efficient optimization of CT protocols demands a quantitative approach to predicting human observer performance on specific tasks at various scan and reconstruction settings. The goal of this work was to investigate how well a channelized Hotelling observer (CHO) can predict human observer performance on 2-alternative forced choice (2AFC) lesion-detection tasks at various dose levels and two different reconstruction algorithms: a filtered-backprojection (FBP) and an iterative reconstruction (IR) method.
Methods: A 35 × 26 cm2 torso-shaped phantom filled with water was used to simulate an average-sized patient. Three rods with different diameters (small: 3 mm; medium: 5 mm; large: 9 mm) were placed in the center region of the phantom to simulate small, medium, and large lesions. The contrast relative to background was −15 HU at 120 kV. The phantom was scanned 100 times using automatic exposure control each at 60, 120, 240, 360, and 480 quality reference mAs on a 128-slice scanner. After removing the three rods, the water phantom was again scanned 100 times to provide signal-absent background images at the exact same locations. By extracting regions of interest around the three rods and on the signal-absent images, the authors generated 21 2AFC studies. Each 2AFC study had 100 trials, with each trial consisting of a signal-present image and a signal-absent image side-by-side in randomized order. In total, 2100 trials were presented to both the model and human observers. Four medical physicists acted as human observers. For the model observer, the authors used a CHO with Gabor channels, which involves six channel passbands, five orientations, and two phases, leading to a total of 60 channels. The performance predicted by the CHO was compared with that obtained by four medical physicists at each 2AFC study.
Results: The human and model observers were highly correlated at each dose level for each lesion size for both FBP and IR. The Pearson's product-moment correlation coefficients were 0.986 [95% confidence interval (CI): 0.958–0.996] for FBP and 0.985 (95% CI: 0.863–0.998) for IR. Bland-Altman plots showed excellent agreement for all dose levels and lesions sizes with a mean absolute difference of 1.0% ± 1.1% for FBP and 2.1% ± 3.3% for IR.
Conclusions: Human observer performance on a 2AFC lesion detection task in CT with a uniform background can be accurately predicted by a CHO model observer at different radiation dose levels and for both FBP and IR methods.
Keywords: computed tomography (CT), model observer, image quality, radiation dose, iterative reconstruction (IR)
INTRODUCTION
The improved speed and resolution of CT, and the associated benefits to patient care, have led to an exponential growth in the number of CT exams performed annually.1 The drastically increased use of CT has generated concerns regarding potential cancer risks associated with the radiation exposure from CT.2 Optimizing CT protocols to achieve adequate diagnostic capability with the lowest reasonable dose has, therefore, become an important task.3, 4 Clinical evaluation by interpreting physicians is the most commonly used approach for determining the lowest possible radiation dose in CT protocols.5, 6, 7 However, this approach is very laborious, produces results that cannot be readily generalized to other scanner models and reconstruction algorithms, and can lead to unreliable results if the study is not carefully designed and performed. A more efficient and quantitative method is, therefore, essential for the CT community to meet the ever-growing need for radiation dose and protocol optimization in CT.
The key to a quantitative method for dose optimization is to determine image quality metrics that can be accurately measured in phantoms and that are highly correlated with interpreting physicians’ performance for a specific diagnostic task. Currently, many physical metrics, including modulation transfer function (MTF), section-sensitivity profile (SSP), noise level, and noise power spectrum (NPS) are used to quantify or monitor various aspects of CT image quality.8, 9, 10, 11 However, these metrics are not complete descriptors of image quality and do not directly reflect the diagnostic performance for a given task, which is the ultimate measure of image quality. Improving quality according to each of these metrics will not necessarily increase diagnostic accuracy. More importantly, with iterative reconstruction (IR), traditional simple physical metrics have even greater difficulty in characterizing image quality. For example, MTF is not an ideal metric for quantifying spatial resolution after IR: Due to the nonlinearity of the regularization process in most IR methods, the spatial resolution varies with the object contrast.12 Traditional MTF measurement with high-contrast wires would deliver incorrect information about the resolution in low-contrast situations.
Task-based image quality metrics using model observers have been studied extensively over the past three decades.13, 14 Model observers can be classified as ideal observers or anthropomorphic observers.14 An ideal (Bayesian) observer is the optimal decision maker that makes full use of all the information available. The performance of an ideal observer, quantified by a figure of merit (FOM), provides the upper bound that is achievable by any observer. Although useful for evaluating the performance efficiency of human observers, ideal observers are usually mathematically intractable due to the lack of full data statistics14 and are not good predictors of human observers.15 Various anthropomorphic model observers have been developed to predict the performance of human observers. A Hotelling observer (HO) constrained by frequency-selective channels, referred to as a channelized Hotelling observer (CHO), was suggested as a useful anthropomorphic model observer for several detection tasks,14 including those with band-pass noise16 and lumpy background.17 Choices of channel filters include square channels,15, 18 difference of Gaussians,19 Laguerre-Gauss polynomials,20, 21, 22, 23, 24 and Gabor channels.20 A nonprewhitening matched filter (NPW), initially proposed by Wagner25 and modified to include a human visual transfer function,26 was also found to be highly correlated with human performance. More realistic tasks involving location uncertainty and background and signal variability have also been investigated.24, 27, 28, 29, 30, 31, 32, 33 These model observers, including various versions of CHO and NPW, have been applied to many different imaging modalities to assess or optimize image quality, including nuclear medicine imaging,34, 35, 36 mammography,23, 37, 38, 39 x-ray dual-energy radiographic imaging,40 tomosynthesis and flat-panel cone-beam CT,32, 41, 42, 43 and MRI.44
Task-based image quality metrics using model observers have also been used in clinical CT.45, 46, 47, 48 With the increasing applications of IR in clinical CT to improve image quality and reduce radiation dose, there is a strong interest and need to use model observers to objectively and efficiently optimize CT scanning protocols.49 However, before a model observer can be applied to clinical CT as an image quality metric to optimize radiation dose and parameter settings of various reconstruction algorithms, it is important to quantify how well the performance of the model observer is correlated with human observers in realistic CT scans. Once a set of model observers is determined to be highly correlated with or be able to predict the human observer performance, they can be used clinically to efficiently and accurately optimize scanning protocols and radiation dose levels in CT. To the best of our knowledge, there has been no such study performed in realistic CT scans without invoking any computer simulation. Furthermore, image-based model observers are required to overcome the difficulty of frequency-based methods in iterative reconstructions.
The purpose of this work was to investigate how well a CHO could predict human observer performance on 2-alternative forced choice (2AFC) lesion-detection tasks at various radiation dose levels and for both a filtered-backprojection (FBP) reconstruction method and an iterative reconstruction method.
METHODS AND MATERIALS
Data acquisition and image reconstruction
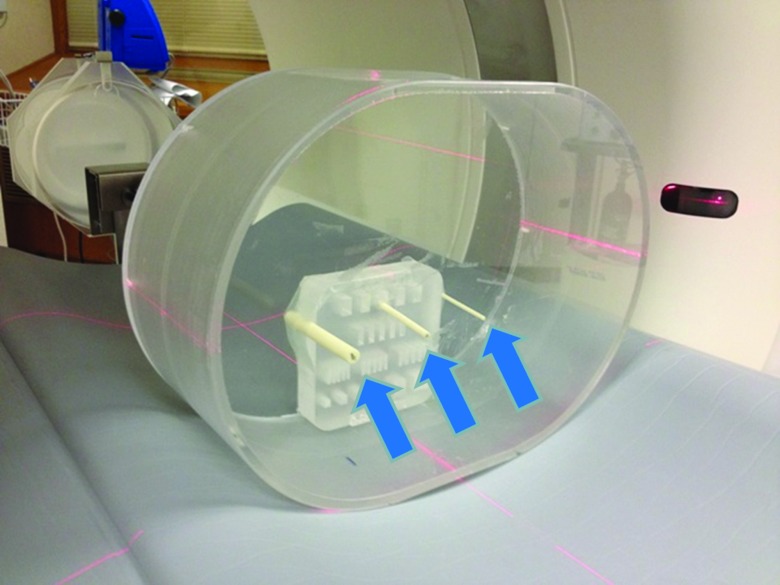
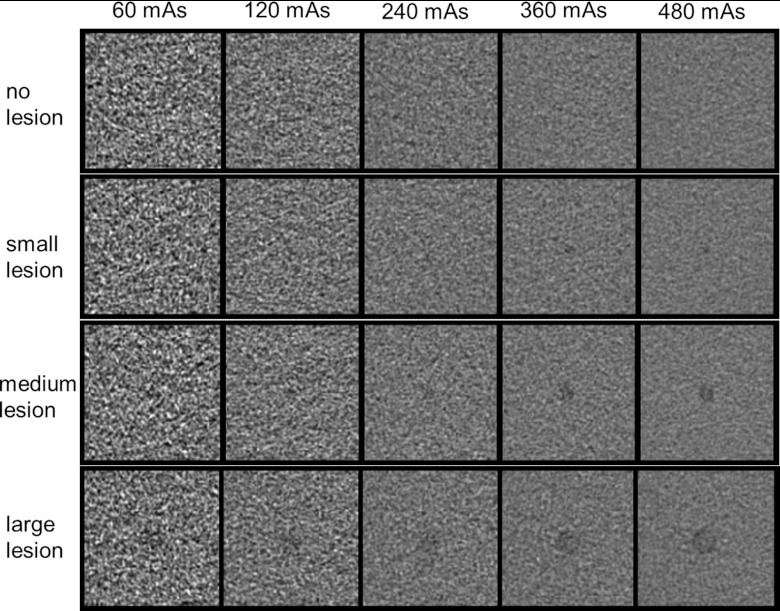
We investigated the use of a model observer to predict human observer performance in a 2AFC task with signal known exactly (SKE). A 35 × 26 cm2 torso-shaped phantom filled with water was used to simulate the abdomen of an average-sized patient (Fig. 1). Three rods with different diameters (small: 3 mm; medium: 5 mm; large: 9 mm) were placed in the center region of the water tank with a distance of 6 cm between small and medium rods and between medium and large rods. The rods were made of epoxy resin materials and provided by Siemens. The CT number of the three rods was −9 HU at 120 kV. We added a small amount of iodine contrast material into the water to increase the contrast between the rods and water background to be −15 HU. The phantom was scanned 100 times each at 60, 120, 240, 360, and 480 quality reference mAs on a 128-slice scanner (Definition Flash, Siemens Healthcare). “Quality reference mAs” is the image quality index used in the automatic exposure control (AEC) software (CAREDose4D, Siemens Healthcare). The value of quality reference mAs represents the effective mAs (mAs/pitch) that would be used for a reference attenuation level. With the increase/decrease of the attenuation level of the patient, the actual effective mAs increases/decreases. The rotation time was 0.5 s. The helical pitch was 0.6. The corresponding scanner radiation outputs, expressed as CTDIvol, were 2.8, 5.7, 11.4, 17.1, and 22.8 mGy. After removing the three rods, the water phantom was again scanned 100 times to provide signal-absent background images at the same locations. The detector acquisition mode was 128 × 0.6 mm2, which corresponds to a physical collimation of 64 × 0.6 mm2 and use of a z-flying focal spot technique that allowed for double sampling along the z-direction.50 Images were reconstructed using the traditional 3D weighted filtered backprojection algorithm available on the scanner (B40 kernel) with an image thickness of 5 mm and an interval of 5 mm.51, 52 The corresponding in-plane high-contrast spatial resolution is 3.97 cm−1 at 50% and 8.13 cm−1 at 2% values of the MTF curve. The reconstruction field of view (FOV) is 25 × 25 cm2. A collage of example images with no, small, medium, and large lesions at different mAs settings is displayed in Fig. 2. From the same 100 scans acquired at the two lower mAs levels, 60 and 120 mAs, images were also reconstructed with an IR algorithm available on the scanner (SAFIRE - Sinogram AFfirmed Iterative Reconstruction (Software version: VA40), Siemens Heathcare). Meanwhile a newer version of the investigated IR reconstruction is commercially available. The IR kernel was I40 with a strength setting of 3.
Figure 1.
Phantom setup. A 35 × 26 cm2 torso-shaped phantom filled with water was used to simulate the abdomen of an average-sized patient. Three rods with different diameters (small: 3 mm; medium: 5 mm; large: 9 mm) were placed in the center region of the water tank (arrows). The acrylic resolution target was used only to hold the rods in position and was not included in the evaluated images.
Figure 2.
A collage of images with no, small (3 mm), medium (5 mm), or large (9 mm) lesions at different mAs settings. The display window level and width are 40 and 300 HU, respectively.
Creation of 2AFC tasks
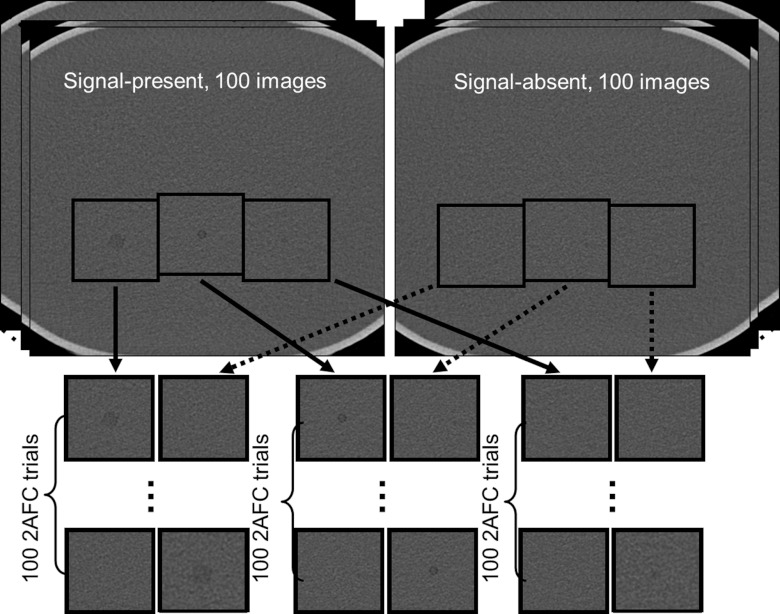
By extracting regions of interest (ROI) (128 × 128 pixels with an FOV size of 6.2 × 6.2 cm2) around the three rods and on the signal-absent images, we generated 21 2AFC studies, including 15 studies for FBP reconstructed images (five mAs settings × three lesion sizes) and 6 studies for IR reconstructed images (two mAs settings × three lesion sizes). The two mAs settings (60 and 120 mAs) for IR were intentionally selected to be the two lower mAs settings to demonstrate whether the IR could improve the performance of the 2AFC task at high noise levels. The process of generating 2AFC studies is illustrated in Fig. 3.
Figure 3.
Twenty-one 2AFC studies (FBP: five mAs settings × three lesion sizes; IR: two mAs settings × three lesion sizes) were generated by extracting a small region of interest around the lesion and at the corresponding location on the background image. Each 2AFC study had 100 trials obtained from repeated scans, totaling 2100 trials.
Each 2AFC study had 100 trials, with each trial consisting of a signal-present image and a signal-absent image, presented side-by-side in randomized order. In total, 2100 trials were presented to both the model and human observers. Truth for each trial was saved in a database to compare against the decision made by the model or human observer.
Human psychophysical experiments
Four board-certified medical physicists acted as human observers. Observers were first trained by presenting five images acquired at a high dose level (480 mAs) to them so that lesion characteristics (size, shape, contrast, location) were known for observers.
Human observers then participated in formal review sessions. The image display and viewing conditions are based on those specified in the ACR Technical Standard for Electronic Practice.53 Experiments were conducted in a darkened room with consistent ambient lighting. Observers were instructed to view the images binocularly from a distance of approximately 40 cm and were given unlimited time to reach a decision. All images were displayed with a fixed window level of 40 HU and window width of 400 HU, which are typically used for visualizing abdominal CT images in radiologists’ diagnosis. Image review was limited to 2 h/session to avoid fatigue. Percent correct for each observer was calculated for each 2AFC study by dividing the number of cases on which the observer made a correct decision by 100.
To estimate the overall performance for each study and associated confidence intervals, the clustering of evaluations (by readers) within images was analyzed using the equations for complex survey design where the individual image served as a clustering unit.54 These equations yielded a zero standard error for instances where there were no incorrect decision (100% correct by all four readers), so to address this, a conservative approach was considered where the effective sample size was set to the number of unique images (100). This approach is “conservative” since the sample size was smaller, so the resulting confidence interval was slightly wider while maintaining the same point estimate (100%) for the estimated percent correct. The clustered-adjusted confidence intervals were conducted using SAS PROC SURVEYFREQ (Cary, NC) using the score (Wilson) confidence interval option. The standard error (SE) was reported in the data with mean ± SE corresponding to the 68% confidence interval.
CHO
The general form of the test statistic for a linear model observer is the inner product between the observer template and the image, which yields a scalar response given by
| (1) |
where the vector g denotes a test image and ω denotes a template, each being an N × N matrix expressed in a column vector format with a dimension of N2. The template is different when selecting different model observers: An NPW observer's template is the expected signal, filtered by the square of the contrast sensitivity function of the human visual system when an eye filter is incorporated.26 CHO uses a set of channels to reflect the response of neurons in the primary visual cortex.14 The test variable in CHO is given by
| (2) |
where M is the total number of channels, gc is the channel output of the test image, and ωCHO is the template, which is given by
| (3) |
where is the intraclass channel scatter matrix, which is the average of the channel output covariance matrix when the signal is present and absent, Ksc = UTKsU, Kbc = UTKbU, and and are the channel output means of signal plus background and background: , . U is the matrix representation of the channel filters.
In this study, we used a CHO with Gabor filters. The general form of Gabor function can be expressed as47
| (4) |
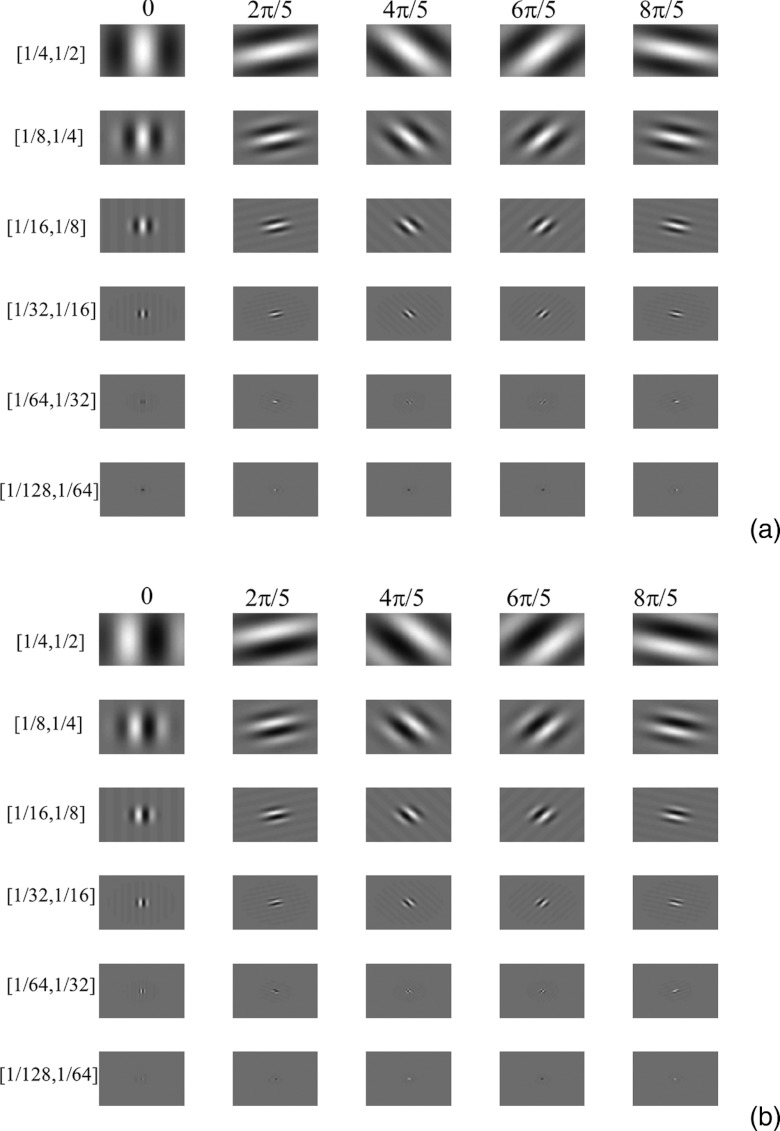
where ωs is the channel width, fc is the central frequency, θ is the orientation, and β is a phase factor. Six channel passbands were used: [1/128, 1/64], [1/64, 1/32], [1/32, 1/16], [1/16, 1/8], [1/8, 1/4], and [1/4, 1/2] cycles/pixel. The center frequencies were 3/256, 3/128, 3/64, 3/32, 3/16, and 3/8 cycles/pixel, respectively. Five orientations (0, 2π/5, 4π/5, 6π/5, and 8π/5) and two phases (0 and π/2) were also used. This setup is similar to that used in Ref. 47 except that two more channel passbands were added, leading to a total of 60 channels in the CHO implementation. Figure 4 shows 30 channels at each phase.
Figure 4.
Garbor filters with six channel passbands, five orientations, and two phases. (a) 30 channels when phase equals zero. (b) 30 channels when phase equals π/2.
Internal noise
Internal noise is a known component of human inefficiency in perception tasks and it is necessary to be included in visual detection models.55 We added internal noise to the decision variables according to the following equation:
| (5) |
where α is a weighting factor, x is a normally distributed random variable with a zero mean and a standard deviation of σ that can be obtained from
| (6) |
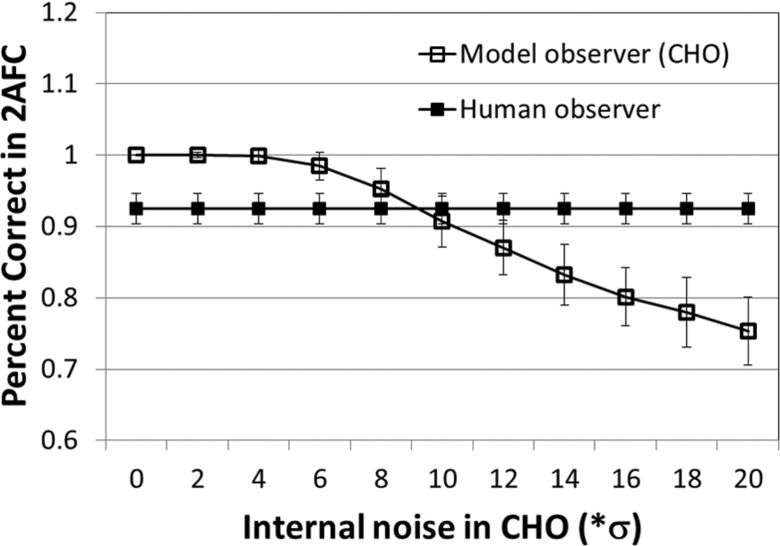
where “var” stands for variance and λb is the decision variable in signal-absent images The weighting factor α for the internal noise was determined through a calibration procedure using the images containing the 5 mm lesion and acquired at 120 mAs. In this procedure, different α values from 0 to 20 were used to predict the percent correct of model observer and compared with that of human observer. The α value that generated the same percent correct of model observer and human observer was used in all dose levels and lesion sizes.
Using CHO in 2AFC
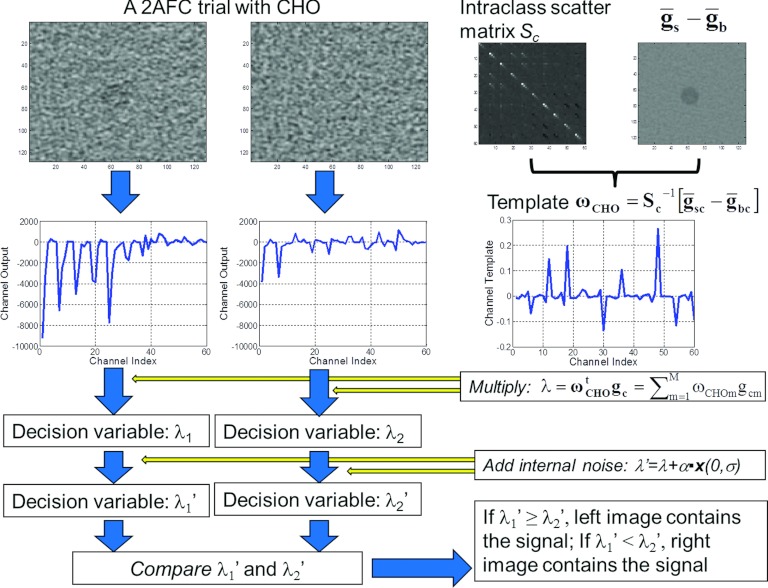
For each of the 21 2AFC studies, the covariance matrix and the template of the CHO were estimated using the 100 signal-absent images and the 100 signal-present images. The template was then multiplied by the channel output of the test images to generate the decision variables for the two images in each 2AFC trial. The same set of images was used for training the CHO and estimating the performance. This is consistent with one of the training-testing strategies described in page 973 in Ref. 56.
Figure 5 illustrates how the CHO makes decisions for each 2AFC trial. Note that we ran the CHO for each 2AFC trial and compared the decision made by the CHO with the truth to obtain the percent correct. To estimate the variation of percent correct caused by the internal noise, we applied the CHO on each trial 200 times. The standard error of the percent correct for each 2AFC study was calculated. An alternative approach to quantifying the performance of a model observer is to calculate the signal to noise ratio (SNR) or a receiver operating characteristic (ROC) curve using the test statistics in signal-present and signal-absent images without applying the template to each trial image. The area under the ROC curve (Az) obtained using this approach is equivalent to the percent correct obtained from a 2AFC experiment.57
Figure 5.
A flowchart on how the CHO makes a decision for each 2AFC trial.
RESULTS
Calibration of internal noise
The percent correct of CHO decreased as a function of the weighting factor α in the internal noise (Fig. 6). For comparison, the percent correct of the human observer for the same configuration (5 mm rod, 120 mAs, FBP reconstruction) was also displayed. The α value of 9.35 was determined to generate the same percent correct between model and human observers. This value was used in all the rest of the mAs levels and lesion sizes for both FBP and IR.
Figure 6.
For medium size (5 mm) lesion and 120 mAs, a calibration of internal noise was performed. The final internal noise was determined to be 9.35 times the noise of the decision variable when signal was absent.
Performance correlation between model and human observers for FBP reconstruction at various dose levels
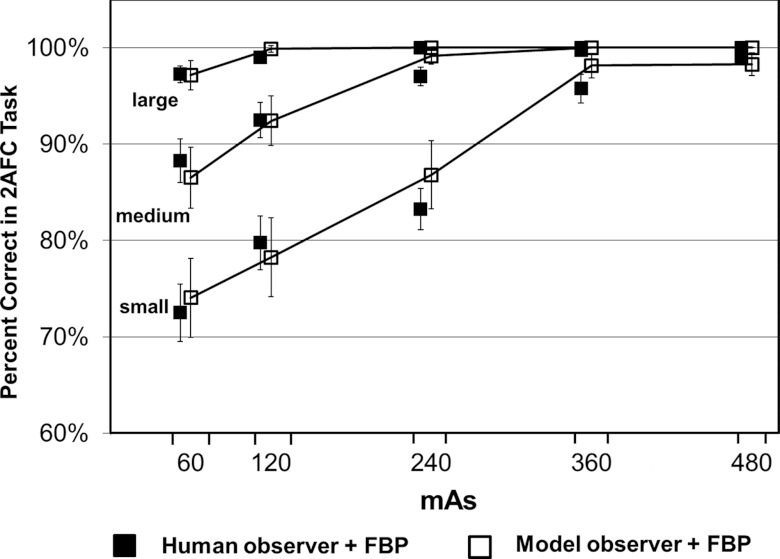
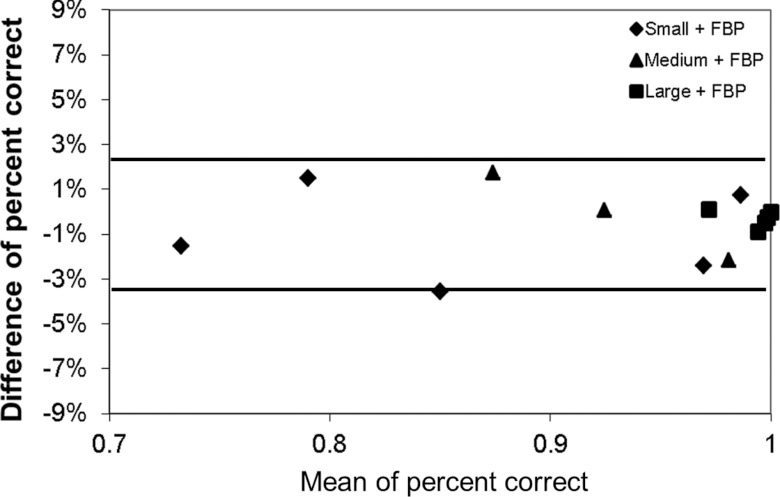
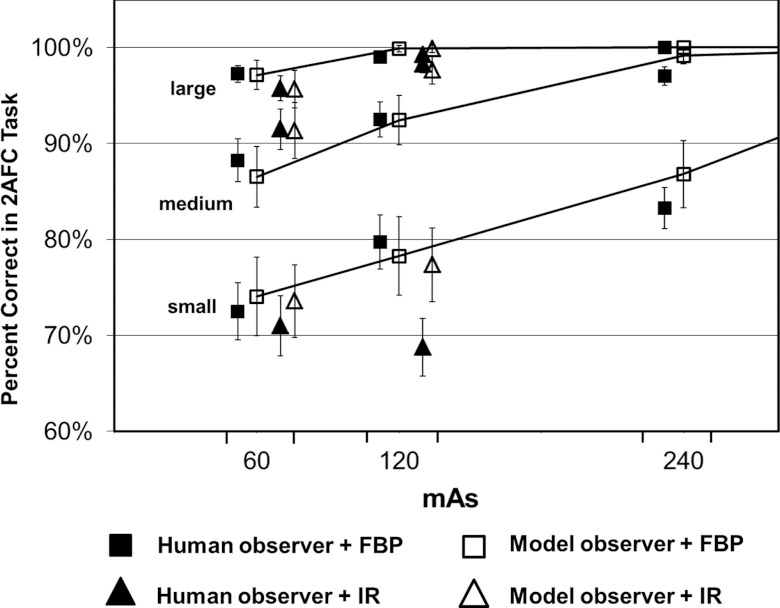
The performance in terms of percent correct predicted by the CHO was compared with that obtained by four medical physicists for the 15 2AFC studies involving images reconstructed with the FBP method. The results from human and model observers were highly correlated at each mAs level for each lesion size (Fig. 7). The error bars in Fig. 7 for the human observer were based on the standard errors calculated as described in Sec. 2C., which correspond to the 68% confidence interval. The error bars for the model observer were based on the standard error of the percent correct calculated from multiple realizations (200 times) of the internal noise for each 2AFC study, which also correspond to the 68% confidence interval. The Pearson's product-moment correlation coefficients were 0.982 [95% confidence interval (CI): 0.752–0.999], 0.981 (95% CI: 0.735–0.999), and 0.948 (95% CI: 0.398–0.997) for small, medium, and large lesions, respectively (JMP 9.0.1, SAS Institute Inc.). The overall correlation coefficient was 0.986 (95% CI: 0.958–0.996). When excluding the results from the large lesion, which approached 100% in four out of the five dose levels, the correlation coefficient was still as high as 0.983 (95% CI: 0.928–0.996). Bland-Altman plots showed excellent agreement for all dose levels and lesions sizes with a mean absolute difference of 1.0% ± 1.1% (Fig. 8). The range of the differences, which is given by [Δ − 2σ, Δ + 2σ], was [−3.3%, 2.4%], where Δ is the mean difference and σ is the standard deviation of the differences between model and human observers.
Figure 7.
Percent correct in each of the 15 2AFC tasks obtained by human observers (filled square symbols) and predicted by the CHO model observer (empty square symbols). The 15 2AFC tasks were generated at five mAs levels (60, 120, 240, 360, and 480 mAs) and three lesion sizes (small, medium, and large).
Figure 8.
Bland-Altman plot of percent correct difference between human and model observers in the 15 2AFC tasks for FBP reconstruction. The two solid lines (−3.3% and 2.4%) indicate the average difference ±2σ, where σ is the standard deviation of the differences.
Impact of iterative reconstruction on performance correlation between human and model observers
Figure 9 compares the performance predicted by the CHO with that obtained by the human observers for the IR reconstructed images at the two lower mAs settings (60 and 120 mAs). As a reference, the performance with the FBP reconstruction is also shown in the same figure.
Figure 9.
Performance comparison between human observers (filled square symbols) and model observers (empty square symbols) for the six 2AFC tasks when IR reconstruction was applied. The six 2AFC tasks were generated at two mAs levels (60 and 120 mAs) and three lesion sizes (small, medium, and large). The performance for the 2AFC tasks when FBP reconstruction was used was also displayed as a reference.
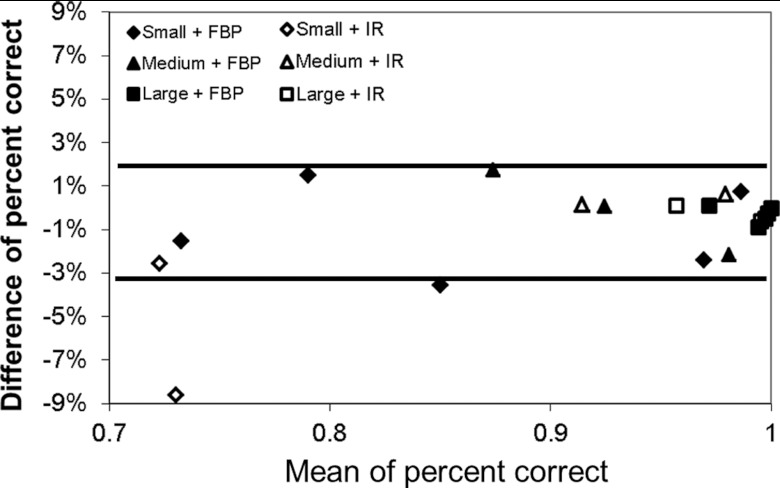
One can see that, with the use of IR, the percent correct predicted by the model observer is still in excellent agreement with that measured by the human observer, with a mean absolute difference of 2.1% ± 3.3%. The Pearson's product-moment correlation coefficients were 0.985 (95% CI: 0.863–0.998) for all lesions. Figure 10 shows a Bland-Altman plot for all 21 2AFC tasks, including 15 for FBP and 6 for IR. The mean absolute difference for all 21 tasks was 1.0% ± 1.0%. The range of the differences for the 6 tasks for IR which is given by [Δ − 2σ, Δ + 2σ], was [−8.8%, 5.2%], where Δ is the mean difference and σ is the standard deviation of the differences between model and human observers. The range of the differences for all 21 tasks were [−3.2%, 2.2%].
Figure 10.
Bland-Altman plot of percent correct difference between human and model observers in all 21 2AFC tasks. The two solid lines (−3.2% and 2.2%) indicate the average difference ±2σ, where σ is the standard deviation of the differences. For the six points with IR, the average difference ±2 σ is [−8.8%, 5.2%]. If excluding the only point with a big difference of −8.6% (120 mAs and small lesion), the average difference ±2 σ is [−3.0%, 2.1%], similar to FBP.
The highest discrepancy occurred for the small lesion at 120 mAs, where the difference between the two was −8.6%. In this setting, all human observers performed much worse than expected (even worse than a lower dose setting at 60 mAs). Excluding this unexpected exception, the mean absolute difference of other five predictions was 0.8% ± 1.0% and the range of the differences was [−3.0%, 2.1%]. The Pearson's product-moment correlation coefficients were 0.998 (95% CI: 0.973–1.0).
Does iterative reconstruction improve performance?
From Fig. 9, one can see that the performance achieved by human observers and predicted by model observers both did not show a clear sign that IR improved the performance in the 2AFC tasks for all dose and lesion size setting. For medium lesion size (5 mm in diameter), there was an improvement by human observers, from 88.3% ± 2.7% to 91.5% ± 2.1% at 60 mAs (p = 0.14, two-tail paired t-test) and from 92.5% ± 1.8% to 98.3 ± 0.9% at 120 mAs (p = 0.028, two-tail paired t-test). The improvement at 120 mAs was statistically significant. Such a trend of improvement was predicted correctly by the model observer, from 86.5% ± 3.2% to 91.3% ± 2.9% at 60 mAs and from 92.4% ± 2.6% to 97.6% ± 1.4% at 120 mAs. For large lesion size (9 mm), the performance was almost identical for both human (p = 0.34) and model observers (p = 0.72), maybe due to the fact that the percent correct is close to saturation (100%). For small lesion size (3 mm), however, the performance became unexpectedly worse at 120 mAs for human observers when IR was applied (from 79.8% ± 2.8% to 68.8 ± 3.0%, p = 0.021). Model observer predicted a slight drop from 78.3% ± 4.1% to 77.4% ± 3.8%, but was not statistically significant.
DISCUSSION
Although task-based image quality metrics using model observers have been studied extensively over the past three decades,13, 14 relatively few studies have been done in clinical CT.45, 46, 47, 48 Boedeker et al. used a NPW model observer calculated from spatial frequency-based metrics (MTF and NPS) to quantify the influence of reconstruction kernel and radiation dose on the SNR in a simple detection task.46 The signal in that study was generated by simulation, whereas NPS was measured from repeated phantom scans. Wunderlich and Noo derived the analytical formula of image covariance in direct fan-beam CT reconstruction and used a CHO for modeling the performance in a simulated lesion detection task.47 Richard et al. investigated the relationship between model observers and human observer performance for detection tasks in multislice CT.48 In their study, the model observers were frequency-based metrics using NPS and MTF and a computer simulation was employed to generate the lesions in the detection task. The concept of NPS and MTF assumes linear and shift-invariant properties of noise and spatial resolution. However, the shift-invariant assumption is not valid in CT imaging systems, due to the divergent x-ray beam. The linear assumption is also violated with the use of iterative reconstruction.12 In addition, the frequency-based model observer calculation assumes that noise is stationary and Gaussian and that the objects to be discriminated are nonrandom and known exactly.13, 25 Frequency-based model observers have to account for violation of these assumptions.
In the current study, we investigated how well an image-based CHO model observer can predict human observer performance for a simple 2AFC lesion-detection tasks using repeated actual CT scans. Due to the nonstationary noise and resolution properties in CT, it is important to use repeated CT scans to obtain reliable statistical information that is used to calculate the covariance matrix and intraclass scatter matrix. The existing model observer studies in CT simulated signals in order to generate multiple realizations of signal-present images.46, 47, 48 We used real CT scans for both signal-absent and signal-present images instead of inserting simulated signals onto background. We did this by scanning the phantom repeatedly using exactly the same settings, both with and without lesions, and then created each 2AFC study with a perfect match of location. This relatively tedious process was used in order to reduce the potential inconsistency between signal-absent and signal-present images. It should be noted that there are likely some correlations among the results for the small, medium, and large lesions for a given mAs setting since they are acquired from the same scan. In an ideal setup, the phantom should be designed to contain only one single rod in order to completely avoid the potential correlation. However, this will make the study extremely difficult (e.g., it requires a total of 3000 scans to perform this study). We expect that the impact from the correlation introduced by including three lesions in the same scan is minimal.
We achieved excellent agreement in performance between human and model observers at various dose levels for both FBP and an IR method. These results imply that the CHO model has the potential to be used for optimizing radiation dose and scanning protocols for clinical scenarios. However, one important limitation of the current study is that the phantom consists of a uniform water background and the task is a simple 2AFC detection task. How realistic anatomical background affects the agreement of model and human observers in clinical CT remains to be investigated. The model observers may need to be modified in order to achieve reasonable agreement. Phantoms with a more realistic background may need to be constructed to accurately simulate realistic diagnostic tasks. It is also desirable to evaluate on more complicated tasks, such as lesion classification and lesion detection with signal known statistically (SKS) in realistic background. Model observers have been developed in the past to incorporate these more realistic tasks.30, 58 In clinical CT, these remain to be topics of future research. We have already studied the effect of unknown location on the detection of lesions using a similar experimental setup,59 which will be reported in a second paper.
It should also be noted that CT image pixel value instead of “perceived luminance” by human visual system was used as the input to the model observer in this study. Given that the display monitor was calibrated appropriately following the ACR Technical Standard for Electronic Practice,53 the just noticeable difference (JND) index is a linear function of CT image pixel value when the display lookup table is linear within the range defined by the display window/level.60 For this reason, we do not expect that using CT image pixel value as the input to the model observer would generate a different result from using perceived luminance as the input.
Once a model observer is verified to be highly predictive of human observers in realistic diagnostic tasks, objective image quality assessment in CT becomes feasible, which will allow efficient optimization of scanning protocols and CT imaging systems without performing time-consuming and expensive observer performance studies for each diagnostic task.
CONCLUSIONS
A CHO-based model observer can be used to accurately predict human observer performance for a 2AFC low-contrast detection task on a uniform background at different radiation dose levels and for both FBP and IR methods, potentially providing a quantitative approach to efficiently optimizing CT protocols and radiation dose.
ACKNOWLEDGMENTS
This work was supported in part by National Institutes of Health (NIH) Grant No. R01 EB071095 from the National Institute of Biomedical Imaging and Bioengineering. CHM received research support from Siemens Healthcare. The authors would like to thank Dr. Matthew Kupinski for his help on model observers and Ms. Kristina Nunez for her assistance with paper preparation. Investigators interested in use of the data described in this study should contact the authors.
References
- National Council on Radiation Protection & Measurements (NCRP), “Ionizing radiation exposure of the population of the United States,” Report No. 160, 2009.
- Brenner D. J. and Hall E. J., “Computed tomography–An increasing source of radiation exposure,” N. Engl. J. Med. 357, 2277–2284 (2007). 10.1056/NEJMra072149 [DOI] [PubMed] [Google Scholar]
- AAPM CT Dose Summit, “Scan Parameter Optimization,” see http://www.aapm.org/meetings/2010CTS/default.asp. (2010).
- Hendee W. R., Becker G. J., Borgstede J. P., Bosma J., Casarella W. J., Erickson B. A., Maynard C. D., Thrall J. H., and Wallner P. E., “Addressing overutilization in medical imaging,” Radiology 257, 240–245 (2010). 10.1148/radiol.10100063 [DOI] [PubMed] [Google Scholar]
- Singh S., Kalra M. K., Moore M. A., Shailam R., Liu B., Toth T. L., Grant E., and Westra S. J., “Dose reduction and compliance with pediatric CT protocols adapted to patient size, clinical indication, and number of prior studies,” Radiology 252, 200–208 (2009). 10.1148/radiol.2521081554 [DOI] [PubMed] [Google Scholar]
- Karmazyn B., Frush D. P., Applegate K. E., Maxfield C., Cohen M. D., and Jones R. P., “CT with a computer-simulated dose reduction technique for detection of pediatric nephroureterolithiasis: Comparison of standard and reduced radiation doses,” Am. J. Roentgenol. 192, 143–149 (2009). 10.2214/AJR.08.1391 [DOI] [PubMed] [Google Scholar]
- Guimaraes L. S., Fletcher J. G., Harmsen W. S., Yu L., Siddiki H., Melton Z., Huprich J. E., Hough D., Hartman R., and McCollough C. H., “Appropriate patient selection at abdominal dual-energy CT using 80 kV: Relationship between patient size, image noise, and image quality,” Radiology 257, 732–742 (2010). 10.1148/radiol.10092016 [DOI] [PubMed] [Google Scholar]
- ACR CT Accreditation, “CT Accreditation Program Requirements,” see http://www.acr.org/accreditation/computed/ct_reqs.aspx (2010).
- Boone J. M., “Determination of the presampled MTF in computed tomography,” Med. Phys. 28, 356–360 (2001). 10.1118/1.1350438 [DOI] [PubMed] [Google Scholar]
- Hsieh J., Computed Tomography: Principles, Design, Artifacts, and Recent Advances (SPIE Press, Bellingham, Washington, 2006). [Google Scholar]
- Siewerdsen J. H., Cunningham I. A., and Jaffray D. A., “A framework for noise-power spectrum analysis of multidimensional images,” Med. Phys. 29, 2655–2671 (2002). 10.1118/1.1513158 [DOI] [PubMed] [Google Scholar]
- Evans J. D., Politte D. G., Whiting B. R., O’Sullian J. A., and Williamson J. F., “Effect of contrast magnitude and resolution metric on noise-resolution tradeoffs in x-ray CT imaging: A comparison of non-quadratic penalized alternating minimization and filtered backprojection algorithms,” Proc. SPIE 7961, 79612C (2011). 10.1117/12.876701 [DOI] [PMC free article] [PubMed] [Google Scholar]
- International Commission on Radiation Units and Measurements “Medical imaging - The assessment of image quality,” ICRU Report No. 54 (1995).
- Barrett H. H., Yao J., Rolland J. P., and Myers K. J., “Model observers for assessment of image quality,” Proc. Natl. Acad. Sci. U.S.A. 90, 9758–9765 (1993). 10.1073/pnas.90.21.9758 [DOI] [PMC free article] [PubMed] [Google Scholar]
- Myers K. J. and Barrett H. H., “Addition of a channel mechanism to the ideal-observer model,” J. Opt. Soc. Am. A 4, 2447–2457 (1987). 10.1364/JOSAA.4.002447 [DOI] [PubMed] [Google Scholar]
- Myers K. J., Barrett H. H., Borgstrom M. C., Patton D. D., and Seeley G. W., “Effect of noise correlation on detectability of disk signals in medical imaging,” J. Opt. Soc. Am. A Opt. Image Sci. Vis. 2, 1752–1759 (1985). 10.1364/JOSAA.2.001752 [DOI] [PubMed] [Google Scholar]
- Rolland J. P. and Barrett H. H., “Effect of random background inhomogeneity on observer detection performance,” J. Opt. Soc. Am. A Opt. Image Sci. Vis. 9, 649–658 (1992). 10.1364/JOSAA.9.000649 [DOI] [PubMed] [Google Scholar]
- Yao J. and Barrett H. H., “Predicting human performance by a channelized Hotelling observer model,” Proc. SPIE 1768, 161–168 (1992). 10.1117/12.130899 [DOI] [Google Scholar]
- Wilson H. R. and Bergen J. R., “A four mechanism model for threshold spatial vision,” Vision Res. 19, 19–32 (1979). 10.1016/0042-6989(79)90117-2 [DOI] [PubMed] [Google Scholar]
- Eckstein M. P. and Whiting J. S., “Lesion detection in structured noise,” Acad. Radiol. 2, 249–253 (1995). 10.1016/S1076-6332(05)80174-6 [DOI] [PubMed] [Google Scholar]
- Barrett H. H., Abbey C. K., Gallas B., and Eckstein M. P., “Stabilized estimates of Hotelling observer detection performance in patient structured noise,” Proc. SPIE 3340 (1998). 10.1117/12.306181 [DOI] [Google Scholar]
- Eckstein M. P., Abbey C. K., and Bochud F. O., “Visual signal detection in structured backgrounds. IV. Figures of merit for model performance in multiple-alternative forced-choice detection tasks with correlated responses,” J. Opt. Soc. Am. A Opt. Image Sci. Vis. 17, 206–217 (2000). 10.1364/JOSAA.17.000206 [DOI] [PubMed] [Google Scholar]
- Chawla A. S., Sarnei E., Saunders R., Abbey C., and Delong D., “Effect of dose reduction on the detection of mammographic lesions: A mathematical observer model analysis,” Med. Phys. 34, 3385–3398 (2007). 10.1118/1.2756607 [DOI] [PubMed] [Google Scholar]
- Park S., Barrett H. H., Clarkson E., Kupinski M. A., and Myers K. J., “Channelized-ideal observer using Laguerre-Gauss channels in detection tasks involving non-Gaussian distributed lumpy backgrounds and a Gaussian signal,” J. Opt. Soc. Am. A Opt. Image Sci. Vis 24, B136–B150 (2007). 10.1364/JOSAA.24.00B136 [DOI] [PMC free article] [PubMed] [Google Scholar]
- Wagner R. F., Brown D. G., and Pastel M. S., “Application of information theory to the assessment of computed tomography,” Med. Phys. 6, 83–94 (1979). 10.1118/1.594559 [DOI] [PubMed] [Google Scholar]
- Burgess A. E., “Statistically defined backgrounds: Performance of a modified nonprewhitening observer model,” J. Opt. Soc. Am. A Opt. Image Sci. Vis. 11, 1237–1242 (1994). 10.1364/JOSAA.11.001237 [DOI] [PubMed] [Google Scholar]
- Gifford H. C., King M. A., Pretorius P. H., and Wells R. G., “A comparison of human and model observers in multislice LROC studies,” IEEE Trans. Med. Imaging 24, 160–169 (2005). 10.1109/TMI.2004.839362 [DOI] [PubMed] [Google Scholar]
- Khurd P. and Gindi G., “Decision strategies that maximize the area under the LROC curve,” IEEE Trans. Med. Imaging 24, 1626–1636 (2005). 10.1109/TMI.2005.859210 [DOI] [PubMed] [Google Scholar]
- Liu B., Zhou L., Kulkarni S., and Gindi G., “The efficiency of the human observer for lesion detection and localization in emission tomography,” Phys. Med. Biol. 54, 2651–2666 (2009). 10.1088/0031-9155/54/9/004 [DOI] [PMC free article] [PubMed] [Google Scholar]
- Zhang Y., Pham B. T., and Eckstein M. P., “Automated optimization of JPEG 2000 encoder options based on model observer performance for detecting variable signals in x-ray coronary angiograms,” IEEE Trans. Med. Imaging 23, 459–474 (2004). 10.1109/TMI.2004.824153 [DOI] [PubMed] [Google Scholar]
- Yendiki A. and Fessler J., “Analysis of observer performance in known-location tasks for tomographic image reconstruction,” IEEE Trans. Med. Imaging 25, 28–41 (2006). 10.1109/TMI.2005.859714 [DOI] [PubMed] [Google Scholar]
- Gang G. J., Tward D. J., Lee J., and Siewerdsen J. H., “Anatomical background and generalized detectability in tomosynthesis and cone-beam CT,” Med. Phys. 37, 1948–1965 (2010). 10.1118/1.3352586 [DOI] [PMC free article] [PubMed] [Google Scholar]
- Park S., Jennings R., Liu H., Badano A., and Myers K. J., “A statistical, task-based evaluation method for three-dimensional x-ray breast imaging systems using variable-background phantoms,” Med. Phys. 37, 6253–6270 (2010). 10.1118/1.3488910 [DOI] [PMC free article] [PubMed] [Google Scholar]
- Gifford H. C., King M. A., de Vries D. J., and Soares E. J., “Channelized hotelling and human observer correlation for lesion detection in hepatic SPECT imaging,” J. Nucl. Med. 41, 514–521 (2000). [PubMed] [Google Scholar]
- Sain J. D. and Barrett H. H., “Performance evaluation of a modular gamma camera using a detectability index,” J. Nucl. Med. 44, 58–66 (2003). [PubMed] [Google Scholar]
- Barrett H. H., Furenlid L. R., Freed M., Hesterman J. Y., Kupinski M. A., Clarkson E., and Whitaker M. K., “Adaptive SPECT,” IEEE Trans. Med. Imaging 27, 775–788 (2008). 10.1109/TMI.2007.913241 [DOI] [PMC free article] [PubMed] [Google Scholar]
- Burgess A. E., Jacobson F. L., and Judy P. F., “Human observer detection experiments with mammograms and power-law noise,” Med. Phys. 28, 419–437 (2001). 10.1118/1.1355308 [DOI] [PubMed] [Google Scholar]
- Chen L. Y. and Barrett H. H., “Task-based lens design with application to digital mammography,” J. Opt. Soc. Am. A Opt. Image Sci. Vis. 22, 148–167 (2005). 10.1364/JOSAA.22.000148 [DOI] [PMC free article] [PubMed] [Google Scholar]
- Hill M. L., Mainprize J. G., and Yaffe M. J., “An observer model for lesion detectability in contrast-enhanced digital mammography,” Digital Mammography 6136, 720–727 (2010). 10.1007/978-3-642-13666-5 [DOI] [Google Scholar]
- Richard S. and Siewerdsen J. H., “Comparison of model and human observer performance for detection and discrimination tasks using dual-energy x-ray images,” Med. Phys. 35, 5043–5053 (2008). 10.1118/1.2988161 [DOI] [PMC free article] [PubMed] [Google Scholar]
- Reiser I. and Nishikawa R. M., “Task-based assessment of breast tomosynthesis: Effect of acquisition parameters and quantum noise,” Med. Phys. 37, 1591–1600 (2010). 10.1118/1.3357288 [DOI] [PMC free article] [PubMed] [Google Scholar]
- Richard S. and Samei E., “Quantitative imaging in breast tomosynthesis and CT: Comparison of detection and estimation task performance,” Med. Phys. 37, 2627–2637 (2010). 10.1118/1.3429025 [DOI] [PubMed] [Google Scholar]
- Gang G. J., Zbijewski W., Webster Stayman J., and Siewerdsen J. H., “Cascaded systems analysis of noise and detectability in dual-energy cone-beam CT,” Med. Phys. 39, 5145–5156 (2012). 10.1118/1.4736420 [DOI] [PMC free article] [PubMed] [Google Scholar]
- Tisdall M. D. and Atkins M. S., “Using human and model performance to compare MRI reconstructions,” IEEE Trans. Med. Imaging 25, 1510–1517 (2006). 10.1109/TMI.2006.881374 [DOI] [PubMed] [Google Scholar]
- Judy P. F., Swensson R. G., and Szulc M., “Lesion detection and signal-to-noise ratio in CT images,” Med. Phys. 8, 13–23 (1981). 10.1118/1.594903 [DOI] [PubMed] [Google Scholar]
- Boedeker K. L. and McNitt-Gray M. F., “Application of the noise power spectrum in modern diagnostic MDCT: Part II. Noise power spectra and signal to noise,” Phys. Med. Biol. 52, 4047–4061 (2007). 10.1088/0031-9155/52/14/003 [DOI] [PubMed] [Google Scholar]
- Wunderlich A. and Noo F., “Image covariance and lesion detectability in direct fan-beam x-ray computed tomography,” Phys. Med. Biol. 53, 2471–2493 (2008). 10.1088/0031-9155/53/10/002 [DOI] [PMC free article] [PubMed] [Google Scholar]
- Richard S., Yadava G., Li X., and Samei E., “Predictive models for observer performance in CT: Applications in protocol optimization,” Proc. SPIE 7961, 79610H (2011). 10.1117/12.877069 [DOI] [Google Scholar]
- McCollough C. H., Chen G. H., Kalender W., Leng S., Samei E., Taguchi K., Wang G., Yu L. F., and Pettigrew R. I., “Achieving routine submillisievert CT scanning: Report from the summit on management of radiation dose in CT,” Radiology 264, 567–580 (2012). 10.1148/radiol.12112265 [DOI] [PMC free article] [PubMed] [Google Scholar]
- Flohr T., Stierstorfer K., Raupach R., Ulzheimer S., and Bruder H., “Performance evaluation of a 64-slice CT system with z-flying focal spot,” Rofo Fortschr Geb Rontgenstr Neuen Bildgeb Verfahr 176, 1803–1810 (2004). 10.1055/s-2004-813717 [DOI] [PubMed] [Google Scholar]
- Stierstorfer K., Rauscher A., Boese J., Bruder H., Schaller S., and Flohr T., “Weighted FBP - A simple approximate 3D FBP algorithm for multislice spiral CT with good dose usage for arbitrary pitch,” Phys. Med. Biol. 49, 2209–2218 (2004). 10.1088/0031-9155/49/11/007 [DOI] [PubMed] [Google Scholar]
- Christner J. A., Stierstorfer K., Primak A. N., Eusemann C. D., Flohr T. G., and McCollough C. H., “Evaluation of z-axis resolution and image noise for nonconstant velocity spiral CT data reconstructed using a weighted 3D filtered backprojection (WFBP) reconstruction algorithm,” Med. Phys. 37, 897–906 (2010). 10.1118/1.3271110 [DOI] [PubMed] [Google Scholar]
- ACR Electronic Practice Guideline, “ACR Technical standard for electronic practice of medical imaging,” see http://gm.acr.org/SecondaryMainMenuCategories/quality_safety/guidelines/med_phys/electronic_practice.aspx (2007).
- Rao J. N. K. and Scott A. J., “A simple method for the analysis of clustered binary data,” Biometrics 48, 577–585 (1992). 10.2307/2532311 [DOI] [PubMed] [Google Scholar]
- Zhang Y., Pham B. T., and Eckstein M. P., “Evaluation of internal noise methods for Hotelling observer models,” Med. Phys. 34, 3312–3322 (2007). 10.1118/1.2756603 [DOI] [PubMed] [Google Scholar]
- Barrett H. H. and Myers K. J., Foundations of Image Science (John Wiley's & Sons, Hoboken, NJ, 2004). [Google Scholar]
- Abbey C. K. and Bochud F. O., “Modeling visual detection tasks in correlated image noise with linear model observers,” Handbook of Medical Imaging, Volume 1, Physics and Psychophysics (SPIE, Bellingham, Washington, 2000). [Google Scholar]
- Zhou L. L. and Gindi G., “Collimator optimization in SPECT based on a joint detection and localization task,” Phys. Med. Biol. 54, 4423–4437 (2009). 10.1088/0031-9155/54/14/005 [DOI] [PMC free article] [PubMed] [Google Scholar]
- Leng S., Yu L., Chen L., Ramirez-Giraldo J. C., and McCollough C. H., “Correlation between model observer and human observer performance in CT imaging when lesion location is uncertain,” Proc. SPIE 8313, 83131M (2012). 10.1117/12.912126 [DOI] [PMC free article] [PubMed] [Google Scholar]
- Fetterly K. A., Blume H. R., Flynn M. J., and Samei E., “Introduction to grayscale calibration and related aspects of medical imaging grade liquid crystal displays,” J. Digit Imaging 21, 193–207 (2008). 10.1007/s10278-007-9022-y [DOI] [PMC free article] [PubMed] [Google Scholar]


