Abstract
Purpose: Severe artifacts in kilovoltage-CT simulation images caused by large metallic implants can significantly degrade the conspicuity and apparent CT Hounsfield number of targets and anatomic structures, jeopardize the confidence of anatomical segmentation, and introduce inaccuracies into the radiation therapy treatment planning process. This study evaluated the performance of the first commercial orthopedic metal artifact reduction function (O-MAR) for radiation therapy, and investigated its clinical applications in treatment planning.
Methods: Both phantom and clinical data were used for the evaluation. The CIRS electron density phantom with known physical (and electron) density plugs and removable titanium implants was scanned on a Philips Brilliance Big Bore 16-slice CT simulator. The CT Hounsfield numbers of density plugs on both uncorrected and O-MAR corrected images were compared. Treatment planning accuracy was evaluated by comparing simulated dose distributions computed using the true density images, uncorrected images, and O-MAR corrected images. Ten CT image sets of patients with large hip implants were processed with the O-MAR function and evaluated by two radiation oncologists using a five-point score for overall image quality, anatomical conspicuity, and CT Hounsfield number accuracy. By utilizing the same structure contours delineated from the O-MAR corrected images, clinical IMRT treatment plans for five patients were computed on the uncorrected and O-MAR corrected images, respectively, and compared.
Results: Results of the phantom study indicated that CT Hounsfield number accuracy and noise were improved on the O-MAR corrected images, especially for images with bilateral metal implants. The γ pass rates of the simulated dose distributions computed on the uncorrected and O-MAR corrected images referenced to those of the true densities were higher than 99.9% (even when using 1% and 3 mm distance-to-agreement criterion), suggesting that dose distributions were clinically identical. In all patient cases, radiation oncologists rated O-MAR corrected images as higher quality. Formerly obscured critical structures were able to be visualized. The overall image quality and the conspicuity in critical organs were significantly improved compared with the uncorrected images: overall quality score (1.35 vs 3.25, P = 0.0022); bladder (2.15 vs 3.7, P = 0.0023); prostate and seminal vesicles/vagina (1.3 vs 3.275, P = 0.0020); rectum (2.8 vs 3.9, P = 0.0021). The noise levels of the selected ROIs were reduced from 93.7 to 38.2 HU. On most cases (8/10), the average CT Hounsfield numbers of the prostate/vagina on the O-MAR corrected images were closer to the referenced value (41.2 HU, an average measured from patients without metal implants) than those on the uncorrected images. High γ pass rates of the five IMRT dose distribution pairs indicated that the dose distributions were not significantly affected by the CT image improvements.
Conclusions: Overall, this study indicated that the O-MAR function can remarkably reduce metal artifacts and improve both CT Hounsfield number accuracy and target and critical structure visualization. Although there was no significant impact of the O-MAR algorithm on the calculated dose distributions, we suggest that O-MAR corrected images are more suitable for the entire treatment planning process by offering better anatomical structure visualization, improving radiation oncologists’ confidence in target delineation, and by avoiding subjective density overrides of artifact regions on uncorrected images.
Keywords: metal artifact reduction, CT simulations, dose distribution, radiation therapy
INTRODUCTION
In radiation oncology, target delineation and tissue electron density (as indicated by CT Hounsfield numbers) play a critical role in assuring CT-based treatment planning accuracy. However, metallic implants, especially large hip prostheses, can produce severe CT image artifacts.1 These artifacts not only jeopardize the radiation oncologists’ confidence of tumor and organ delineation but also severely affect the CT Hounsfield number accuracy. When generating a treatment plan with CT images distorted and obscured by metal artifacts, clinicians have to rely on making educated guesses when contouring both targets and critical structures (for example, the prostate and rectum) based on their clinical experience. In practice, dosimetrists must manually override the artifact regions to an artificial electron density in order to partially account for tissue heterogeneities. Supplementing kilovoltage-CT simulation images with a megavoltage-CT (MVCT) image set can mitigate delineation uncertainty, as MVCT is not as susceptible to metal artifacts. However, this practice is often associated with concerns about lower soft tissue contrast information, MVCT and kilovoltage-CT image registration accuracy, and additional patient dose from megavoltage imaging.
Various techniques for metallic artifact reduction have been proposed, such as iterative reconstruction methods and projection modification methods based on either projection data or from reconstructed images.2, 3, 4, 5, 6, 7, 8, 9, 10, 11, 12, 13, 14, 15, 16, 17, 18, 19, 20, 21, 22, 23, 24, 25, 26, 27, 28, 29, 30, 31, 32, 33 Iterative reconstruction methods are generally less susceptible to streaking and nonlinear partial volume artifacts caused by high-contrast objects relative to analytical reconstruction methods.2, 3 Although promising, these methods are often difficult to implement in combination with standard reconstruction algorithms and are computationally expensive, especially for the large data sets generated by multislice CT scanners.
Most metal artifact reduction methods are based on the strategy of projection modification. With this strategy, data that are severely contaminated by metal implants are modified according to the knowledge obtained from uncontaminated data. A critical step in this strategy is to localize the metal regions on the projection data so that they can be replaced with appropriate estimations. One procedure involves the segmentation of metal regions in reconstructed images, forward-projection of those regions to localize the projection data that have been contaminated by the metal implants, replacement of the affected projection data, and reconstruction of the corrected data.5, 6, 7, 8, 23, 26, 27 The maximum a posteriori (MAP) reconstruction combining the iterative reconstruction with projection completion,23 the fractional-order curvature diffusion-based method,26 and the forward projected reconstruction-based method27 utilized this strategy. The advantage of this procedure is that once the metal region is segmented in the reconstructed image, the projection data contaminated by the metal implants can be consistently determined among all projection views through forward-projection. However, the reconstructed images usually contain severe artifacts, making metal region segmentation very difficult, especially on the cases with large metal implants such as hip prostheses and shoulder implants.
Another procedure involves the direct segmentation of metal shadows in raw projection data and the replacement of these data with corrected values. The corrected raw data are then used for image reconstruction. Manual segmentation of metal shadows was initially proposed, but proved to be very time consuming. Some reported methods utilized thresholding as the first step to locate the metal shadows, followed by interpolation methods to replace the missing data, such as the polynomial interpolation technique,24 Euclidean distance calculation method,25 multiresolution wavelet analysis method,12 partial projection detection method for Conebeam CT images,11 opposite view data replacement approach,28 and the reformatted projection modification method.1, 10 Typically, one routine chest-abdomen-pelvis scan acquired using a 64 multislice helical CT scanner contains 40 000–70 000 projection frames. Detecting multiple metal implants on each projection frame is very challenging due to the large number of metal shadows. In projection modification methods, the major challenge lies in the detection of metal implants either in the reconstructed images or raw projection data.
Metal artifact reduction techniques have mainly been qualitatively evaluated based on physicians’ subjective opinions or based on phantom studies.17, 23, 29, 30, 31, 32 Recently, due to the difficulty in obtaining clinical patient case “ground truth” data, a reference-free ground truth metric has been proposed based on the forward projection of reconstructed images, and utilized for clinical data evaluation.33 In addition, an online metal artifact reduction tool based on a metal deletion technique (MDT) algorithm has been provided for public use.29, 32, 34 These evaluations were performed using the phantom and simulation data for the image quality evaluation. These promising evaluations may satisfy diagnostic needs but are inadequate for radiotherapy planning needs such as the dosimetry requirements. Given the critical role of CT simulation images in radiation therapy, systematic and quantitative evaluation of metal artifact corrections on treatment planning is needed.
While there has been a thriving literature on various metal artifact reduction techniques, it was only recently that the first commercial orthopedic metal artifact reduction function (O-MAR) designed for radiation therapy was released (Philips Healthcare System, Cleveland, OH). The purpose of this study was to evaluate its performance for use in radiation oncology practice on patient cases with large metal implants, the improvement on visualization of critical anatomy and CT Hounsfield number accuracy, and also investigate its effects on treatment planning dosimetry.
METHOD AND MATERIALS
Orthopedic metal artifact reduction algorithm
The commercial O-MAR algorithm evaluated in this study is an iterative projection modification solution.35 First, the original uncorrected CT image is reconstructed with no metal artifact reduction and used as the input image during the first iteration. Also a tissue-classified image is created by segmenting the input image into tissue and nontissue pixels during the first iteration. All pixels within a certain CT Hounsfield number range near 0 are classified as tissue and set to a single value, while others are unmodified. For each iteration, the input image was segmented to create a metal-only image mask, which is a binary image, assigning a value of 1 where the metal exists and 0 elsewhere. The metal-only, tissue-classified, and input images are all forward projected (FP) to generate corresponding sinogram data. The tissue-classified sinogram is subtracted from the original image sinogram to produce an error sinogram. The metal sinogram data are then utilized as the mask to remove the nonmetal data points from the error sinogram. This error sinogram data are back-projected to generate a correction image, and combined with the current input image to generate the updated image for the next iteration. This process is iteratively performed until reaching optimization.
In this algorithm, the metal only image consists of all pixels set to zero except for those pixels categorized as metal, which will be used to identify the projections within the sinogram data that have contributions from metal. If no large clusters of metal pixels are present in the image, no further processing is performed. Therefore, this algorithm has no impact on nonmetal regions in the images and can be used for processing large orthopedic metal implants. During the first iteration process of this O-MAR algorithm, the severe metal artifacts and hypodense areas in the original uncorrected image may have an impact on generating a robust tissue-classified image. As such, the tissue-classified image is not produced from the original uncorrected sinogram, but from the sinogram with metal region identified, removed, and interpolated with simulated tissue values. This modified sinogram is back-projected and the resultant image is used to create the tissue-classified image. This step is only performed during the first iteration, and not the subsequent iterations. Starting from the second iteration, the tissue classified image is generated from the current input image since a significant portion of the metal artifacts have been corrected. Also, the corrections only affect the metal artifact regions of the original image, so the spatial resolution of the original image is maintained, which is different to some other algorithms that synthesize an entire new image to correct for metal artifact, and might degrade the overall spatial resolution of the corrected image. Similar methods for determining the metal-only image mask and filling the metal shadow were also reported in the frequency split MAR algorithm19 and normalized MAR algorithm,18 which were called as inpainting-based MAR methods, but inherit similar procedures.
However, it is important to note that Philips recommends that this algorithm is not suitable for processing stents, external metals, implanted devices near skin surface, metals near air pockets, and surgical screws, or clips due to an unforeseen consequence where the O-MAR algorithm may induce some abnormalities in the corrected images. There are some cases where O-MAR should be avoided as outlined in the contraindications section. These commonly occur when the metal is in close proximity to air or lung tissue or small metal object (e.g., stents) within iodinated contrast. Since there is an unforeseen consequence where O-MAR may induce some anomalies in the image, it behooves the clinician to always cross reference the uncorrected images with the O-MAR dataset. Since the system will always reconstruct both sets of images whenever O-MAR is selected, the uncorrected images are readily available. When O-MAR is utilized appropriately, it can improve the visualization of CT images that are negatively impacted by the presence of orthopedic metal. More details regarding this O-MAR algorithm can be found in the Philips white paper.35
Phantom evaluations
Data acquisition
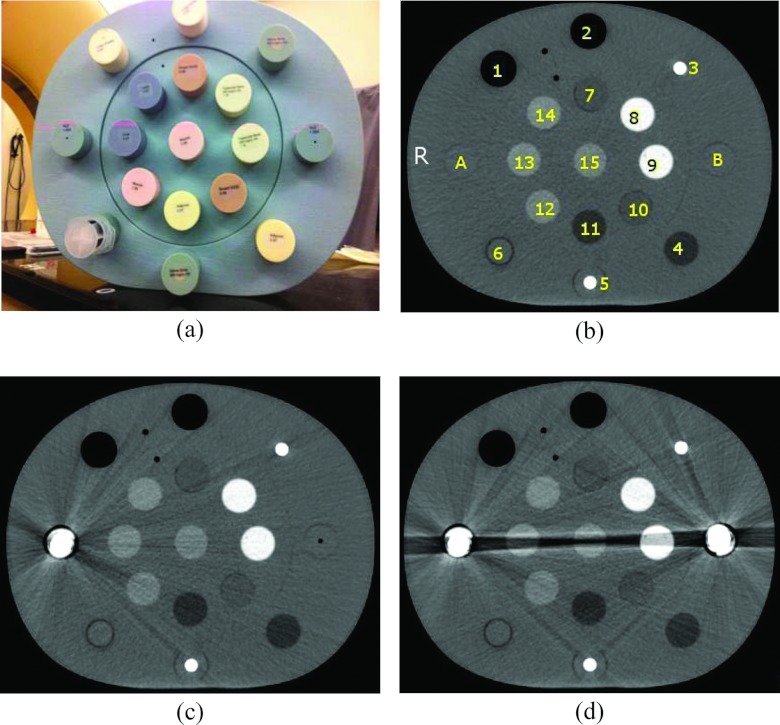
Phantom studies were conducted using a CIRS electron density (ED) phantom (Model 062) and sample metal titanium prostheses. The sample metal implants are composed of the same material (titanium) as those used for patients, but with smaller sizes. The ED phantom is made of water-equivalent materials (physical density 1.02 g/cm3) with dimensions of 330 mm in width, 270 mm in height, and 50 mm in depth. The diameter of each density plug is approximately 30 mm. Either water-equivalent plugs, one, or two metal implants were inserted into the left and right cavities for imaging of the ED phantom to simulate without, unilateral, and bilateral hip implants [A and B shown in Fig. 1b]. Plugs of different density values (ranging from 0.20 to 1.53 g/cm3) were placed in the neighboring cavities. Several plugs with physical densities similar to soft tissue (ranging from 0.96 to 1.06 g/cm3) were centered between the metal implants in order to simulate critical structures within human body.
Figure 1.
(a) CIRS Electron Density Phantom, CT images of the ED phantom (b) without metal implants, (c) with a unilateral metal implant, and (d) with bilateral metal implants. The physical density and electron density of each plug are listed in Table 1. Either water-equivalent plugs or metal implants were inserted in the positions A and B to simulate metal artifact-free, single or bilateral metal implant images. Label “R” shown in panel (b) represents the right side of the phantom. The image display window width is 400 HU, and window level is 800 HU.
The ED phantom was scanned on a Philips Brilliance 16-slice Big Bore CT scanner using a clinical abdomen protocol with settings of 120 kVp, 400 mAs/slice, 16 × 1.5 mm collimation setting, 0.813 pitch, 1 second rotation time, 600 mm field of view (FOV), 3 mm slice thickness, standard resolution, and standard filter B. Standard resolution refers to the sampling frequency of the detectors, and filter is the reconstruction kernel used for filtered back-projection. A higher sampling frequency will result in higher scan plane resolution but will also have higher noise. Standard filter B provides accurate CT Hounsfield numbers and is suitable for routine abdomen, pelvis, and CT angiography scans.
First, a metal artifact-free image was acquired by placing water-equivalent plugs of physical density 1.02 g/cm3 in the A and B locations of the ED phantom for use as ground truth for the evaluations. The scan process was then repeated for a simulated unilateral implant by replacing one water-equivalent plug with a metal prosthesis implant. A final scan was acquired after both metal implants were placed in the A and B locations of the phantom to simulate bilateral implants. CT images of the phantom with either unilateral or bilateral hip implants in place were processed using the O-MAR function. The five image sets (i.e., without implant, with an unilateral implant, with bilateral implants, the O-MAR corrected image with an unilateral implant, and the O-MAR corrected images with bilateral implants), were analyzed through CT Hounsfield number accuracy comparison. These image sets were also sent to the Pinnacle Radiation Therapy Treatment Planning System version 9.0 (Philips Healthcare System, Cleveland, OH) for simulated treatment plan comparison.
CT Hounsfield number accuracy evaluation
For each image set, five slices of the center region of the ED phantom were selected. A set of contours outlining a uniform circular region of interest (ROI) within each density plug was defined on each slice. The average CT Hounsfield number and noise σ (CT Hounsfield number standard deviation) for each ROI were measured on both the uncorrected and O-MAR corrected images and compared with those measured from the artifact-free images. CT Hounsfield number difference and noise difference were calculated using the following equations:
| (1) |
| (2) |
Dosimetric comparison
A quantitative dosimetry evaluation was conducted on each of the five image sets utilizing the single beam geometry at both 6 and 18 MV. For each beam, the monitor units (MU) were set as 100 MU, the SAD (source to axis distance) was set as 100 cm, and the field was set as 10 × 10 cm2. With identical beam geometries and dose prescriptions, dose distributions were computed using the uncorrected and O-MAR corrected images with unilateral and bilateral metal implants and compared to the dose distribution computed on the artifact-free image set. No density overrides were made to the artifact regions on the metal contaminated images for dose calculations. A local spatial interpolation was performed to correlate the evaluated pairs. The absolute dose difference was first calculated for each dose distribution pair. In addition, because the absolute dose difference is very sensitive to discrepancies in steep dose gradient regions, the γ distribution was also calculated for each dose distribution pair.36, 37 The γ distribution tool is a common dose comparison method and widely used in radiation therapy for patient treatment plan quality assurance. This tool simultaneously incorporates both dose and distance-to-agreement (DTA) criteria to provide a numerical quality index that serves as a measure of disagreement in the regions that fail the acceptance criteria and indicates the calculation quality in the regions that pass. In this study, we compared the γ distributions of each evaluated pair using two sets of criteria: 3% with 3 mm DTA and 1% with 3 mm DTA. Dose areas with a γ value less or equal to 1.0 were considered clinically equivalent.
Clinical case evaluation
Ten helical CT scans of patients with metal implants (seven with unilateral hip implants and three with bilateral hip implants) were collected. Each patient was scanned on the Philips Brilliance 16-slice Big Bore CT scanner with a routine clinical protocol acquired with the following settings: 120 kVp, 16 × 1.5 mm2 collimation setting, 0.813 pitch, 1 s rotation time, 600 mm FOV, 3 mm slice thickness, standard resolution, and standard filter B with mAs/slice ranging from 400 to 800 according to the patient lateral size.
Metal artifact reduction and CT Hounsfield number accuracy evaluations
The original uncorrected and O-MAR corrected patient image sets were independently evaluated by two experienced radiation oncologists using an established review process.10 For each case, the uncorrected and O-MAR corrected images were reviewed side-by-side. The radiation oncologists were allowed to browse through each image series, zoom in and out, and adjust the window settings. They ranked the overall image quality and visual conspicuity of the bladder, prostate and seminal vesicles/vagina, and rectum using a five-point score: 0 = totally obscured, no structures identifiable; 1 = marked artifacts, questionable recognition; 2 = faint anatomic recognition; 3 = anatomic recognition with low confidence; 4 = anatomic recognition with medium confidence; and 5 = anatomic recognition with high confidence for segmentation. The preferred dataset (uncorrected or O-MAR corrected) was also indicated. The final ranking was obtained by averaging the ranks from two radiation oncologists. A Wilcoxon signed rank test was performed to analyze the quality ranking and to determine significant differences between the uncorrected images and O-MAR corrected images. A P value of less than 0.05 indicated a statistically significant difference.
Additionally, the average CT Hounsfield number and σ at the prostate (or vagina) ROIs were measured. For each image set, the prostate (or vagina) ROIs were first determined on the O-MAR corrected image on three consecutive slices. The average CT Hounsfield number and σ on the three identified slices were calculated for each ROI. Then the ROI was mapped to the uncorrected image to calculate the corresponding average CT Hounsfield number and noise and compare to those calculated on the O-MAR corrected image. Due to the lack of ground truth CT Hounsfield number on patient cases, we randomly chose five CT pelvis scans from patients scanned with the same scanner but without metal implants and measured the average CT Hounsfield number within the prostate regions. The average measured value, 41.2 HU, was used to qualitatively evaluate the CT Hounsfield number accuracy of the uncorrected and O-MAR corrected images.
Dosimetric comparison
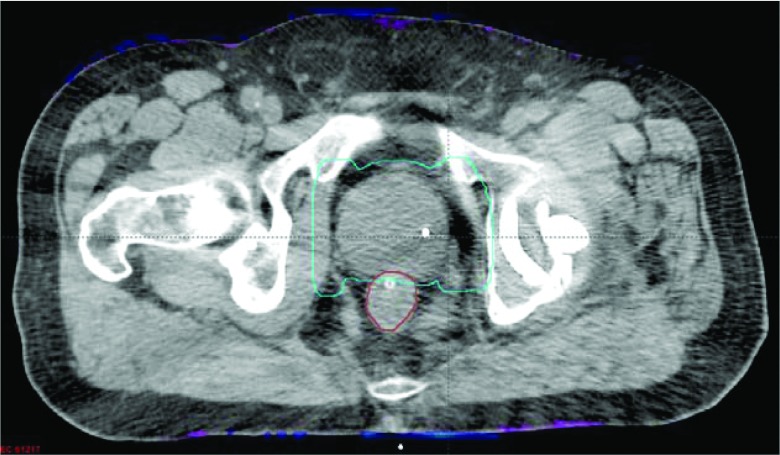
Five of the ten patient cases with large hip implants received IMRT treatment for prostate cancer. The evaluation flow was as follows. First, both the uncorrected and O-MAR corrected CT images were sent to the Pinnacle treatment planning system. Target and critical structures were then delineated on the O-MAR corrected image set. The delineated structures were mapped to the uncorrected metal contaminated images, in which the artifact regions were manually overridden to a density of 1.0 g/cc to account for apparent tissue heterogeneities, for clinical planning and dose computation.
The IMRT planning protocol for prostate cancer in our clinic is as follows. The IMRT plan uses seven 18 MV beams. The beams are approximately evenly distributed around the patient but avoid entering through the high density regions, because both the greater backscatter effect when photons enter the high density region and the rebuild up of electronic equilibrium when photons penetrate back to the soft tissue might cause high dose (hot spot) at those boundary regions. The planning target volume (PTV) is defined as the clinical target volume (CTV) plus a 5 mm margin. Regarding to the treatment planning goals, the maximum dose within the PTV needs to be less than 110% of the prescription dose, and more than 98% of the PTV should receive the prescribed dose or higher. The dose limits to the rectum are 65 Gy to less than 17% of the volume and 40 Gy to less than 35% of the volume. The dose limits to the bladder are 65 Gy to less than 25% of the volume and 40 Gy to less than 50% of the volume. This routine protocol might vary slightly for a specific patient. In order to investigate only the effects of utilizing different CT datasets on dose distributions, the dose prescription, beam geometry, and related parameters from the clinically uncorrected image-based plan were mapped precisely to the O-MAR corrected image, and the dose distribution was recomputed and compared.
RESULTS
Phantom study on CT Hounsfield number accuracy improvement
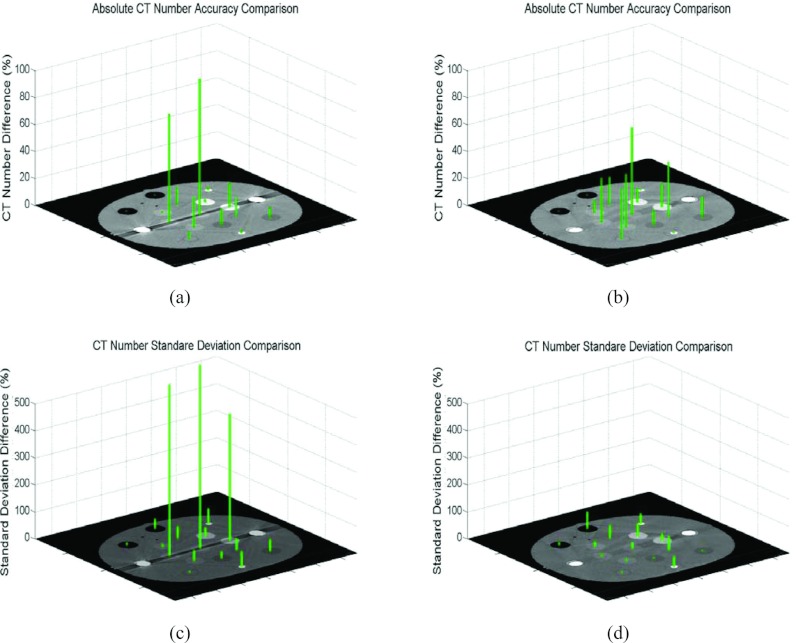
Figure 2 shows both CT Hounsfield number differences and noise differences between either the uncorrected metal contaminated images [panels (a) and (c)] or the O-MAR corrected images [panels (b) and (d)] and the ground truth data for the bilateral metal implant study. It is evident that CT Hounsfield number accuracy was dramatically improved on plugs #13 and #15. As shown in panels (a) and (b), the CT Hounsfield number difference of the liver-equivalent plug #13 of the uncorrected image is 80% compared to 33% on the O-MAR corrected image. The absolute CT Hounsfield number was 9.5 HU in the uncorrected image, which was improved to 32.5 HU on the O-MAR corrected image, compared to the ground truth of 48.5 HU. Similarly, for the muscle-equivalent plug #15 (the center plug), the CT Hounsfield number difference was improved from 101% to 65%. Note that the improvement in CT Hounsfield number difference for the trabecular bone-equivalent plug #9 is very subtle even though it lies on the same projection line-integral (i.e., inplane) as plugs #13 and metal stems, suggesting that metal objects have minor impacts on high atomic-number material such as bone. The O-MAR algorithm also had minor effects on the plugs that do not locate inplane, such as the adipose-equivalent plug #4, the water-equivalent plug #6, the breast-equivalent plug #7, and the muscle-equivalent plug #12. This is due to the presence of residual artifacts from imperfect corrections that increased the error levels. However, the maximum difference in absolute CT Hounsfield number between the uncorrected and O-MAR corrected images of those plugs (#4, #6, #7, and #12) was only 6.1 HU, and there was no difference in the conspicuities of those plugs. As shown in panels (c) and (d), the noise difference for the muscle-equivalent plug #15 was improved from 679% to 23% with the absolute CT Hounsfield number improving from 86.5 to 13.7 HU, as compared to the ground truth of 11.1 HU. Similar magnitudes of improvement were observed for the trabecular bone equivalent plug #9 and liver-equivalent plug #13.
Figure 2.
Comparisons of CT Hounsfield number differences and noise differences between either the uncorrected bilateral metal contaminated or the O-MAR corrected images and the ground truth data. CT Hounsfield number differences compared to the ground truth: (a) Before O-MAR correction and (b) After O-MAR correction. Noise (standard deviation) differences compared to the ground truth: (c) Before O-MAR correction and (d) After O-MAR correction.
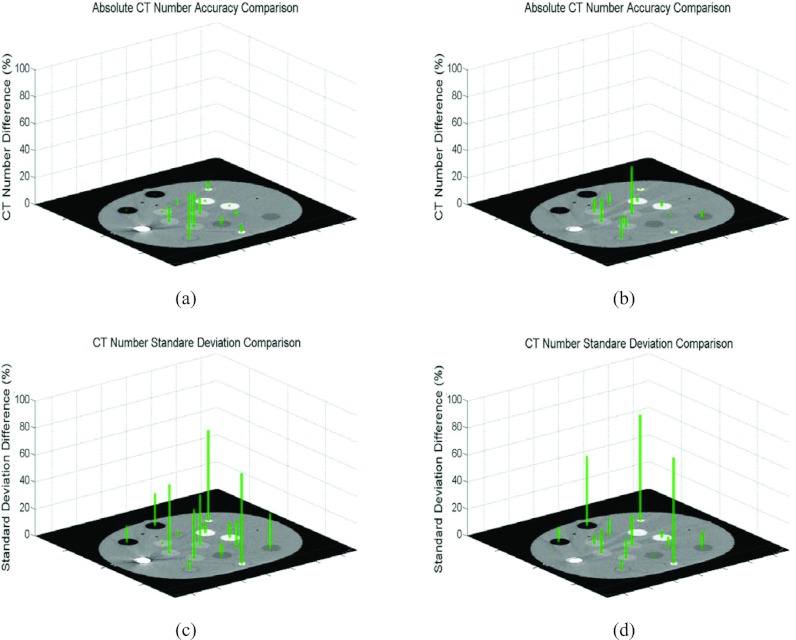
Figure 3 displays the results from unilateral metal implant simulations. Although the metal artifacts were not as severe as those due to bilateral implants, improvements in CT Hounsfield number and noise using O-MAR were still evident for the artifact regions.
Figure 3.
Comparisons of CT Hounsfield number and noise differences between either the uncorrected unilateral metal implant contaminated images or the O-MAR corrected images and the ground truth data. CT Hounsfield number differences compared to the ground truth: (a) Before O-MAR correction and (b) After O-MAR correction. Noise (standard deviation) differences compared to ground truth: (c) Before O-MAR correction and (d) After O-MAR correction.
Dosimetric comparison on phantom study
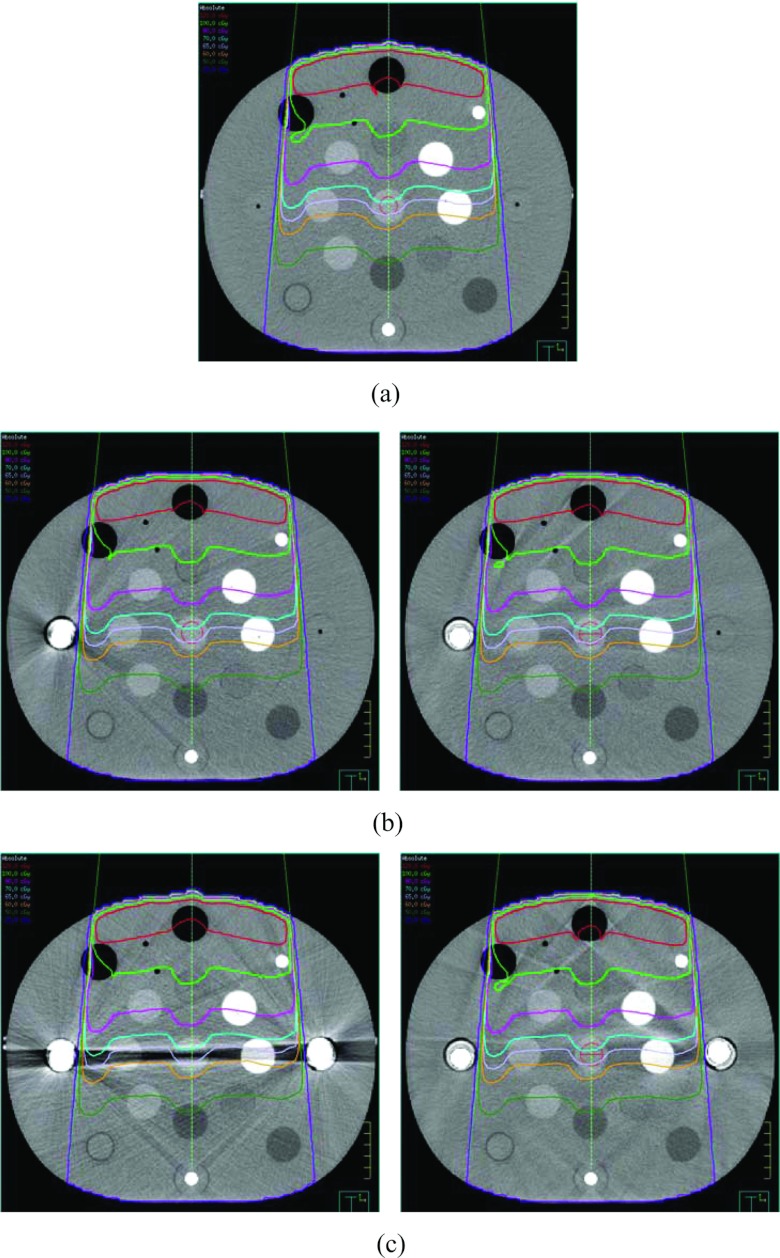
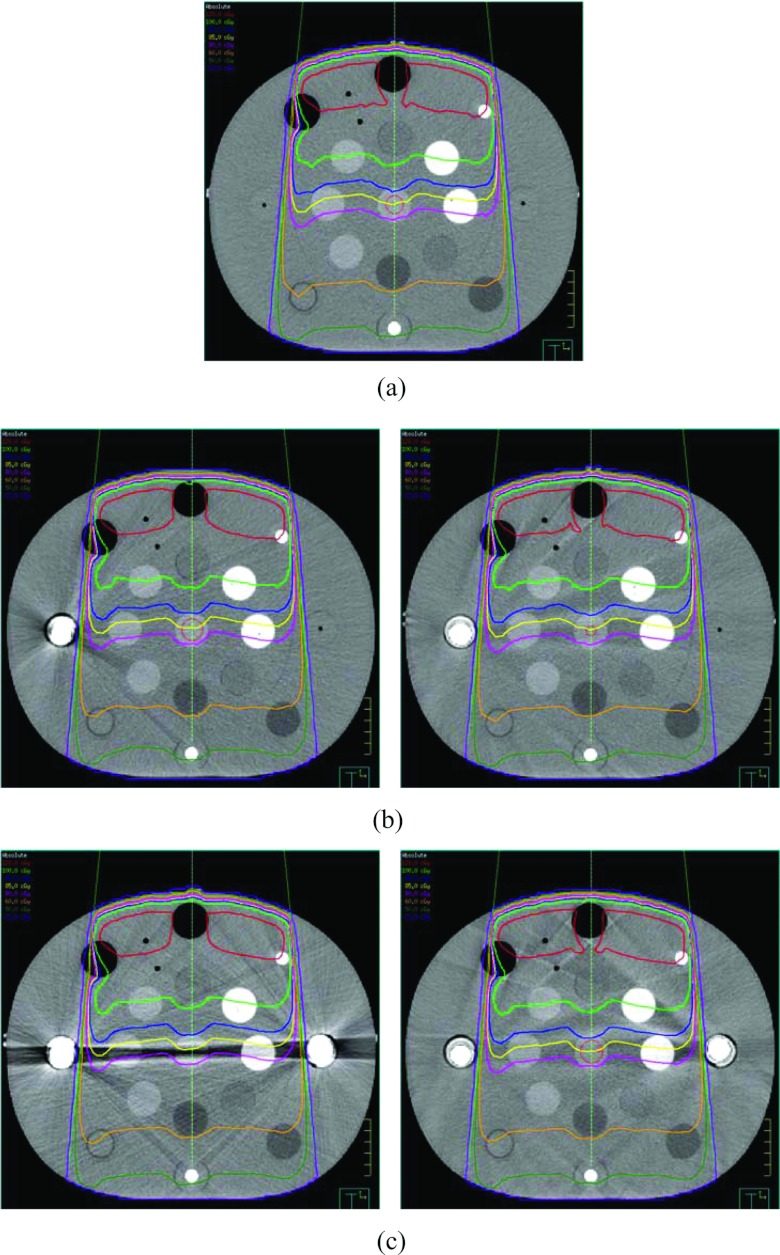
Figure 4 displays the dose distributions of the 6 MV 10 × 10 cm2 field (described in Sec. 2B3) computed on the ground truth image, the uncorrected metal contaminated images with either single or bilateral implants, and the corresponding O-MAR corrected images. Detailed isodose lines (120, 100, 80, 70, 65, 60, 50, and 20 cGy) are shown for the regions on the isocenter plane with severe metal artifacts. The maximum dose was approximately 133 cGy. The computed dose distributions appeared very similar, even in the regions with severe metal artifacts.
Figure 4.
Comparisons of dose distributions for a single 6 MV 10 × 10 cm2 field calculated on (a) the ground truth image, (b) the image with single hip implant and the O-MAR corrected image, and (c) the image with bilateral hip implant and the O-MAR corrected image. The prescription dose is 100 MU. The image display window width is 400 HU, and window level is 800 HU.
Figure 5 displays the dose distributions computed on the ground truth image, the original metal contaminated images with either single or bilateral implants, and the O-MAR corrected images for an 18 MV 10 × 10 cm2 field. The absolute isodose lines shown in Fig. 5 are 120, 100, 90, 85, 80, 60, 50, and 20 cGy from top to bottom. The maximum dose of those distributions was approximately 131 cGy. As with the 6 MV plan, the computed dose distributions appeared very similar, even in the regions with severe metal artifacts.
Figure 5.
Comparisons of dose distributions for a single 18 MV 10 × 10 cm2 field calculated on (a) the ground truth image, (b) the image with single hip implant and the O-MAR corrected image, and (c) the image with bilateral hip implant and the O-MAR corrected image. The prescription dose is 100 MU. The image display window width is 400 HU, and window level is 800 HU.
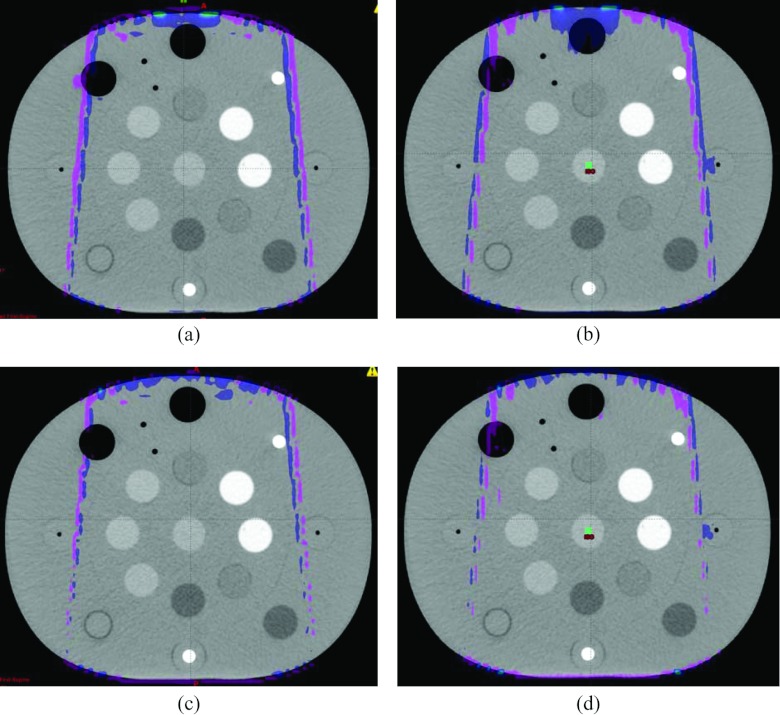
The absolute dose differences of 3D dose distributions on the ground truth image, the original bilateral metal implant image, and the O-MAR corrected image were also compared. Figure 6 shows the absolute dose distribution differences. The color meshes illustrate the regions with a dose difference of more than 1.3 cGy, which is approximately 1% of the maximum dose for each beam. It is evident that these regions were only present at the beam edge, either at the buildup or penumbral regions. The γ pass rates of those dose distribution pairs were greater than 99.9% even when using 1% and 3 mm criteria, suggesting that the dose distributions computed on the uncorrected and O-MAR corrected datasets could be considered clinically equivalent. The similar result was obtained on the unilateral metal implant case.
Figure 6.
The dose distribution differences for (a) a 6 MV 10 × 10 cm2 field and (b) an 18 MV 10 × 10 cm2 field computed based on the ground truth image and the original uncorrected image, and for (c) a 6 MV 10 × 10 cm2 field and (d) an 18 MV 10 × 10 cm2 field computed based on the ground truth image and the O-MAR corrected image with bilateral metal implants. The meshes show the regions with a dose difference more than 1% of the maximum dose. The image display window width is 400 HU, and window level is 0 HU.
CT Hounsfield number accuracy improvement on the clinical patient study
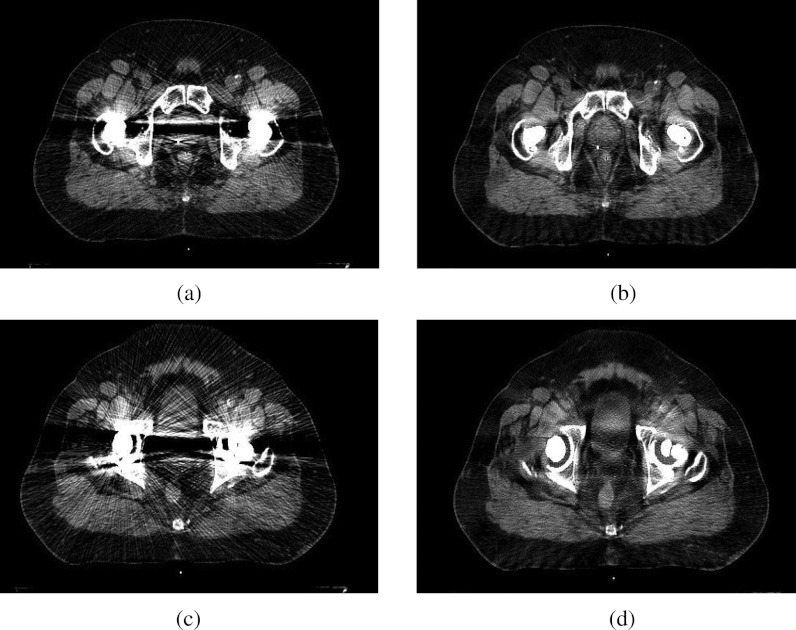
While residual artifacts remained in the corrected images, the metal artifacts were dramatically reduced on all ten patient cases, especially for patient cases with large bilateral hip prostheses. The overall image quality and the visual conspicuity in critical organs were significantly improved compared with the uncorrected images: overall quality (1.35 vs 3.25, P = 0.0022); bladder (2.15 vs 3.7, P = 0.0023); prostate and seminal vesicles/vagina (1.3 vs 3.275, P = 0.0020); rectum (2.8 vs 3.9, P = 0.0021). In all ten cases, the radiation oncologists reported preference for the O-MAR corrected images, and a clear improvement in the delineation of both targets and nearby tissues that were affected by metal artifacts. The geometries of the anatomic structures were not distorted by the O-MAR algorithm in any of the cases. Figure 7 shows a patient case with bilateral hip implants where an obscured prostate became visible after the O-MAR correction.
Figure 7.
Metal artifact reduction for two different axial planes on a patient case with bilateral metal hip implants. The image display window width is 400 HU, and window level is 800 HU. (a) Before O-MAR correction. (b) After O-MAR correction. (c) Before O-MAR correction. (d) After O-MAR correction.
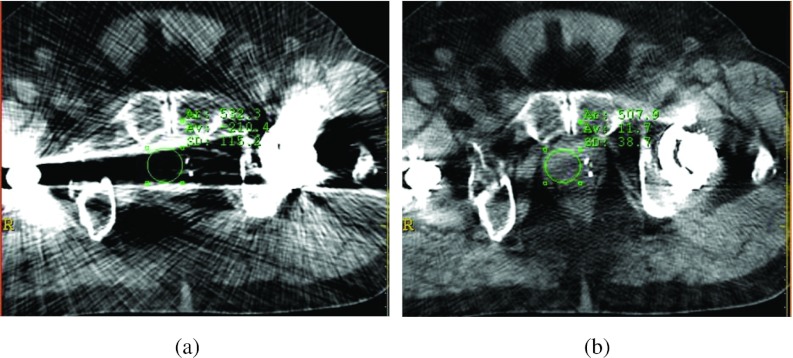
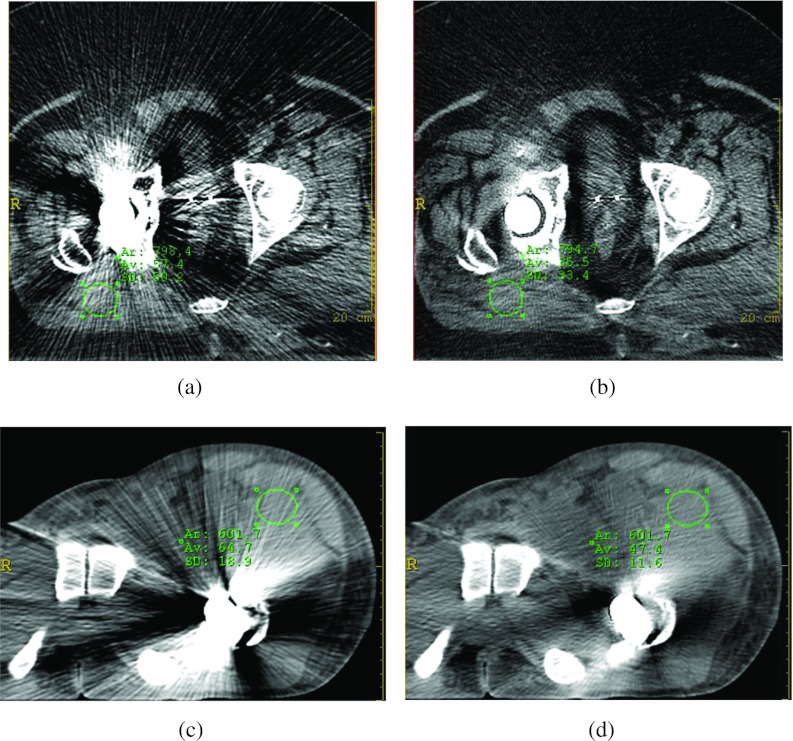
In the ten patient cases, the average noise levels in the prostate (or vagina) regions were reduced from 93.7 to 38.2 HU. In most cases (8/10), the average CT Hounsfield numbers of the prostate/vagina in the O-MAR corrected images were closer to the referenced values (41.2 HU, measured from patients without metal implants) than those in the uncorrected images. Of the remaining two cases, the CT Hounsfield numbers of the prostate were 31.1 and 34.5 HU in the O-MAR corrected images and 50 and 47 HU in the original uncorrected images. Thus, the absolute differences from the reference value (41.2 HU) were approximately 1 HU higher in the corrected images. As an example, Fig. 8 shows the CT Hounsfield number accuracy and noise improvement for a patient with bilateral hip implants. After correction, the average CT Hounsfield numbers of the ROI within the prostate (green circle) before and after correction were 210.4 HU and 11.7 HU, respectively. The corrected image exhibited CT Hounsfield number much closer to the reference prostate CT Hounsfield number 41.2 HU. The noise levels were reduced from 115.2 to 38.7 HU.
Figure 8.
Improvement of CT Hounsfield number accuracy and noise for a patient with bilateral hip implants after metal artifact reduction. The image display window width is 400 HU, and window level is 800 HU. (a) Before O-MAR correction ROI CT number = −210.4 HU, σ = 115.2 HU. (b) After O-MAR correction ROI CT number = 11.7 HU, σ = 38.7 HU.
In addition to improving the visual conspicuity improvement of the prostate, the visual conspicuity of the soft tissues contaminated by the metal artifact was also greatly improved. Figure 9 shows the results from two patient cases with unilateral hip implants. As shown by the ROIs in Figs. 9a, 9b, the noise levels were reduced from 50.2 to 33.4 HU after correction. As shown in Figs. 9c, 9d, the noise levels were reduced from 18.9 to 11.6 HU after correction.
Figure 9.
Improvement of CT Hounsfield number accuracy and noise on two patient cases with unilateral hip implants after metal artifact reduction. The image display window width is 400 HU, and window level is 800 HU. (a) Before O-MAR correction ROI CT number = 57.4 HU, σ = 50.2 HU. (b) After O-MAR correction ROI CT number = 35.5 HU, σ = 33.4 HU. (c) Before O-MAR correction ROI CT number = 64.7 HU, σ = 18.9 HU. (d) After O-MAR correction ROI CT number = 47.4 HU, σ = 11.6 HU.
Dosimetric comparison on patient cases
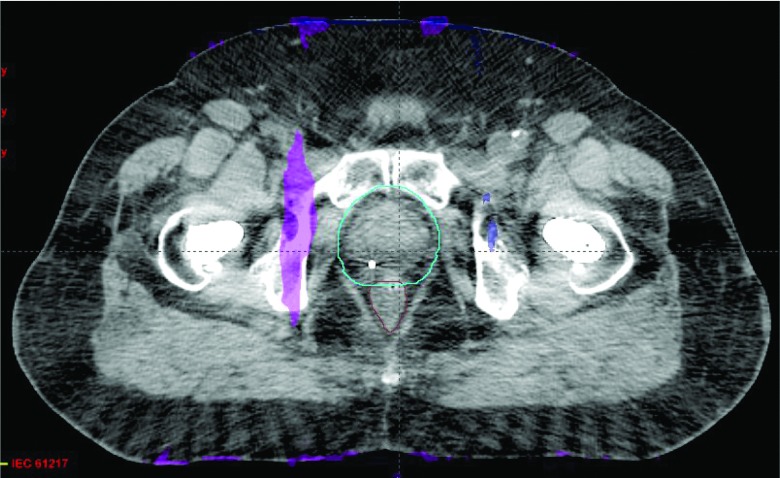
Figure 10 shows a single hip implant patient case with 45 Gy prescription dose to the prostate in 25 fractions. The maximum doses of the distributions were 50.7 and 50.8 Gy, when using the uncorrected and corrected images, respectively. A color mesh overlay is used to show regions where the dose differences are greater than 3% of the prescription dose. Similar to the phantom study, these regions were near the body boundary where dose calculation uncertainty was the largest. The γ pass rate was 99.8% using 1%/3 mm criteria. These two plans were, therefore, clinically equivalent.
Figure 10.
Comparison of IMRT treatment plans calculated on the uncorrected and O-MAR corrected images for a unilateral hip implant patient case. The mesh indicates regions that have absolute dose differences greater than 3% of the prescription dose. The image display window width is 400 HU, and window level is 0 HU.
Figure 11 shows another IMRT plan from another patient with bilateral hip implants. The prescription dose was 50 Gy to the prostate in 25 fractions. The maximum doses from the uncorrected and O-MAR corrected images were the same at approximately 56.3 Gy. A color mesh overlay is used to show regions where the dose differences were greater than 3% of the prescription dose. Similar to the case shown in Fig. 10, these regions were located mostly peripherally due to the larger calculation uncertainty. The dose difference on the color mesh region adjacent to the prostate was approximately 200 cGy, which was slightly greater than 3% of the 50 Gy prescription dose. The γ pass rate was over 99.9% using the 3%/3 mm criteria. These two plans were considered clinically equivalent. Overall, all of the five patient cases evaluated were found to be clinically equivalent, with γ pass rates greater than 99.9% using the 3%/3 mm criteria, and greater than 99.74% using the 1%/3 mm criteria.
Figure 11.
Comparison of IMRT treatment plans calculated on the uncorrected and O-MAR corrected images for a bilateral hip implant patient case. The mesh regions indicate an absolute dose difference greater than 3% of the prescription dose. The image display window width is 400 HU, and window level is 0 HU.
DISCUSSION
This paper provided an experimental and clinical evaluation of the first commercially available orthopedic metal artifact reduction algorithm for CT simulations in radiation therapy. As a commercialized tool, this projection interpolation-based O-MAR algorithm does not require user interaction and parameter chosen. The fast computation speed makes it clinical inline acceptable. It takes about 30 s for a routine helical CT scan reconstruction. It works robustly for all the evaluated clinical cases with large metal implants and currently is used in our clinic. However, we also noticed that this algorithm works better on single hip implant cases than on bilateral hip implant cases, and residual artifacts still exist in the corrected images. The O-MAR algorithm should be used appropriately based on Philips’ recommendations that it is not suitable for processing stents, external metals, implanted devices near skin surface, metals near air pockets, and surgical screws or clips due to an unforeseen consequence where the O-MAR algorithm may induce some abnormalities in the corrected images.
The study illustrated that the O-MAR corrected CT datasets can provide better conspicuity of the anatomical structures (and critical organs) than the original uncorrected images for patient cases with large hip implants. The evaluation also indicated that, as expected, the anatomic structure geometries were not affected by the algorithm. While residual artifacts were still present in the corrected images, the artifacts were dramatically reduced for the studied patient cases, especially for patients with large bilateral hip prostheses. There are two potential sources for the residual artifacts in the O-MAR corrected images. First, the metal projection data extraction and correction process could be imperfect, causing data inconsistency between the corrected metal implant projections at different view angles, and data inconsistency between the corrected metal regions and the surrounding soft tissue for a single projection. Second, x-ray photon scattering due to the high density metal implants is still present. The metal artifact correction algorithm can only correct the metal projection itself, and might reduce, but cannot eliminate the scattering caused by metal implants because the scattering spreads throughout the projection space. Also, the imperfect correction model might induce some new minor artifacts although not with the same severity as those original artifacts caused by the data inconsistency between the model and the dense metal implant. As such, the traditional beam hardening correction might not provide optimal results, thereby causing the residual artifacts.
The primary advantage of employing the O-MAR function lies in the improvement of critical structure visual conspicuity. As shown in Fig. 7, the prostate boundary changes from obscured to visible. Without using the algorithm, segmentation would be less confident and treatment planning accuracy could be jeopardized. Figures 89 show that the soft tissue visual conspicuity was also greatly improved, in addition to the visual conspicuity improvement of prostate. The O-MAR corrected images allow dosimetrists to arrange beams more flexibly without the constraint of not using a beam that traverses the severely contaminated regions before hitting the target.
The use of O-MAR corrected images makes the use of MVCT image for structure delineation unnecessary. In this study, we did not make comparisons against MVCT datasets. Although MVCT has been recently proposed as an alternative, a comprehensive evaluation of this technique is lacking in the literature. Furthermore, any positional changes of the patient between the kilovoltage-CT and MVCT simulations may complicate the comparison between dose distributions.
CT simulation-based dosimetry calculation relies on the accuracy of CT Hounsfield numbers, which in turn determines the 3D electron density maps relative to water. The study illustrated that there was a remarkable improvement in CT Hounsfield number accuracy and reduction of noise for both phantom and patient studies. As shown in Fig. 8, the average CT Hounsfield number within the prostate region was improved from −210 to 11.7 HU. However, it was found that for all phantom and patient cases, the dose distribution differences were mostly within 1% (at most 3%) of the prescription dose, and were therefore considered as dosimetric equivalent no matter which CT image dataset was used for dose computation. This finding can be explained by the Compton interaction of megavoltage therapeutic beams with human body tissues. As well known in radiation treatment planning, the attenuation of a megavoltage beam in water is less than 3% per cm penetration, which is much less than that of a kilovoltage beam.38 In this study, the maximum uncertainty in average CT Hounsfield number determination based on the O-MAR corrected image and that within the water overridden region in the original uncorrected image was less than 100 HU, which translates to a 1 mm uncertainty per cm depth. Without loss of generality, we can assume that a contaminated region has a size of less than 5 cm, the uncertainly in depth determination is, therefore, less than 0.5 cm, and it results in a dose calculation uncertainty of 3%/cm × 0.5 cm = 1.5% at most. As such, the dose distributions are considered as dosimetric equivalent no matter which CT image dataset was used for dose computation.
Nevertheless, the importance of structure delineation and its impact on dosimetry should not be disregarded. It is primarily for that reason that we recommend using the O-MAR corrected image for treatment planning. It is evident that the O-MAR corrected images provide better target and critical structure conspicuity and are more convenient to use during the treatment planning process. Moreover, the need to override the metal artifact regions on the uncorrected images with density of water for planning, which is subjective and time consuming, is eliminated. We do not suggest that the metal regions should be ignored when setting up the beams, due to the greater backscatter and rebuild up of electronic equilibrium caused by the metal implants. The greater beam attenuation by the high density metal implants may also cause larger dose plan calculation errors. If for some specific cases, the corrections on the regions close to the metal implant are not satisfactory (for example, the CT Hounsfield number are largely distorted), we would suggest using density overridden for dose distribution calculation.
Occasionally, we treated head and neck cancer patients with larger shoulder metal implants. As such, two patient cases were also processed with the O-MAR function and evaluated on artifact reduction and dosimetric difference. The same results were concluded: metal artifacts were reduced dramatically and dosimetric differences were considered as clinically negligible. This suggests that the O-MAR algorithm might be useful for enhanced visualization of anatomy in the head and neck that has been degraded by metal artifacts from shoulder implants. There may be other possible uses of the O-MAR algorithm beyond hip prosthesis, although Philips recommends that the O-MAR function is suitable for the reduction of metal artifact caused by large orthopedic metal implants, not small metal implants. In future work, it would be of interest to investigate the application of the O-MAR function on small metal implants that compromise visualization of anatomical structures, such as dental fillings and spine screws, and analysis its effect on treatment planning.
CONCLUSION
The study indicated that the O-MAR algorithm can significantly reduce metal artifacts on treatment planning CT images, which enables better anatomical structure visualization. We found that the most important benefit of this function is that it can improve radiation oncologists’ confidence in target delineation during treatment planning and position localization. Dosimetric improvement did not seem to be a benefit, as corrected and uncorrected were found to be dosimetrically similar in all cases. We suggest that O-MAR correction image can be used safely and effectively for radiation treatment planning for patients with large orthopedic metal implants.
Table 1.
Physical density and electron density of each inserted plug shown in Fig. 1b.
| Physical density | Electron density | ||
|---|---|---|---|
| Label # | Inserts | (g/cm3) | (1023e/g) |
| 1 and 2 | Lung inhale | 0.2 | 0.634 |
| 3 and 5 | Dense bone | 1.53 | 4.862 |
| 4 and 11 | Adipose | 0.96 | 3.170 |
| 6 | Water syringe | 1.0 | 3.340 |
| 7 and 10 | Breast | 0.99 | 3.261 |
| 8 and 9 | Trabecular bone | 1.16 | 3.730 |
| 12 and 15 | Muscle | 1.06 | 3.483 |
| 13 and 14 | Liver | 1.07 | 3.516 |
ACKNOWLEDGMENTS
The authors received no financial support from Philips Healthcare for conducting this research. The authors would like to thank Dr. Lifeng Yu at Mayo Clinic for valuable and helpful discussions, and also thank the anonymous reviewers for valuable comments and suggestions. They would also like to thank the Department of Orthopedics at the Washington University in Saint Louis for proving the sample metal implants for the phantom study in this paper. One of the authors, Camille Noel, was supported by the Washington University Institute of Clinical and Translational Sciences Grant UL1 TR000448, sub award TL1 TR000449, from the National Center for Advancing Translational Sciences. The paper content is solely the responsibility of the authors and does not necessarily represent the official views of the NIH.
References
- Li H., Yu L., Liu X., Fletcher J. G., and McCollough C. H., “Metal artifact suppression from reformatted projections in multislice helical CT using dual-front active contours,” Med. Phys. 37(10), 5155–5164 (2010). 10.1118/1.3462814 [DOI] [PubMed] [Google Scholar]
- De Man B., Nuyts J., Dupont P., Marchal G., and Suetens P., “Reduction of metal streak artifacts in x-ray computed tomography using a transmission maximum a posteriori algorithm,” IEEE Trans. Nucl. Sci. 47(3), 977–981 (2000). 10.1109/23.856534 [DOI] [Google Scholar]
- Wang G., Snyder D. L., O’Sullivan J. A., and Vannier M. W., “Iterative deblurring for CT metal artifact reduction,” IEEE Trans. Med. Imaging 15(5), 657–664 (1996). 10.1109/42.538943 [DOI] [PubMed] [Google Scholar]
- Bal M. and Spies L., “Metal artifact reduction in CT using tissue-class modeling and adaptive prefiltering,” Med. Phys. 33(8), 2852–2859 (2006). 10.1118/1.2218062 [DOI] [PubMed] [Google Scholar]
- Kalender W. A., Hebel R., and Ebersberger J., “Reduction of CT artifacts caused by metallic implants,” Radiology 164(2), 576–577 (1987). [DOI] [PubMed] [Google Scholar]
- Watzke O. and Kalender W. A., “A pragmatic approach to metal artifact reduction in CT: Merging of metal artifact reduced images,” Eur. Radiol. 14(5), 849–856 (2004). 10.1007/s00330-004-2263-y [DOI] [PubMed] [Google Scholar]
- Yazdia M., Gingras L., and Beaulieu L., “An adaptive approach to metal artifact reduction in helical computed tomography for radiation therapy treatment planning: Experimental and clinical studies,” Int. J. Radiat. Oncol. Biol., Phys. 62(4), 1224–1231 (2005). 10.1016/j.ijrobp.2005.02.052 [DOI] [PubMed] [Google Scholar]
- Yu H. et al. , “A segmentation-based method for metal artifact reduction,” Acad. Radiol. 14(4), 495–504 (2007). 10.1016/j.acra.2006.12.015 [DOI] [PMC free article] [PubMed] [Google Scholar]
- Wang G., Frei T., and Vannier M. W., “Fast iterative algorithm for metal artifact reduction in x-ray CT,” Acad. Radiol. 7(8), 607–614 (2000). 10.1016/S1076-6332(00)80576-0 [DOI] [PubMed] [Google Scholar]
- Yu L., Li H., Muller J., Kofler J. M., Liu X., Primak A. N., Fletcher J. G., Guimaraes L. S., Macedo T., and McCollough C. H., “Metal artifact reduction from reformatted projections in multi-slice Helical CT: Techniques and initial clinical results,” Invest. Radiol. 44(11), 691–696 (2009). 10.1097/RLI.0b013e3181b0a2f9 [DOI] [PMC free article] [PubMed] [Google Scholar]
- Zhang Y., Zhang L., Zhu X. R., Lee A. K., Chambers M., and Dong L., “Reducing metal artifacts in cone-beam CT images by preprocessing projection data,” Int. J. Radiat. Oncol., Biol., Phys. 67(3), 924–932 (2007). 10.1016/j.ijrobp.2006.09.045 [DOI] [PubMed] [Google Scholar]
- Zhao S., Robertson D. D., Wang G., Whiting B., and Bae K. T., “X-ray CT metal artifact reduction using wavelets: An application for imaging total hip prostheses,” IEEE Trans. Med. Imaging 19(12), 1238–1247 (2000). 10.1109/42.897816 [DOI] [PubMed] [Google Scholar]
- Zhang X., Wang J., and Xing L., “Metal artifact reduction in x-ray computed tomography (CT) by constrained optimization,” Med. Phys. 38(2), 701–711 (2011). 10.1118/1.3533711 [DOI] [PMC free article] [PubMed] [Google Scholar]
- Xu C., Verhaegen F., Laurendeau D., Enger S. A., and Beaulieu L., “An algorithm for efficient metal artifact reductions in permanent seed,” Med. Phys. 38(1), 47–56 (2011). 10.1118/1.3519988 [DOI] [PubMed] [Google Scholar]
- Bamberg F., Dierks A., Nikolaou K., Reiser M. F., Becker C. R., and Johnson T. R., “Metal artifact reduction by dual energy computed tomography using monoenergetic extrapolation,” Eur. Radiol. 21(7), 1424–1429 (2011). 10.1007/s00330-011-2062-1 [DOI] [PubMed] [Google Scholar]
- Naranjo V., Llorens R., Alcaniz M., and Lopez-Mir F., “Metal artifact reduction in dental CT images using polar mathematical morphology,” Comput. Methods Programs Biomed. 102(1), 64–74 (2011). 10.1016/j.cmpb.2010.11.009 [DOI] [PubMed] [Google Scholar]
- Joemai R. M., de Bruin P. W., Veldkamp W. J., and Geleijns J., “Metal artifact reduction for CT: Development, implementation, and clinical comparison of a generic and a scanner-specific technique,” Med. Phys. 39(2), 1125–1132 (2012). 10.1118/1.3679863 [DOI] [PubMed] [Google Scholar]
- Meyer E., Raupach R., Lell M., Schmidt B., and Kachelriess M., “Normalized metal artifact reduction (NMAR) in computed tomography,” Med. Phys. 37(10), 5482–5493 (2010). 10.1118/1.3484090 [DOI] [PubMed] [Google Scholar]
- Meyer E., Raupach R., Lell M., Schmidt B., and Kachelriess M., “Frequency split metal artifact reduction (FSMAR) in computed tomography,” Med. Phys. 39(4), 1904–1916 (2012). 10.1118/1.3691902 [DOI] [PubMed] [Google Scholar]
- Prell D., Kyriakou Y., Kachelrie M., and Kalender W. A., “Reducing metal artifacts in computed tomography caused by hip endoprostheses using a physics-based approach,” Invest. Radiol. 45(11), 747–754 (2010). 10.1097/RLI.0b013e3181e94384 [DOI] [PubMed] [Google Scholar]
- Veldkamp W. J., Joemai R. M., van der Molen A. J., and Geleijns J., “Development and validation of segmentation and interpolation techniques in sinograms for metal artifact suppression in CT,” Med. Phys. 37(2), 620–628 (2010). 10.1118/1.3276777 [DOI] [PubMed] [Google Scholar]
- Prell D., Kyriakou Y., Beister M., and Kalender W. A., “A novel forward projection-based metal artifact reduction method for flat-detector computed tomography,” Phys. Med. Biol. 54(21), 6575–6591 (2009). 10.1088/0031-9155/54/21/009 [DOI] [PubMed] [Google Scholar]
- Lemmens C., Faul D., and Nuyts J., “Suppression of metal artifacts in CT using a reconstruction procedure that combines MAP and projection completion,” IEEE Trans. Med. Imaging 28(2), 250–260 (2009). 10.1109/TMI.2008.929103 [DOI] [PubMed] [Google Scholar]
- Lewitt R. M. and Bates R. H. T., “Image reconstruction from projections: III. Projection completion methods,” Optik 50, 189–204 (1978). [Google Scholar]
- Mahnken A. H. et al. , “A new algorithm for metal artifact reduction in computed tomography: In vitro and in vivo evaluation after total hip replacement,” Invest. Radiol. 38(12), 769–775 (2003). 10.1097/01.rli.0000086495.96457.54 [DOI] [PubMed] [Google Scholar]
- Zhang Y.,Pu Y. F., Hu J. R., Liu Y., Chen Q. L., and Zhou J. L., “Efficient CT metal artifact reduction based on fractional-order curvature diffusion,” Comput. Math. Methods Med. 2011, 173748 (2011). 10.1155/2011/173748 [DOI] [PMC free article] [PubMed] [Google Scholar]
- Meilinger M., Schmidgunst C., Schutz O., and Lang E. W., “Metal artifact reduction in cone beam computed tomography using forward projected reconstruction information,” Z. Med. Phys. 21(3), 174–182 (2011). 10.1016/j.zemedi.2011.03.002 [DOI] [PubMed] [Google Scholar]
- Yazdi M., Lari M. A., Bernier G., and Beaulieu L., “An opposite view data replacement approach for reducing artifacts due to metallic dental objects,” Med. Phys. 38(4), 2275–2281 (2011). 10.1118/1.3566016 [DOI] [PubMed] [Google Scholar]
- Abelson J. A. et al. , “Evaluation of a metal artifact reduction technique in tonsillar cancer delineation,” Pract. Radiat. Oncol. 2(1), 27–34 (2012). 10.1016/j.prro.2011.06.004 [DOI] [PubMed] [Google Scholar]
- Ay M. R., Mehranian A., Abdoli M., Ghafarian P., and Zaidi H., “Qualitative and quantitative assessment of metal artifacts arising from implantable cardiac pacing devices in oncological PET/CT studies: A phantom study,” Mol. Imaging Biol. 13(6), 1077–1087 (2010). 10.1007/s11307-010-0467-x [DOI] [PubMed] [Google Scholar]
- Beohar N. et al. , “Quantitative assessment of in-stent dimensions: A comparison of 64 and 16 detector multislice computed tomography to intravascular ultrasound,” Cathet Cardiovasc. Interv. 68(1), 8–10 (2006). 10.1002/ccd.20786 [DOI] [PubMed] [Google Scholar]
- Boas F. E. and Fleischmann D., “Evaluation of two iterative techniques for reducing metal artifacts in computed tomography,” Radiology 259(3), 894–902 (2011). 10.1148/radiol.11101782 [DOI] [PubMed] [Google Scholar]
- Kratz B., Ens S., Muller J., and Buzug T. M., “Reference-free ground truth metric for metal artifact evaluation in CT images,” Med. Phys. 38(7), 4321–4328 (2011). 10.1118/1.3603198 [DOI] [PubMed] [Google Scholar]
- See http://www.revisionrads.com/index.html for ReVision Radiology Metal Artifact Reduction Tool.
- Metal Artifact Reduction for Orthopedic Implants (O-MAR). Philips HealthCare System 2012. [available URL: http://clinical.netforum.healthcare.philips.com/us_en/Explore/White-Papers/CT/Metal-Artifact-Reduction-for-Orthopedic-Implants-(O-MAR)].
- Low D. A., Harms W. B., Mutic S., and Purdy J. A., “A technique for the quantitative evaluation of dose distributions,” Med. Phys. 25(5), 656–661 (1998). 10.1118/1.598248 [DOI] [PubMed] [Google Scholar]
- Low D. A. and Dempsey J. F., “Evaluation of the gamma dose distribution comparison method,” Med. Phys. 30(9), 2455–2464 (2003). 10.1118/1.1598711 [DOI] [PubMed] [Google Scholar]
- Khan F. M., The Physics of Radiation Therapy, 4th ed. (Lippincott Williams & Wilkins, Philadelphia, PA, 2009). [Google Scholar]


