Abstract
LTQ Orbitrap data analyzed with ProteinPilot can be further improved by MaxQuant raw data processing, which utilizes precursor-level high mass accuracy data for peak processing and MGF creation. In particular, ProteinPilot results from MaxQuant-processed peaklists for Orbitrap data sets resulted in improved spectral utilization due to an improved peaklist quality with higher precision and high precursor mass accuracy (HPMA). The output and postsearch analysis tools of both workflows were utilized for previously unexplored features of a three-dimensional fractionated and hexapeptide library (ProteoMiner) treated whole saliva data set comprising 200 fractions. ProteinPilot’s ability to simultaneously predict multiple modifications showed an advantage from ProteoMiner treatment for modified peptide identification. We demonstrate that complementary approaches in the analysis pipeline provide comprehensive results for the whole saliva data set acquired on an LTQ Orbitrap. Overall our results establish a workflow for improved protein identification from high mass accuracy data.
Keywords: Bioinformatics, Combined workflows, Descriptive statistics, High precursor mass accuracy and peaklist quality
With developments in mass spectrometry and bioinformatic tools, the boundaries of proteomic characterization have expanded and now encompass accurate identification of proteins, quantification, PTMs, pathway analysis. Comprehensive proteomic analysis and generation of additional relevant biological information is a desirable yet challenging goal in proteomics research.
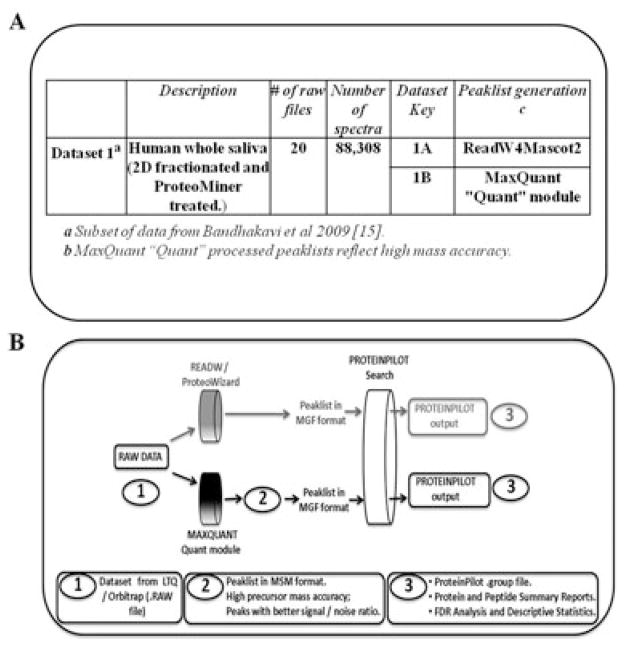
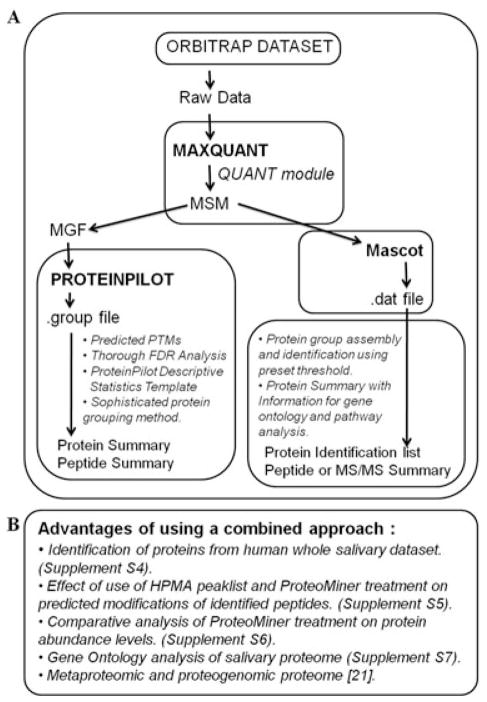
A new generation of mass spectrometers with high sensitivity, resolving power and mass accuracy coupled with elaborate fractionation methods afford deep exploration into proteomes [1]. LTQ Orbitrap MS, an example amongst many such mass spectrometers, can measure precursor m/z values with high precursor mass accuracy (HPMA) [2]. The advantages of HPMA to eliminate false positive peptide matches from database searches and facilitate the identification of amino acid substitutions and PTM assignments have been discussed extensively [3–7]. Despite the Orbitrap’s ability to generate HPMA data, mass measurement errors might originate from sources such as power supply voltage drift, ion intensity variation, calibration coefficients deterioration [8], and incorrectly determined monoisotopic precursor peak. Software packages have been developed to utilize and further improve the benefits from HPMA [8]. For example, MaxQuant software was developed to yield confident identifications from Orbitrap data sets [9,10]. The salient features of MaxQuant and the details of intervening steps for raw data conversion are discussed elsewhere [10; http://mediamill.cla.umn.edu/mediamill/display/61929]. Most importantly, MaxQuant’s processing of RAW data improves precursor mass measurement precision by using multiple precursor mass measurements and their weighted average to create peaklists with more accurate precursor mass (PEPMASS) values. Another software, ProteinPilot [11] also utilizes HPMA data and performs automatic recalibration to improve results and can simultaneously identify PTMs and nontryptic cleavages. We hypothesized that a combination of MaxQuant and ProteinPilot provides a more complete list of proteins than results from a single program. The hypothesis was tested with a subset salivary data set generated using dynamic range compression via hexapeptide libraries (ProteoMiner™, Bio-Rad Laboratories, Hercules, CA, USA) and an LTQ Orbitrap XL mass spectrometer as described [12] (Fig. 1A). ProteinPilot results after database search with input files generated with MaxQuant were compared to results from MGF input files generated with ReAdW4Mascot2 [13] as shown in Fig. 1B. For MaxQuant-generated input files, .RAW files were first converted to .MSM files with the MaxQuant “Quant” module and then the file extensions were changed to .MGF (Fig. 3A and see Supporting Information Fig. S12). The .MGF files thus generated from the distinct data conversion tools were searched using ProteinPilot v 4.0 against a human database (See Materials and Methods in Supporting Information Table S11).
Figure 1.
Overview of data set and workflow. (A) Data set for comparison of effect of HPMA in a data set using ProteinPilot. (B) Workflow for comparison of effect of HPMA in a data set using ProteinPilot.
Figure 3.
Combined MaxQuant and ProteinPilot workflow and results from saliva proteome analysis. (A) Combined workflow of MaxQuant and ProteinPilot software. (B) Features of salivary data set studied using MaxQuant-processed files and Mascot/ProteinPilot.
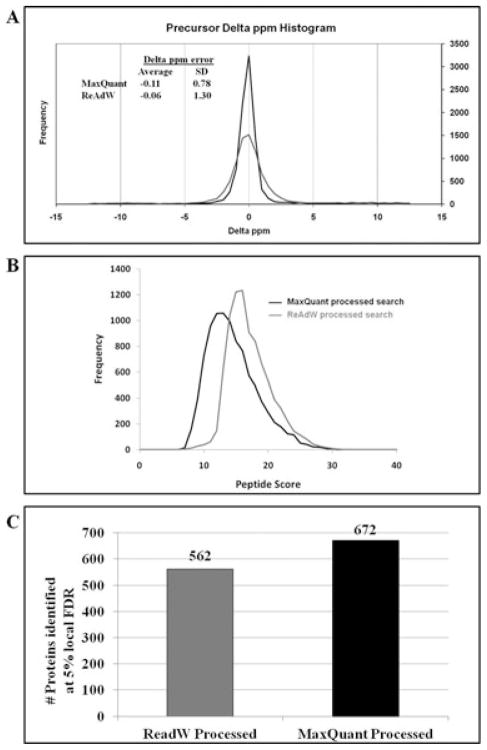
Data-specific metrics generated from ProteinPilot searches were generated with the ProteinPilot Descriptive Statistics Template (PDST) tool (See Supporting Information Tables S11, S16 to S18); metrics from each result set were compared. Comparison of peptide mass accuracy from the search results showed that for MaxQuant processed searches, the average delta error, which measures the degree of bias from mass drift, shows little change in either ppm or delta m/z space (Fig. 2A). This was expected because the automatic mass recalibration function in Paragon removes bias. However, the precision of the data as measured by standard deviation of observed precursor mass measurements improved significantly with MaxQuant-generated peak lists (Fig. 2A). As a result, more spectra were identified from MaxQuant-processed peaklists as compared to ReAdW-processed peaklists. The delta ppm error range is narrower for the MaxQuant-processed data when compared to the ReAdW-processed data, as shown by the histograms of precursor delta ppm distribution (Fig. 2A) and cumulative delta ppm distribution (Supporting Information Fig. S1C).
Figure 2.
ProteinPilot descriptive statistics for a salivary data set. (A) Mass Accuracy plots from ProteinPilot searches of MaxQuant processed and ReAdW-processed peaklists. The distribution of the frequency of spectra identified by ProteinPilot has been plotted against precursor Delta ppm. (B) Distributions of peptide and protein scores of confident identifications from ProteinPilot searches. The distributions of the frequency of spectra identified by ProteinPilot at 5% local FDR was plotted against peptide score (Sc). (C) Numbers of protein identifications from ProteinPilot for small human salivary data set (data set 1 in Figure 1B) at 5% local FDR. MGF files were created with ReAdW or MaxQuant. Similar observations were made for distinct peptides and spectral level data set (See Supporting Information Fig S1).
We also observed that the threshold at which MaxQuant eliminated product ion peaks from its generated peaklist was different from the threshold applied by the ReAdW tool. In MaxQuant, tandem MS data processing involves elimination of product ion peaks with intensities below the six most intense peaks within each successive 100 m/z interval [9,14]. As a result, high-intensity fragment ion peaks (including b and y-ions) are retained and low-intensity product ion peaks and potentially “spurious” noise peaks are eliminated from the final peaklists (Spectra in Supporting Information Fig. S2). The distribution of ProteinPilot peptide scores (Sc) shifted toward a lower value when input files were generated with MaxQuant, as compared to ReAdW processed peaklists (Fig. 2B). Thus, MaxQuant processing reduced peptide score distribution and eliminated “noise” peaks and potential incorrect ion fragment matches. A reduction in incorrect fragment ion matches most likely correlates with an increase in peptide match accuracy.
The HPMA and reduction in the number of product ion peaks in MaxQuant-processed peaklists, combined with MaxQuant’s ability to correctly identify precursor ion monoisotopic peaks and charge state from .RAW files [9], resulted in improved identification statistics (increases in spectral, distinct peptides, and protein identifications). For the subset of whole salivary data set, increases in spectral level and distinct peptide level identification statistics (Supporting Information Fig. S1 and Supporting Information Table S13) resulted in an improvement (19.6%) in protein-level identification (Fig. 2C) in MaxQuant-processed peaklist searches. Improvements in identification statistics as a result of MaxQuant peak processing for two more independently acquired data sets (Supporting Information Tables S8, S9, S14 and S15) were observed.
The previously reported whole saliva proteome was analyzed using Sequest and reported using Scaffold’s protein grouping method [12]. While several data set characteristics (such as effect of dynamic range compression; DRC) were analyzed in the original report, reanalysis of the reported data set plus additional fractions was performed. The effects of MaxQuant input file generation on ProteinPilot results were extended to a large data set (200 .RAW files; Supporting Information Tables S3 and S4).
A robust and comprehensive list of proteins (Supporting Information Table S19) was generated after analysis of whole saliva by combining MaxQuant’s ability to accurately process acquired peaks, and ProteinPilot’s ability to search multiple modifications and perform robust protein reporting (Fig. 3). MaxQuant analysis includes robust processing and filtering for peptide mass accuracy and FDR thresholds at protein and peptide level [10]. When the results from MaxQuant (2131 proteins; Supporting Information Table S20) and Protein-Pilot (2224 proteins; Supporting Information Table S19) were compared for the whole salivary sample, a substantial overlap (1956 proteins; 91.8%) in the proteins (identified at 1% global FDR) was observed. However, it is important to note that ProteinPilot and MaxQuant use different approaches for protein grouping. While MaxQuant uses a peptide-centric approach, ProteinPilot’s approach ensures that the identified spectrum is used only once for protein grouping and reports unambiguous protein detections [11,15]. In addition, Protein-Pilot workflow has recently introduced a method to achieve accurate protein confidence [16]. The method addresses the issue of influence of high-ranking proteins with higher spectral matches on lower ranking proteins at the tail end of the proteins list, which typically have fewer confident peptide identifications. The method has shown better protein identification and confidence accuracy in test and real samples as well as improved detection of low abundance proteins [16].
The HPMA nature of the MaxQuant processed peak lists, and benefits associated with our workflow were utilized to analyze previously unexplored features in the salivary data set. These included questions such as effect of DRC on abundance, spectral utilization, and PTM identification (Fig. 3B). As reported earlier, ProteoMiner treatment resulted in reduction in the relative amounts of highly abundant proteins, while increasing the relative amounts of low-abundance proteins [12]. In the current study, proteins that were either enriched or reduced after ProteoMiner treatment were identified using Scaffold analysis of MaxQuant-Mascot results (Supporting Information Fig. S6 and Supporting Information Table S21).
ProteinPilot’s ability to predict multiple peptide modifications was used in conjunction with the postsearch PDST tool to analyze the effect of DRC on relative ranking of the most frequently predicted modifications. ProteinPilot’s tag-based approach assigns “sequence temperature values” to the regions in a database. Feature probabilities such as unexpected cleavages, modifications, and delta mass values are used to match spectra to amino acid sequences [11]. As a result, ProteinPilot searches for hundreds of peptide modifications simultaneously. Searches of HPMA peaklists with ProteinPilot offered an advantage in PTM elucidation. In our analysis, modifications due to sample preparation or fractionation such as methylation, oxidation, and deamidation were observed. The relative ranking of most predicted modifications changed after ProteoMiner treatment. In particular, PTMs observed at medium and low occurrences were affected most in their ranking (Supporting Information Table S5), This observation is noteworthy, even for the study of native salivary sample.
In summary, the combination of improved precursor mass precision and accuracy, monoisotopic peak estimation, noise peak elimination, recalibration, and ability to search for multiple modifications in the described workflows offer a comprehensive coverage of biological information in data sets. We intend to utilize the benefits from the MaxQuant–ProteinPilot complementary workflow for multiple scenarios (1) searches against translated genomes in all six reading frames in order to identify novel spliced isoforms [17]; (2) metaproteomic studies [18]; and (3) focused efforts for PTM detection from enriched samples. We expect that similar workflows that creatively use combinations of proteomics software tools, such as the peak-processing ability of one tool and novel identification strategy and output of another, could be used for comprehensive analyses of large biological data sets.
Supplementary Material
Acknowledgments
This work was supported in part by National Institutes of Health (U.S.) Grant 1R01 DE17734 to T.J.G and Grant 1R01 AG20866 to E.A.A. The authors recognize the assistance from Dr. Birali Runesha and Dr. Nicholas Labello from Minnesota Supercomputing Institute. The authors also recognize the Center for Mass spectrometry and Proteomics (CMSP) at the University of Minnesota. Supporting agencies are listed in http://www.cbs.umn.edu/msp/about.shtml).
Abbreviations
- DRC
dynamic range compression
- FDR
false discovery rate
- HPMA
high precursor mass accuracy
- LTQ
linear trap quadrupole
- MGF
Mascot generic format
- PDST
ProteinPilot descriptive statistics template
Footnotes
The authors have declared no conflict of interest.
References
- 1.Yates JR, Ruse CI, Nakorchevsky A. Proteomics by mass spectrometry: approaches, advances, and applications. Annu Rev Biomed Eng. 2009;11:49–79. doi: 10.1146/annurev-bioeng-061008-124934. [DOI] [PubMed] [Google Scholar]
- 2.Scigelova M, Makarov A. Orbitrap mass analyzer–overview and applications in proteomics. Proteomics. 2006;6(Suppl S2):16–21. doi: 10.1002/pmic.200600528. [DOI] [PubMed] [Google Scholar]
- 3.Lu B, Motoyama A, Ruse C, Venable J, et al. Improving protein identification sensitivity by combining MS and MS/MS information for shotgun proteomics using LTQ-Orbitrap high mass accuracy data. Anal Chem. 2008;80:2018–2025. doi: 10.1021/ac701697w. [DOI] [PMC free article] [PubMed] [Google Scholar]
- 4.Mann M, Kelleher NL. Precision proteomics: the case for high resolution and high mass accuracy. Proc Natl Acad Sci USA. 2008;105:18132–18138. doi: 10.1073/pnas.0800788105. [DOI] [PMC free article] [PubMed] [Google Scholar]
- 5.Boyne MT, Garcia BA, Li M, Zamdborg L, et al. Tandem mass spectrometry with ultrahigh mass accuracy clarifies peptide identification by database retrieval. J Proteome Res. 2009;8:374–379. doi: 10.1021/pr800635m. [DOI] [PMC free article] [PubMed] [Google Scholar]
- 6.Zubarev R, Mann M. On the proper use of mass accuracy in proteomics. Mol Cell Proteomics. 2007;6:377–381. doi: 10.1074/mcp.M600380-MCP200. [DOI] [PubMed] [Google Scholar]
- 7.Cox J, Mann M. Computational principles of determining and improving mass precision and accuracy for proteome measurements in an Orbitrap. J Am Soc Mass Spectrom. 2009;20:1477–1485. doi: 10.1016/j.jasms.2009.05.007. [DOI] [PubMed] [Google Scholar]
- 8.Petyuk VA, Mayampurath AM, Monroe ME, Polpitiya AD, et al. DtaRefinery, a software tool for elimination of systematic errors from parent ion mass measurements in tandem mass spectra data sets. Mol Cell Proteomics. 2010;9:486–496. doi: 10.1074/mcp.M900217-MCP200. [DOI] [PMC free article] [PubMed] [Google Scholar]
- 9.Cox J, Mann M. MaxQuant enables high peptide identification rates, individualized p.p.b.-range mass accuracies and proteome-wide protein quantification. Nat Biotechnol. 2008;26:1367–1372. doi: 10.1038/nbt.1511. [DOI] [PubMed] [Google Scholar]
- 10.Cox J, Matic I, Hilger M, Nagaraj N, et al. A practical guide to the MaxQuant computational platform for SILAC-based quantitative proteomics. Nat Protoc. 2009;4:698–705. doi: 10.1038/nprot.2009.36. [DOI] [PubMed] [Google Scholar]
- 11.Shilov IV, Seymour SL, Patel AA, Loboda A, et al. The Paragon Algorithm, a next generation search engine that uses sequence temperature values and feature probabilities to identify peptides from tandem mass spectra. Mol Cell Proteomics. 2007;6:1638–1655. doi: 10.1074/mcp.T600050-MCP200. [DOI] [PubMed] [Google Scholar]
- 12.Bandhakavi S, Stone MD, Onsongo G, Van Riper SK, et al. A dynamic range compression and three-dimensional peptide fractionation analysis platform expands proteome coverage and the diagnostic potential of whole saliva. J Proteome Res. 2009;8:5590–5600. doi: 10.1021/pr900675w. [DOI] [PMC free article] [PubMed] [Google Scholar]
- 13.Rudnick PA, Clauser KR, Kilpatrick LE, Tchekhovskoi DV, et al. Performance metrics for liquid chromatography-tandem mass spectrometry systems in proteomics analyses. Mol Cell Proteomics. 2010;9:225–241. doi: 10.1074/mcp.M900223-MCP200. [DOI] [PMC free article] [PubMed] [Google Scholar]
- 14.Renard BY, Kirchner M, Monigatti F, Ivanov AR, et al. When less can yield more - computational preprocessing of MS/MS spectra for peptide identification. Proteomics. 2009;9:4978–4984. doi: 10.1002/pmic.200900326. [DOI] [PubMed] [Google Scholar]
- 15.Tang WH, Shilov IV, Seymour SL. Nonlinear fitting method for determining local false discovery rates from decoy database searches. J Proteome Res. 2008;7:3661–3667. doi: 10.1021/pr070492f. [DOI] [PubMed] [Google Scholar]
- 16.Shilov I, Seymour SL, Patel A. A method to achieve accurate protein confidences. Proceedings of the 58th ASMS Conference on Mass Spectrometry and Allied Topics; Salt Lake City, UT. May 23–27. 2010. [Google Scholar]
- 17.Omenn GS, Yocum AK, Menon R. Alternative splice variants, a new class of protein cancer biomarker candidates: findings in pancreatic cancer and breast cancer with systems biology implications. Dis Markers. 2010;28:241–251. doi: 10.3233/DMA-2010-0702. [DOI] [PMC free article] [PubMed] [Google Scholar]
- 18.Jagtap P, McGowan T, Bandhakavi S, Tu ZJ, et al. Deep metaproteomic analysis of human salivary supernatant. Proteomics. 2012;12:992–1001. doi: 10.1002/pmic.201100503. [DOI] [PMC free article] [PubMed] [Google Scholar]
Associated Data
This section collects any data citations, data availability statements, or supplementary materials included in this article.


