Abstract
The microstructure and wettability of titanium (Ti) surfaces directly impact osteoblast differentiation in vitro and in vivo. These surface properties are important variables that control initial interactions of an implant with the physiological environment, potentially affecting osseointegration. The objective of this study was to use polyelectrolyte thin films to investigate how surface chemistry modulates response of human MG63 osteoblast-like cells to surface microstructure. Three polyelectrolytes, chitosan, poly(l-glutamic acid), and poly(l-lysine), were used to coat Ti substrates with two different microtopographies (PT, Sa = 0.37 µm and SLA, Sa = 2.54 µm). The polyelectrolyte coatings significantly increased wettability of PT and SLA without altering micron-scale roughness or morphology of the surface. Enhanced wettability of all coated PT surfaces was correlated with increased cell numbers whereas cell number was reduced on coated SLA surfaces. Alkaline phosphatase specific activity was increased on coated SLA surfaces than on uncoated SLA whereas no differences in enzyme activity were seen on coated PT compared to uncoated PT. Culture on chitosan-coated SLA enhanced osteocalcin and osteoprotegerin production. Integrin expression on smooth surfaces was sensitive to surface chemistry, but microtexture was the dominant variable in modulating integrin expression on SLA. These results suggest that surface wettability achieved using different thin films has a major role in regulating osteoblast response to Ti, but this is dependent on the microtexture of the substrate.
Keywords: Wettability, Titanium, Surface roughness, Osteoblast
1. Introduction
Osseointegration is critical for the success of dental and orthopaedic implants, especially for patients with bone pathology [1]. The primary interaction between a biomaterial and the surrounding bone involves the outermost molecular layers of the implant [2]. Thus, the surface micro-roughness [3,4], surface energy [5,6], and surface charge [7,8] of the biomaterial play important roles in influencing cellular response.
In order to improve osseointegration, many studies have been devoted to the modification of biomaterial surface properties [9]. Titanium surfaces with both micrometer and submicrometer scale roughness have been shown to enhance osteoblast differentiation in vitro and bone formation in vivo [10]. The increased surface area associated with a higher degree of surface roughness provides a larger contact region with the surrounding tissue than that available with a smooth surface, and consequently, provides increased stability for tissue anchoring [11]. However, poor surface wettability due to increased surface roughness and adsorption of organic contaminants from the atmosphere can delay the initial interactions with tissue fluids and ultimately impact the rate and extent of new bone formation [12–14]. Enhanced surface wettability on rough titanium implant surfaces shortens wound healing time and increases tissue integration of titanium implants by forming conditioned protein layers, thereby reducing the gap between tissue and the biomaterial surface [6,15].
The adsorption of proteins on biomaterial surfaces is controlled to a great extent by surface chemistry and is the key parameter responsible for cell attachment and adhesion, spreading, and proliferation [16]. Therefore, in vitro studies using chemically modified surfaces have focused on these parameters [12,17–19]. More recent studies have shown that integrin expression is also sensitive to surface chemistry [20] and that osteoblast differentiation and local factor production are dependent on specific integrin signaling [21]. Integrins are heterodimeric transmembrane receptors consisting of α- and β- subunits, which bind to extracellular matrix proteins [22,23]. In addition to surface chemistry, integrin expression is also sensitive to surface wettability and micron-scale roughness [21,24].
Several studies have shown that integrin signaling modulates different aspects of cellular response to their substrates. When bone marrow cells are cultured on tissue culture polystyrene (TCPS), integrin α5β1 binds to fibronectin, resulting in osteogenic gene expression and mineralization [22]. In contrast, over-expression of the αvβ3 integrin stimulates proliferation but down-regulated osteoblastic differentiation [25,26]. Similarly, when osteoblasts are grown on titanium substrates, α5β1 mediates cell attachment and proliferation but inhibits differentiation [21]. In contrast to TCPS, osteoblastic differentiation on Ti requires α2β1 signaling and this in further enhanced when osteoblasts are grown on microtextured Ti, particularly when the micro-rough surfaces have been modified to have high surface energy [21].
It is not known whether the dominant property of a Ti surface is its wettability or its microtopography, nor is it known if the method used to achieve enhanced wettability is a critical variable. Surface chemistry and surface wettability are interrelated properties. The effects of varying surface wettability using different chemistries and the resulting influences on cell differentiation, local factor production, and integrin expression have not been well studied, particularly in the context of a complex surface topography.
The objective of this study was to assess the role of chemistry in determining osteoblast responses to microtextured hydrophilic substrates of comparable wettability. A variety of surface modifications have been proposed with the goal of changing surface wettability [13,27,28]. The thin oxide layer on the surface of titanium exhibits a pH-dependent surface charge [29], making it a useful surface for these kinds of modifications. We previously developed a method for applying polyelectrolyte thin films onto the titanium oxide layer [30], taking advantage of the robust and conformal surface “bottom-up” nanofabrication resulting in a high charge density [31]. We used this technology to modify surface wettability by coating polyelectrolyte thin films with different charges directly onto thin titanium oxide layers without altering the microstructure of the Ti surface and examine whether these chemical modifications alter osteoblast maturation, local factor production, and integrin expression.
2. Materials and methods
2.1. Titanium (Ti) substrates
Ti disks (grade 2 commercially pure Ti, Ø 15 mm × 1 mm) were supplied by Institut Straumann AG (Basel, Switzerland). Two different surface topographies were used [32]: a machined surface pretreated using a proprietary method (PT, Sa = 0.38 µm and a sand blasted/acid-etched surface (SLA, Sa = 2.54 µm). Ti disks used for the cell study were sterilized with gamma irradiation overnight. The physical and chemical properties of the disks before and after gamma irradiation have been described previously [14].
2.2. Preparation of polyelectrolyte thin films
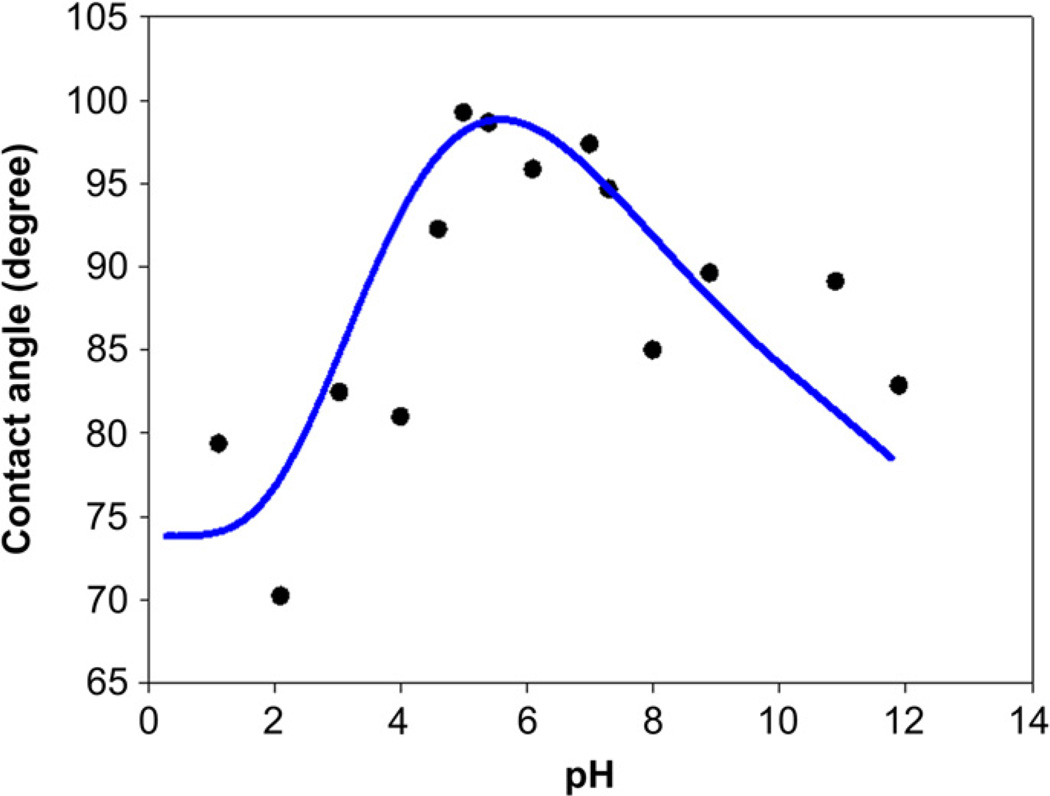
Chitosan (CHI, MW = 125,000–350,000 g/mol, deacetylation degree 80–89%, medical grade) was obtained from NovaMatrix (Drammen, Norway). Poly(l-glutamic acid) (PGA, MW = 50,000–100,000 g/mol) and poly(l-lysine) (PLL, MW = 150,000–300,000 g/mol, medical grade) were purchased from Sigma–Aldrich (St. Louis, MO). Polyelectrolyte thin films were directly formed on a thin native oxide layer on PT and SLA surfaces. The titanium oxide layer and the CHI, PGA, and PLL films have different charges at different pH values. Therefore, the electrostatic force induced by different charge interactions is the main driving force for developing the formation of the thin films. To maximize the interaction between the oxide layer and each polyelectrolyte, the isoelectric point (IEP) of the titanium oxide layer (pH ~ 5.1) was estimated by measuring contact angle as a function of droplet pH (Fig. 1). The pH of the polyelectrolyte solutions of CHI (pKa ≈ 6.5), PGA (pKa ≈ 4.4) [23], and PLL (pKb ≈ 5) was adjusted to pH 5.8, pH 4.8, and pH 7.0, respectively, as described below.
Fig. 1.
The isoelectric point (IEP) of the titanium oxide layer was estimated using contact angle measurement as a function of different pH of the drop solution. pH was adjusted by using 1 N NaOH and 1 N HCl.
Glacial acetic acid was obtained from Sigma–Aldrich. PGA (pH 4.8) and PLL (pH 7.0) solutions were prepared by mixing 0.1 mg/ml of the polymer in ultrapure water (18.2 MΩ cm, Millipore Milli-Q system). The CHI (pH 5.8) solution was prepared by dissolving 1.5 mg/ml in 0.1 m acetic acid. All polyelectrolyte solutions were filtered through a polytetrafluorethylene (PTFE) filter (pore size 0.2 µm). The polyelectrolyte layer was prepared on the PT or SLA surface by immersing the substrates in 500 µl of the polyelectrolyte solutions at room temperature for 2 h. Each coating was followed by a 5 min rinse in ultrapure water. The filtering and coating processes were performed in a UV sterilized hood. Polyelectrolyte-coated surfaces are denoted as substrate-polyelectrolyte. For example, PT-PLL represents a PT surface that was coated with poly(l-lysine). Ti surfaces without polyelectrolyte coating were used as controls.
2.3. Surface characterization
The surface morphology of polyelectrolyte-coated Ti surfaces was examined by scanning electron microscopy (SEM) using an Ultra 60 field emission (FE) microscope (Carl Zeiss SMT, Ltd., Cambridge, UK) with 5 kV accelerating voltage. For these analyses, the surfaces were sputter-coated with gold.
The stability of polyelectrolyte thin films on PT and SLA substrates was examined by immersion of the coated surfaces into full medium without cells. After 3 days in the cell culture environment (incubation at 37 °C), the surfaces were rinsed with abundant ultrapure water and dried at room temperature. Surface morphology and chemical composition were characterized using scanning electron microscopy and X-ray photoelectron microscopy.
The contact angle of polyelectrolyte-coated Ti disks was determined using a Ramé-Hart goniometer (model 250-F1, Mountain Lakes, NJ). Ultrapure water was dropped (2 µl), recorded, and analyzed with the DROPimage CA software package (Ramé-Hart Instrument Co.). Three measurements were made on separate surfaces per group. In order to plot a three dimensional (3D) correlation between surface properties and cellular response, the surface water tension was calculated using following equation: Es = Elvcosθ, where Elv = 72.8 dyne/cm at 20 °C for pure water and θ is the contact angle [33].
Surface roughness of Ti disks before and after polyelectrolyte adsorption was measured using a LEXT 3D Material Confocal Laser Microscope (CLM, 100× objective, area scan 128 × 128 µm, Olympus America Inc., PA, USA). Results were evaluated using the LEXT OLS4000 software provided by Olympus. The threshold was set to 80 µm. PT and polished PT surface roughness also was measured by an atomic force microscopy (AFM, Nano-R™ AFM, Pacific Nanotechnology, CA, USA) in the close contact mode. Data were obtained using silicon probes (Model: P-MAN-SICC-0; tip radius: 10 nm; force: 40 N/m; resonance frequency: 300 kHz; dimensions: 1.14 × 0.25 cm2). The average surface roughness (Sa, nm) was determined using the NanoRule + software provided by Pacific Nanotechnology. Three measurements were made on each surface per group.
X-ray photoelectron spectroscopy (XPS) measurements were performed on a Thermo K-Alpha (Thermo Fisher Scientific, Inc., MA, USA). The XPS analysis chamber was evacuated to a pressure of 10−9 Torr or lower before collecting XPS spectra. This system was equipped with a monochromatic Al Kα X-ray source (hv = 1486.6 eV photons) at a 90° takeoff angle. XPS results were evaluated using the Thermo Advantage 4.43 software package provided by Thermo Fisher Scientific, Inc.
2.4. Cell response
Cell responses to polyelectrolyte-coated PT or SLA surfaces were performed using human osteoblast-like MG63 cells (American Type Culture Collection, Manassas, VA). Cells were plated at a density of 10,000 cells/cm2 on either tissue culture polystyrene (TCPS) as an internal standard or Ti surfaces and cultured in Dulbecco’s modification of Eagle’s medium (DMEM, Cellgro®, Mediatech, Inc., Manassas, VA) supplemented with 10% fetal bovine serum (Hyclone, Waltham, MA) and 1% penicillin–streptomycin (Invitrogen, Carlsbad, CA) at 37 °C, 5% CO2, and 100% humidity. Cells were cultured until confluence was achieved on TCPS. Cell number was counted in all cultures 24 h after confluence on TCPS. To collect all cells on the rough Ti surfaces, cells were released by two sequential 10 min incubations in 0.25% trypsin-EDTA. Cells were counted using Z1 Particle Counter (Beckman Coulter, Fullerton, CA). Cellular alkaline phosphatase specific activity was measured by determining p-nitrophenol (pNP) release from p-nitrophenylphosphate (pNPP) at pH 10.2 in the cell lysate and normalized to total protein content (Macro BCA Protein Assay Kit, Pierce). Osteocalcin (OCN) levels in the conditioned media were determined by radioimmunoassay (Human Osteocalcin RIA Kit, Biomedical Technologies, Stoughton, MA). Osteoprotegerin (OPG) and vascular endothelial growth factor (VEGF) were determined by enzyme-linked immunosorbent assay (ELISA) kit (DuoSet, R&D Systems, Minneapolis, MN). Immunoassay results were normalized to total cell number.
2.5. Integrin expression
MG63 cells were plated and cultured as described above. At confluence on TCPS, all cultures were incubated with fresh medium for 12 h. RNA was isolated using TriZol (Invitrogen) following the manufacturer’s protocol. 250 ng of RNA was reverse transcribed into cDNA (High capacity cDNA Kit, Applied Biosystems, Carlsbad, CA). The resulting cDNA was used in real-time PCR reactions with Power Sybr Green (Applied Biosystems). Levels of mRNA for integrin subunits α1, α2, α5, αv, β1 and β3 were calculated using standard curves generated from known dilutions of MG63 cells and normalized to expression of glyceraldehyde 3-phosphate dehydrogenase (GAPDH). Probes were designed using Beacon Designer Software and synthesized by Eurofins MWG Operon (Huntsville, AL). Table 1 shows primer sequences used for real-time PCR analysis of gene expression.
Table 1.
Primer sequences used for real-time PCR analysis of gene expression.
| Gene | Primer sequence | Accession number | |
|---|---|---|---|
| GAPDH | R | GCG AGC ACA GGA AGA AGC | NM_002046.3 |
| F | GCT CTC CAG AAC ATC ATC C | ||
| ITGA1 | R | TGC TTC ACC ACC TTC TTG | NM_181501.1 |
| F | CACTCGTAAATGCCAAGAAAAG | ||
| ITGA2 | R | TAGAACCCAACACAAAGATGC | NM_002203 |
| F | ACT GTT CAA GGA GGA GAC | ||
| ITGA5 | R | GGT CAA AGG CTT GTT TAG G | NM_002205 |
| F | ATC TGT GTG CCT GAC CTG | ||
| ITGAV | R | AAG TTC CCT GGG TGT CTG | NM_002210.2 |
| F | GTTGCTACTGGCTGTTTTGG | ||
| ITGB1 | R | CTGCTCCCTTTCTTGTTCTTC | NM_002211 |
| F | ATT ACT CAG ATC CAA CCA C | ||
| ITGB3 | R | TCC TCC TCA TTT CAT TCA TC | NM_000212 |
| F | AAT GCC ACC TGC CTC AAC | ||
2.6. Statistical analysis
Data are presented as mean ± SEM for n = 6 independent cultures. Data were analyzed using a one-way analysis of variance (ANOVA) for all surfaces. If there was statistical difference, Bonferroni’s modification of Student’s t-test for multiple comparisons was used. P < 0.05 was considered significant. The presented data were one of two repeated experiments, both with comparable results.
3. Results
3.1. Polyelectrolyte thin films on titanium surfaces
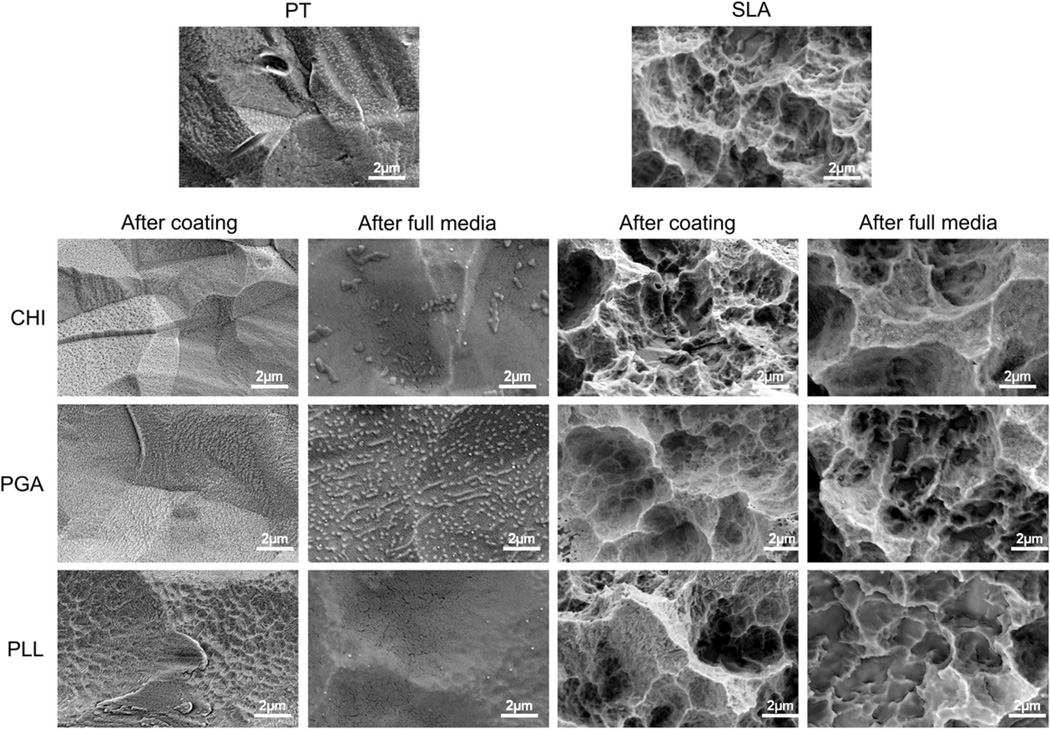
SEM confirmed that polyelectrolyte thin films covered the whole PT and SLA surfaces without forming an incomplete layer (Fig. 2). The polyelectrolyte film was stable in culture medium. No difference was observed between PT-PGA surfaces that had been immersed in full medium and the original coating surface. PT-CHI and PT-PLL surfaces had a smoother surface morphology after exposure to the full media, but no apparent differences in surface morphology was seen on the SLA-CHI and SLA-PGA surfaces. Submicron scale features of the SLA-PLL surfaces were not observed with SEM imaging.
Fig. 2.
Scanning electron microscopy (SEM) images for PT and SLA surfaces before and after coating polyelectrolyte thin films: chitosan (CHI), poly(l-lysine) (PLL), and poly(l-glutamic acid) (PGA). The morphology of polyelectrolyte thin films on PT and SLA surfaces after immersion full media were examined by SEM.
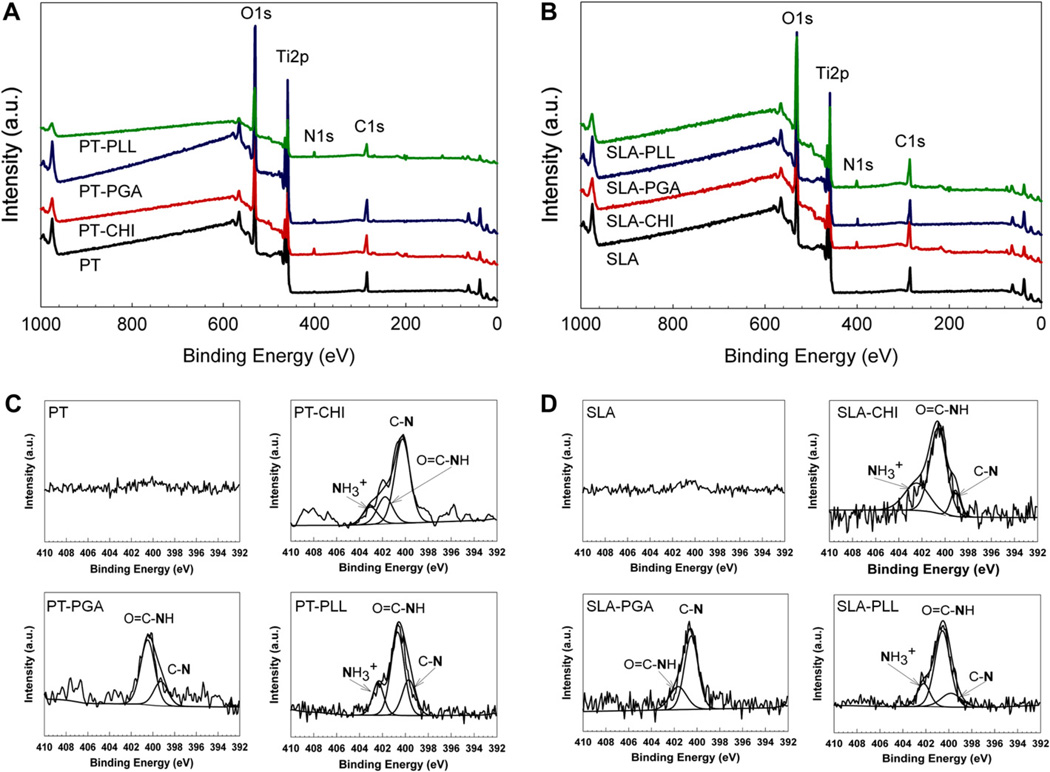
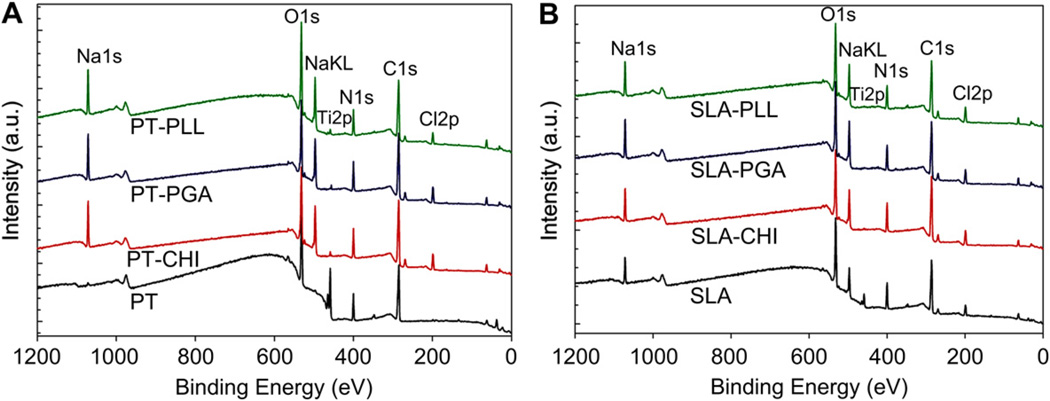
X-ray photoelectron spectroscopy (XPS) showed that the surfaces reflected the chemical composition of the coating (Fig. 3A, B). A nitrogen (N1s) peak was detected only on the polyelectrolyte-coated PT and SLA surfaces. The high resolution of N1s spectra clearly showed the presence of positively-charged amine groups () at 402.95 eV, 402.35 eV, 402.49 eV, and 402.27 eV for the PT-CHI, PT-PLL, SLA-CHI, and SLA-PLL surfaces, respectively. The N1s peak detected on the PGA surface originated from the backbone of its chemical structure (Fig. 3C, D). The intensity of Ti2p peak decreased on polyelectrolyte-coated PT surfaces that were immersed in full media. Moreover, Ti2p signals were not observed on polyelectrolyte-coated SLA surfaces (Fig. 4).
Fig. 3.
Surface chemistry of polyelectrolyte thin films on PT (A) and SLA (B) surfaces was analyzed by x-ray photoelectron spectroscopy (XPS). Nitrogen (N1s) XPS high resolution spectra were obtained from PT (C) and SLA (D) surfaces before and after coating polyelectrolyte thin films.
Fig. 4.
The stability of polyelectrolyte thin films coated on PT and SLA surfaces was examined by immersing the coated disks in full medium without cells at 37 °C for 3 days. Surface chemistry was characterized by using XPS.
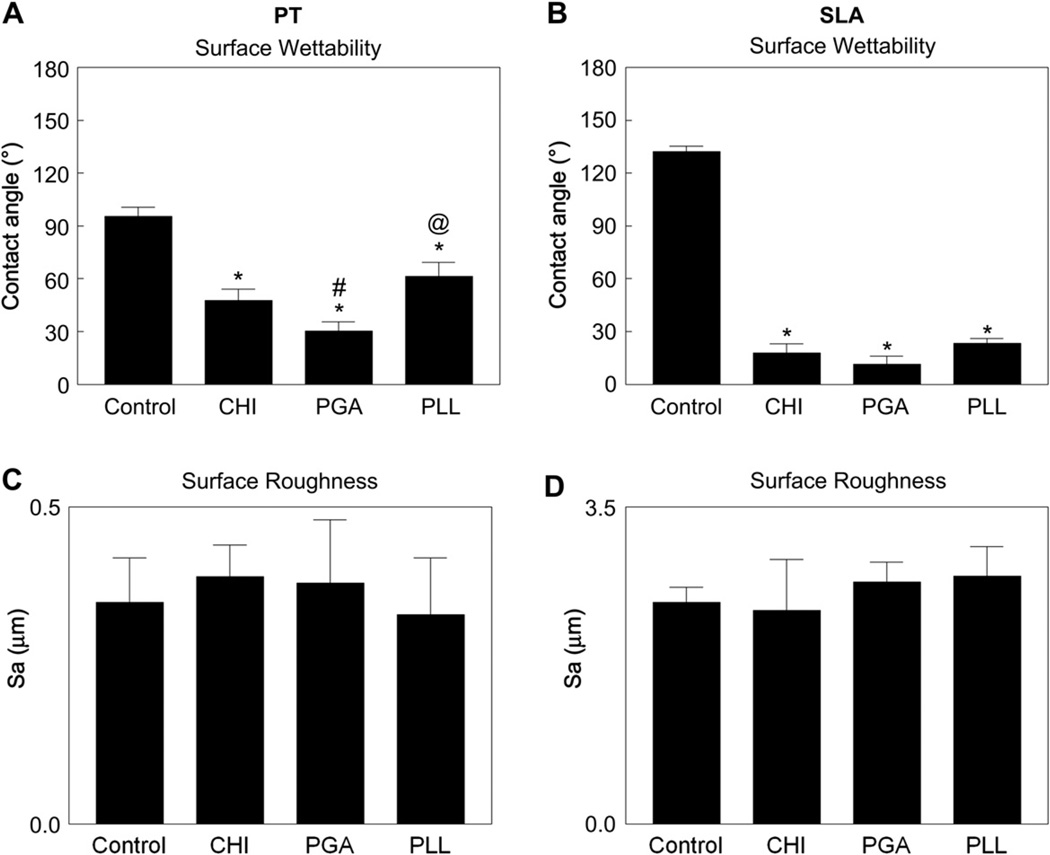
Measurement of contact angles showed that PT and SLA surface wettability was significantly increased after coating with CHI, PGA, and PLL (Fig. 5A, B). The PT-CHI and the PT-PGA surfaces had better wettability than PT or PT-PLL surfaces. SLA surface wettability was enhanced by polyelectrolyte thin films to a comparable extent on all of the coated SLA surfaces.
Fig. 5.
Influence polyelectrolyte thin films on surface wettability and roughness. Wettability on PT (A) and SLA (B), roughness on PT (C) and SLA (D). Data were analyzed using ANOVA and statistical significance between groups was determined using ‘Bonferroni’s modification of student’s t-test. *p < 0.05 vs. control; #p < 0.05 vs. CHI; @p < 0.05 vs. PGA.
Surface roughness (Sa, µm) measured by confocal laser microscopy was not significantly altered after coating the PT and SLA surfaces with the polyelectrolytes (Fig. 5C, D). PT surface roughness measured by AFM with 5 µm scan length (Sa, nm), revealed no differences in surface roughness after polyelectrolyte coating (Table 2). Because the scale of SLA roughness is beyond the range of the AFM imaging technique, its roughness could not be validated in this manner.
Table 2.
Summary of surface contact angle, surface tension, and roughness on PT and SLA surfaces before and after polyelectrolyte coating. Surface tension was calculated based on the equation Es = Elvcosθ, where Elv = 72.8 dyne/cm at 20 °C for pure water and θ is a contact angle. Roughness was determined by using confocal laser microscope (CLS) and atomic force microscope (AFM) (n = 6).
| Contact angle (°) |
Surface tension (dyne/cm) |
Roughness |
||
|---|---|---|---|---|
| CLM, Sa (µm) | AFM, Sa (nm) | |||
| PT-Control | 95.6 ± 5.0 | −7.1 | 0.35 ± 0.07 | 176.5 ± 48.0 |
| PT-CHI* | 47.7 ± 6.3 | 49.0 | 0.33 ± 0.05 | 169.8 ± 26.3 |
| PT-PGA** | 30.3 ± 5.2 | 62.9 | 0.39 ± 0.10 | 146.4 ± 16.3 |
| PT-PLL*** | 61.5 ± 7.9 | 34.7 | 0.36 ± 0.09 | 141.0 ± 10.5 |
| SLA-Control | 132 ± 3.0 | −49.0 | 2.45 ± 0.16 | – |
| SLA-CHI* | 17.8 ± 5.2 | 69.3 | 2.74 ± 0.56 | – |
| SLA-PGA* | 11.5 ± 4.4 | 71.3 | 2.36 ± 0.22 | – |
| SLA-PLL* | 23.3 ± 2.7 | 66.9 | 2.33 ± 0.32 | – |
p < 0.05 vs. Ti-Control;
p < 0.05 vs. Ti-CHI;
p < 0.05 vs. Ti-PGA. AFM tip detection limitation was not able to measure SLA surfaces.
3.2. Cellular response of MG63 cells to surface modifications
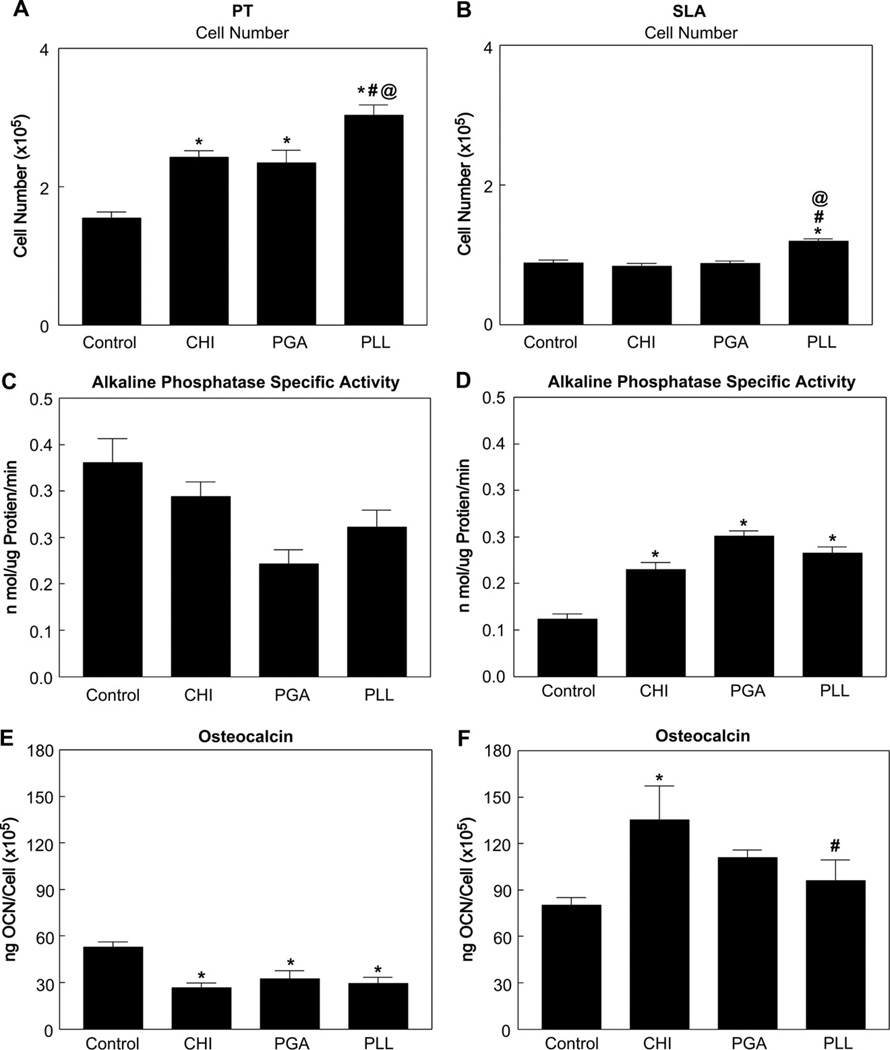
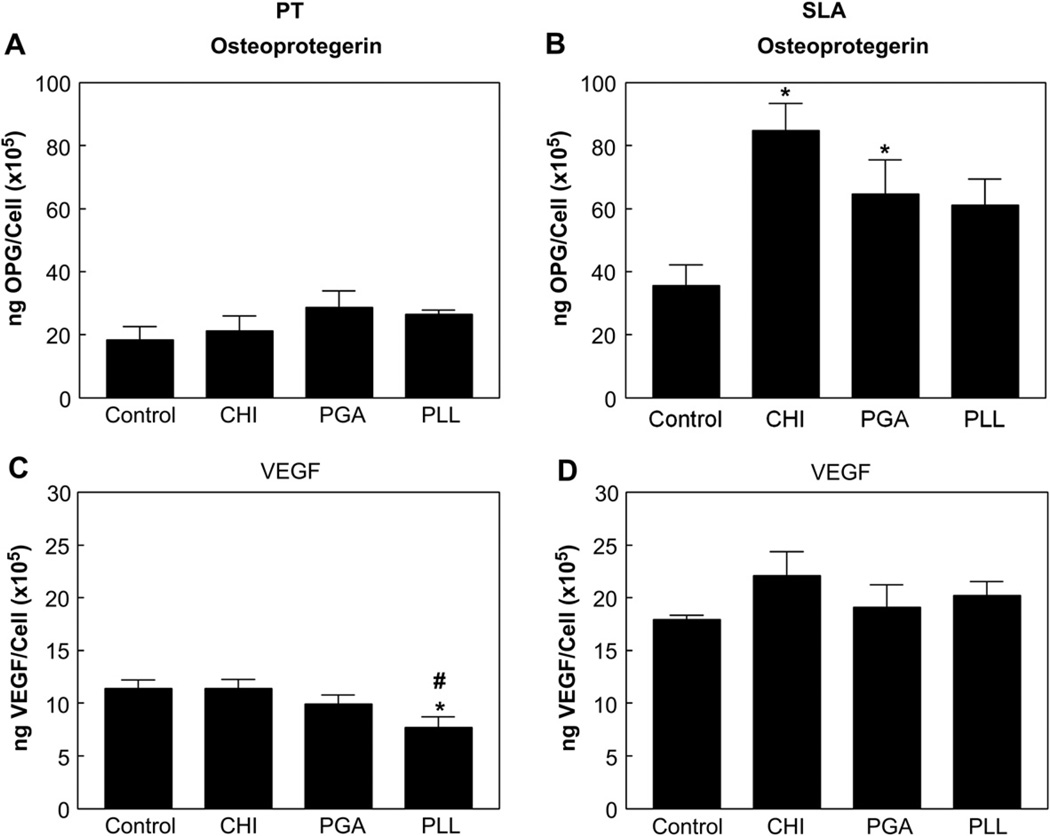
Osteoblasts were sensitive to surface wettability and roughness. Cell numbers increased on CHI, PGA, or PLL coated PT surfaces compared to the uncoated PT surfaces (Fig. 6A). SLA-PLL surfaces had more cells than SLA-Control, SLA-CHI, and SLA-PGA surfaces (Fig. 6B). Alkaline phosphatase specific activity, an early marker of osteogenic differentiation, was not affected by enhanced wettability with different polyelectrolytes on PT surfaces (Fig. 6C). Cells cultured on SLA-CHI, SLA-PGA, and SLA-PLL surfaces had higher enzyme activity than cells on SLA-Control surfaces (Fig. 6D). Osteocalcin, a late marker of osteoblast differentiation, decreased on PT surfaces coated with CHI, PGA, or PLL as compared to the PT-Control surfaces (Fig. 6E). The highest osteocalcin production by MG63 cells was observed in response to the SLA-CHI surface (Fig. 6F). There was no difference in osteocalcin production on the SLA-PGA and SLA-PLL surfaces compared to the SLA-Control surfaces. Enhanced wettability of the PT surface had no impact on osteoprotegerin (Fig. 7A) and vascular endothelial growth factor (VEGF) production, except on the PT-PLL surface (Fig. 7C). Osteoprotegerin was produced in greater amounts on the SLA-CHI and SLA-PGA surfaces compared to SLA-Control surface (Fig. 7B). There was no difference in VEGF production levels on the SLA-CHI, SLA-PGA, and SLA-PLL as compared to SLA-Control surfaces (Fig. 7D).
Fig. 6.
Response of MG63 cells cultured on polyelectrolyte thin film-coated PT and SLA surfaces: cell number on PT (A) and SLA (B), alkaline phosphatase specific activity on PT (C) and SLA (D), and osteocalcin levels in the conditioned medium on PT (E) and SLA (F). Cell number and proteins were determined in all cultures 24 h after confluence on tissue culture polystyrene (TCPS). The data presented are from one of two separate experiments, both with compared results. Data were analyzed using ANOVA and statistical significance between groups was determined using ‘Bonferroni’s modification of Student’s t-test. *p < 0.05 vs. control; #p < 0.05 vs. CHI; @p < 0.05 vs. PGA.
Fig. 7.
Response of MG63 cells cultured on polyelectrolyte thin film-coated PT and SLA surfaces: osteoprotegerin levels on PT (A) and SLA (B) and VEGF levels on PT (C) and SLA (D) in the conditioned medium. Proteins were determined in all cultures 24 h after confluence on tissue culture polystyrene (TCPS). Data were analyzed using ANOVA and statistical significance between groups was determined using Bonferroni’s modification of Student’s t-test. *p < 0.05 vs. control; #p < 0.05 vs. CHI.
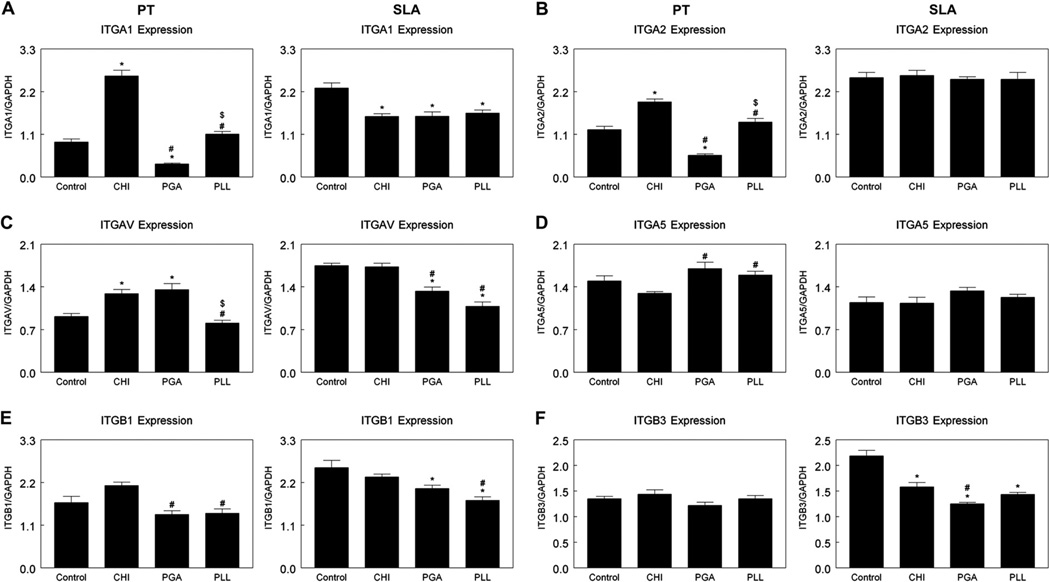
Integrin subunit expression was sensitive to surface chemistry and surface roughness. mRNAs for integrin α1 increased on the PT-CHI surface while decreasing on the PT-PGA surface, and no differences on PT-PLL compared to PT-Control surfaces (Fig. 8A). α1 expression decreased on the SLA-CHI, SLA-PGA, and SLA-PLL surfaces compared to SLA-Control surfaces (Fig. 8A). Changes in mRNAs for integrin α2 on PT surfaces were similar to α1 mRNA. However, α2 expression was less sensitive to enhanced surface wettability on SLA surfaces (Fig. 8B). Integrin αv mRNAs were higher on PT-CHI and PT-PGA surfaces than on PT-Control or PT-PLL surfaces. αv expression decreased on SLA-PGA or SLA-PLL surfaces compared with SLA-Control and SLA-CHI surfaces (Fig. 8C). There was no difference in α5 expression on polyelectrolyte-coated PT or SLA surfaces in comparison with control surfaces (Fig. 8D). Expression of integrin β1 and β3 was not affected surface wettability induced with polyelectrolyte thin films on PT surfaces (Fig. 8E, F), but β3 expression was reduced with enhanced wettability and roughness (Fig. 8F).
Fig. 8.
Effects of surface chemistry and roughness on integrin mRNA expression in MG63 cells were evaluated 12 h after confluence on tissue culture polystyrene (TCPS). Cells were cultured on control PT and SLA surfaces (Cont) that were not coated with polyelectrolyte and PT and SLA surfaces that were coated with chitosan (CHI), poly(l-lysine) (PLL), and poly(l-glutamic acid) (PGA). (A) α1; (B) α2; (C) αV; (D) α5; (E) β1; and (F) β3. *p < 0.05 vs. control; #p < 0.05 vs. CHI; $p < 0.05 vs. PGA.
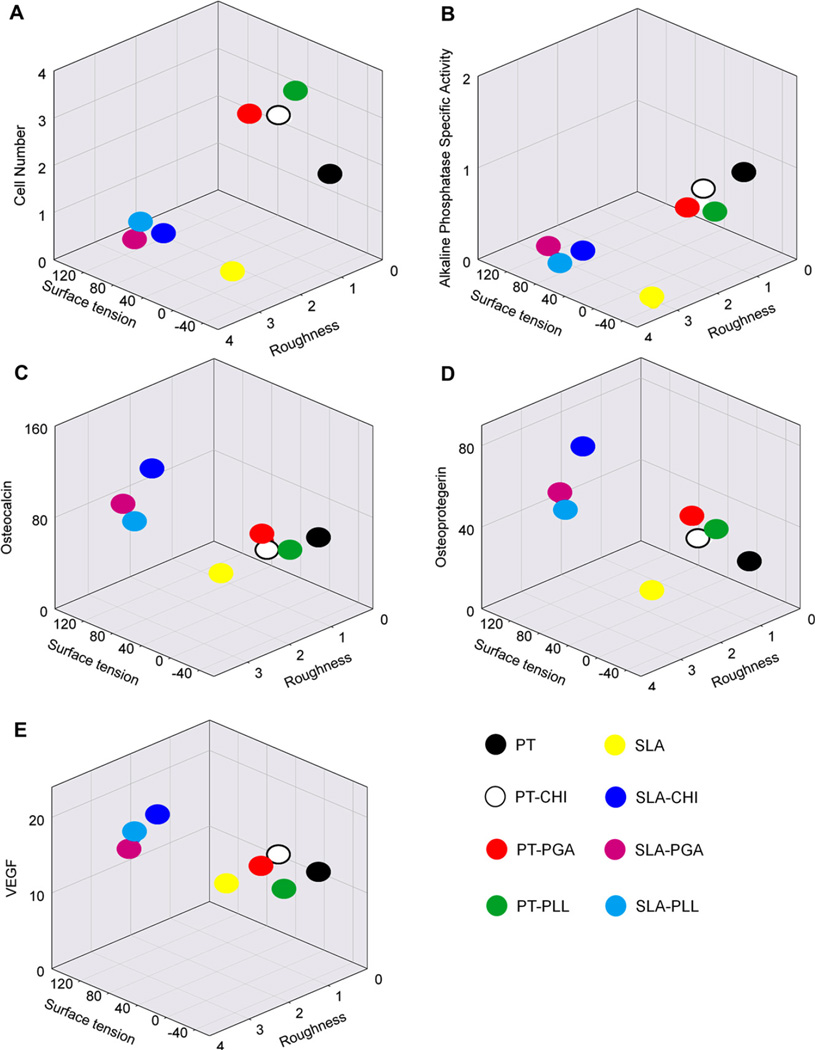
The correlation between surface properties of the polyelectrolyte thin films on structured titanium and cell response is shown in Fig. 9. Surface contact angle data were converted to surface tension (Table 2), the PT or SLA-Control surfaces had negative surface tension values while polyelectrolyte-coated PT and SLA surface had positive values. Three dimensional plots of surface tension, roughness, and cell response showed a higher number of cells present on smooth surfaces with higher surface tension than on rough surfaces (Fig. 9A). Similar relationships were observed for the early-stage differentiation of MG63 cells, i.e. alkaline phosphatase specific activity (Fig. 9B). Osteocalcin (Fig. 9C), osteoprotegerin (Fig. 9D), and VEGF (Fig. 9E) levels were highly regulated on surfaces with positive surface tension and rougher topography. In particular, osteocalcin production levels were enhanced on the SLA-CHI surface (blue dot).
Fig. 9.
Correlation among surface properties including surface tension and roughness and cellular responses.
4. Discussion
Enhanced initial surface wettability plays an important role in the improvement of the early bone healing at the interface between bone and biomaterials, increasing protein adsorption, stimulating cell attachment, adhesion, and spreading [12,18]. Osteoblast maturation on surfaces with enhanced wettability having different chemistries is an important factor in engineering implant surfaces for osseointegration, but has been less studied. Our results demonstrate that surface wettability induced with different surface chemistry can regulate MG63 cell response, including early and later differentiation, local factor production levels, and integrin expression.
Surface wettability was modified by coating polyelectrolyte thin films on microstructured Ti surfaces. A number of factors influence polyelectrolyte adsorption, including concentration, ionic strength, and pH [30,34]. In this study, the adsorption conditions of polyelectrolyte chains on the substrate were optimized by adjusting pH of polyelectrolyte solutions and salt concentration. Previously we showed that PT surfaces were not fully covered with CHI and PGA with salt addition in polyelectrolyte solutions [30]. However, in salt-free conditions used here, PT and SLA surfaces were completely covered with CHI, PGA, and PLL. Optimized polyelectrolyte adsorption conditions enhance PT and SLA surface wettability compared with polyelectrolyte thin films prepared with salt addition. Enhanced wettability of PT and SLA surfaces after polyelectrolyte adsorption was mainly controlled by the different surface chemistry since all polyelectrolyte-coated PT and SLA surfaces had the comparable surface roughness. Importantly, the micron-scale roughness of the surfaces was not altered by the films.
The stability of polyelectrolyte thin films is critical because delaminated film from metallic surfaces can release metal ions due to electrochemical reactions in the exposed environment [35], and may lead to implant failure. We demonstrated that the polyelectrolyte thin films were stable on the native titanium oxide layer when exposed to the cell culture environment. SEM and XPS analysis data confirmed that the integrity of the thin films was not compromised. There were changes in surface topography, however, that were polyelectrolyte specific. The smoother morphology of the PT-PLL and SLA-PLL surface after immersion in full medium may be due to swelling of the thin films in the presence of salt and ions in the culture medium [36,37]. The intensity of the Ti2p peak detected on the polyelectrolyte-coated PT and SLA surfaces decreased with increasing Cl2p and Na1s peak intensity, possibly due to proteins that were adsorbed on the outermost polyelectrolyte-coated layers.
These results indicate that the polyelectrolyte thin films on microstructured titanium surfaces are stable and robust. Fabricating metal surfaces using polyelectrolyte thin films can provide a pH-buffering effect, thereby preventing metal ion release due to electrochemical reactions in the physiological environment, which has been hypothesized to negatively impact osteoblast differentiation and function [38–40]. Furthermore, it is possible that corrosion of metal implants can be minimized with polyelectrolyte thin films.
Although surface wettability achieved with different chemistry was comparable, differences in composition and charge species of the polyelectrolyte thin films may have contributed to the differences in cell responses that were observed, since microtopography of the PT and SLA surfaces was not changed. Cell number increased on positively charged () PT-PLL and SLA-PLL rather than on negatively charged SLA-PGA. Although CHI has positively charged () groups, the cell number increased only on PT. Surface wettability with different chemistry and charges on rough SLA surfaces modulated alkaline phosphatase activity, whereas the same chemistry had no effect on smooth surfaces. Osteocalcin production was decreased on more wettable smooth surfaces compared to the control PT surface, but on the rough surfaces, CHI with positive charge () surface dominantly induced a greater osteocalcin and osteoprotegerin production than PGA (COO−) and PLL (). Although PLL had the same charge in a CHI, the cellular response was different in a surface roughness dependent manner. Since the wettability was comparable among SLA-CHI, SLA-PGA, and SLA-PLL surfaces, it suggests that surface chemical composition of CHI, PGA, and PLL plays a role in modulating osteoblast differentiation based on osteocalcin production.
Others have shown that surface chemistry exhibiting hydroxyl (–OH) and amine (–NH2) groups increased osteoblast differentiation markers compared with carboxyl (–COOH) and methyl (–CH3) groups [20]. These earlier observations used coated tissue culture surfaces, which differ from the Ti substrates used in the present study. Here we show that VEGF production was dominantly modulated by surface roughness. In addition, the differences in cell response between PT and SLA surfaces suggest that surface roughness is a critical factor influencing cell response as well as surface wettability and chemistry. Integrin expression is also sensitive to surface wettability as well as surface roughness. The integrin expression on smooth PT surface is regulated by surface chemistry. In contrast, the roughness on SLA surfaces is a more critical factor to induce integrin expression.
Our results indicate that surface wettability, chemistry, and roughness are essential parameters for understanding the correlation between surface properties and cell response in order to design ideal biomaterials. By correlating surface tension, roughness, and cell responses, our findings suggest that surface roughness is the primary and surface tension is the secondary regulator of osteoblast differentiation.
5. Conclusions
In this work, we have shown enhanced wettability achieved using different surface chemistries without modifying microtopography can modulate integrin expression, cell proliferation, differentiation, and production of local factors. Wettability on smooth surfaces is important for regulating cell number while surface roughness with a specific chemistry dominantly impacts osteoblast differentiation and local factor production. Integrin expression on smooth PT surfaces is controlled by surface chemistry but on rough SLA surfaces is regulated by surface roughness. Overall, surface wettability, chemistry, charge, and roughness are connected to each other and contribute to the overall cell response.
Acknowledgments
This work was supported by USPHS Grant AR052102 and the ITI Foundation. The PT and SLA disks were provided by Institut Straumann AG.
References
- 1.Vandamme K, Holy X, Bensidhoum M, Logeart-Avramoglou D, Naert IE, Duyck JA, et al. In vivo molecular evidence of delayed titanium implant osseointegration in compromised bone. Biomaterials. 2011;32(14):3547–3554. doi: 10.1016/j.biomaterials.2011.01.056. [DOI] [PubMed] [Google Scholar]
- 2.Kasemo B, Lausmaa J. Material-tissue interfaces – the role of surface-properties and processes. Environ Health Perspect. 1994;102:41–45. doi: 10.1289/ehp.94102s541. [DOI] [PMC free article] [PubMed] [Google Scholar]
- 3.Kieswetter K, Schwartz Z, Hummert TW, Cochran DL, Simpson J, Dean DD, et al. Surface roughness modulates the local production of growth factors and cytokines by osteoblast-like MG-63 cells. J Biomed Mater Res. 1996;32(1):55–63. doi: 10.1002/(SICI)1097-4636(199609)32:1<55::AID-JBM7>3.0.CO;2-O. [DOI] [PubMed] [Google Scholar]
- 4.Raines AL, Olivares-Navarrete R, Wieland M, Cochran DL, Schwartz Z, Boyan BD. Regulation of angiogenesis during osseointegration by titanium surface microstructure and energy. Biomaterials. 2010;31(18):4909–4917. doi: 10.1016/j.biomaterials.2010.02.071. [DOI] [PMC free article] [PubMed] [Google Scholar]
- 5.Zhao G, Schwartz Z, Wieland M, Rupp F, Geis-Gerstorfer J, Cochran DL, et al. High surface energy enhances cell response to titanium substrate microstructure. J Biomed Mater Res A. 2005;74A(1):49–58. doi: 10.1002/jbm.a.30320. [DOI] [PubMed] [Google Scholar]
- 6.Schwarz F, Wieland M, Schwartz Z, Zhao G, Rupp F, Geis-Gerstorfer J, et al. Potential of chemically modified hydrophilic surface characteristics to support tissue integration of titanium dental implants. J Biomed Mater Res B. 2009;88B(2):544–557. doi: 10.1002/jbm.b.31233. [DOI] [PubMed] [Google Scholar]
- 7.Krukowski M, Shively RA, Osdoby P, Eppley BL. Stimulation of craniofacial and intramedullary bone formation by negatively charged beads. J Oral Maxillofac Surg. 1990;48(5):468–475. doi: 10.1016/0278-2391(90)90233-r. [DOI] [PubMed] [Google Scholar]
- 8.Cobos JA, Yang JP, Zhang RW, Krukowski M, Simmons DJ. Positively charged dextran resin inhibits trabecular bone repair in the rabbit tibial physis. J Biomed Mater Res. 1998;39(3):458–461. doi: 10.1002/(sici)1097-4636(19980305)39:3<458::aid-jbm16>3.0.co;2-6. [DOI] [PubMed] [Google Scholar]
- 9.Lasprilla AJR, Martinez GAR, Lunelli BH, Jardini AL, Maciel Filho R. Biomaterials for application in bone tissue engineering. J Biotechnol. 2010;150:S455-S. [Google Scholar]
- 10.Zhao G, Raines AL, Wieland M, Schwartz Z, Boyan BD. Requirement for both micron- and submicron scale structure for synergistic responses of osteoblasts to substrate surface energy and topography. Biomaterials. 2007;28(18):2821–2829. doi: 10.1016/j.biomaterials.2007.02.024. [DOI] [PMC free article] [PubMed] [Google Scholar]
- 11.Hansson S. The implant neck: smooth or provided with retention elements – a biomechanical approach. Clin Oral Implan Res. 1999;10(5):394–405. doi: 10.1034/j.1600-0501.1999.100506.x. [DOI] [PubMed] [Google Scholar]
- 12.Ponsonnet L, Reybier K, Jaffrezic N, Comte V, Lagneau C, Lissac M, et al. Relationship between surface properties (roughness, wettability) of titanium and titanium alloys and cell behaviour. Mat Sci Eng C-Bio S. 2003;23(4):551–560. [Google Scholar]
- 13.Lim YJ, Oshida Y, Andres CJ, Barco MT. Surface characterizations of variously treated titanium materials. Int J Oral Maxillofac Implants. 2001;16(3):333–342. [PubMed] [Google Scholar]
- 14.Park JH, Olivares-Navarrete R, Baier RE, Meyer AE, Tannenbaum R, Boyan BD, et al. Effect of cleaning and sterilization on titanium implant surface properties and cellular response. Acta Biomater. doi: 10.1016/j.actbio.2011.11.026. (e-publication: 2011 Dec 2). [DOI] [PMC free article] [PubMed] [Google Scholar]
- 15.Boyan BD, Hummert TW, Dean DD, Schwartz Z. Role of material surfaces in regulating bone and cartilage cell response. Biomaterials. 1996;17(2):137–146. doi: 10.1016/0142-9612(96)85758-9. [DOI] [PubMed] [Google Scholar]
- 16.Park JW, Kim YJ, Jang JH. Enhanced osteoblast response to hydrophilic strontium and/or phosphate ions-incorporated titanium oxide surfaces. Clin Oral Implants Res. 2010;21(4):398–408. doi: 10.1111/j.1600-0501.2009.01863.x. [DOI] [PubMed] [Google Scholar]
- 17.Liu X, Lim JY, Donahue HJ, Dhurjati R, Mastro AM, Vogler EA. Influence of substratum surface chemistry/energy and topography on the human fetal osteoblastic cell line hFOB 1.19: phenotypic and genotypic responses observed in vitro. Biomaterials. 2007;28(31):4535–4550. doi: 10.1016/j.biomaterials.2007.06.016. [DOI] [PMC free article] [PubMed] [Google Scholar]
- 18.Hallab NJ, Bundy KJ, O’Connor K, Moses RL, Jacobs JJ. Evaluation of metallic and polymeric biomaterial surface energy and surface roughness characteristics for directed cell adhesion. Tissue Eng. 2001;7(1):55–71. doi: 10.1089/107632700300003297. [DOI] [PubMed] [Google Scholar]
- 19.Ruardy TG, Schakenraad JM, van der Mei HC, Busscher HJ. Adhesion and spreading of human skin fibroblasts on physicochemically characterized gradient surfaces. J Biomed Mater Res. 1995;29(11):1415–1423. doi: 10.1002/jbm.820291113. [DOI] [PubMed] [Google Scholar]
- 20.Keselowsky BG, Collard DM, Garcia AJ. Integrin binding specificity regulates biomaterial surface chemistry effects on cell differentiation. Proc Natl Acad Sci USA. 2005;102(17):5953–5957. doi: 10.1073/pnas.0407356102. [DOI] [PMC free article] [PubMed] [Google Scholar]
- 21.Olivares-Navarrete R, Raz P, Zhao G, Chen J, Wieland M, Cochran DL, et al. Integrin alpha 2 beta 1 plays a critical role in osteoblast response to micron-scale surface structure and surface energy of titanium substrates. Proc Natl Acad Sci USA. 2008;105(41):15767–15772. doi: 10.1073/pnas.0805420105. [DOI] [PMC free article] [PubMed] [Google Scholar]
- 22.Siebers MC, ter Brugge PJ, Walboomers XF, Jansen JA. Integrins as linker proteins between osteoblasts and bone replacing materials. A critical review. Biomaterials. 2005;26(2):137–146. doi: 10.1016/j.biomaterials.2004.02.021. [DOI] [PubMed] [Google Scholar]
- 23.Otani Y, Tabata Y, Ikada Y. Rapidly curable biological glue composed of gelatin and poly(-glutamic acid) Biomaterials. 1996;17(14):1387–1391. doi: 10.1016/0142-9612(96)87279-6. [DOI] [PubMed] [Google Scholar]
- 24.Lim YW, Kwon SY, Sun DH, Kim HE, Kim YS. Enhanced cell integration to titanium alloy by surface treatment with microarc oxidation: a pilot study. Clin Orthop Relat Res. 2009;467(9):2251–2258. doi: 10.1007/s11999-009-0879-6. [DOI] [PMC free article] [PubMed] [Google Scholar]
- 25.Moursi AM, Globus RK, Damsky CH. Interactions between integrin receptors and fibronectin are required for calvarial osteoblast differentiation in vitro. J Cell Sci. 1997;110:2187–2196. doi: 10.1242/jcs.110.18.2187. [DOI] [PubMed] [Google Scholar]
- 26.Cheng SL, Lai CF, Blystone SD, Avioli LV. Bone mineralization and osteoblast differentiation are negatively modulated by integrin alpha v beta 3. J Bone Miner Res. 2001;16(2):277–288. doi: 10.1359/jbmr.2001.16.2.277. [DOI] [PubMed] [Google Scholar]
- 27.Park JW, Kim YJ, Park CH, Lee DH, Ko YG, Jang JH, et al. Enhanced osteoblast response to an equal channel angular pressing-processed pure titanium substrate with microrough surface topography. Acta Biomater. 2009;5(8):3272–3280. doi: 10.1016/j.actbio.2009.04.038. [DOI] [PubMed] [Google Scholar]
- 28.Khang D, Lu J, Yao C, Haberstroh KM, Webster TJ. The role of nanometer and sub-micron surface features on vascular and bone cell adhesion on titanium. Biomaterials. 2008;29(8):970–983. doi: 10.1016/j.biomaterials.2007.11.009. [DOI] [PubMed] [Google Scholar]
- 29.Bullard JW, Cima MJ. Orientation dependence of the isoelectric point of TiO2 (rutile) surfaces. Langmuir. 2006;22(24):10264–10271. doi: 10.1021/la061900h. [DOI] [PubMed] [Google Scholar]
- 30.Park JH, Schwartz Z, Olivares-Navarrete R, Boyan BD, Tannenbaum R. Enhancement of surface wettability via the modification of microtextured titanium implant surfaces with polyelectrolytes. Langmuir. 2011;27(10):5976–5985. doi: 10.1021/la2000415. [DOI] [PMC free article] [PubMed] [Google Scholar]
- 31.Decher G. Fuzzy nanoassemblies: toward layered polymeric multicomposites. Science. 1997;277(5330):1232–1237. [Google Scholar]
- 32.Olivares-Navarrete R, Hyzy SL, Park JH, Dunn GR, Haithcock DA, Wasilewski CE, et al. Mediation of osteogenic differentiation of human mesenchymal stem cells on titanium surfaces by a Wnt-integrin feedback loop. Biomaterials. 2011;32(27):6399–6411. doi: 10.1016/j.biomaterials.2011.05.036. [DOI] [PMC free article] [PubMed] [Google Scholar]
- 33.Lim JY, Liu XM, Vogler EA, Donahue HJ. Systematic variation in osteoblast adhesion and phenotype with substratum surface characteristics. J Biomed Mater Res A. 2004;68A(3):504–512. doi: 10.1002/jbm.a.20087. [DOI] [PubMed] [Google Scholar]
- 34.Dubas ST, Schlenoff JB. Factors controlling the growth of polyelectrolyte multilayers. Macromolecules. 1999;32(24):8153–8160. [Google Scholar]
- 35.Aparicio C, Gil FJ, Fonseca C, Barbosa M, Planell JA. Corrosion behaviour of commercially pure titanium shot blasted with different materials and sizes of shot particles for dental implant applications. Biomaterials. 2003;24(2):263–273. doi: 10.1016/s0142-9612(02)00314-9. [DOI] [PubMed] [Google Scholar]
- 36.Dubas ST, Schlenoff JB. Polyelectrolyte multilayers containing a weak polyacid: construction and deconstruction. Macromolecules. 2001;34(11):3736–3740. [Google Scholar]
- 37.Dubas ST, Schlenoff JB. Swelling and smoothing of polyelectrolyte multilayers by salt. Langmuir. 2001;17(25):7725–7727. [Google Scholar]
- 38.Thompson GJ, Puleo DA. Effects of sublethal metal-ion concentrations on osteogenic cells derived from bone-marrow stromal cells. J Appl Biomater. 1995;6(4):249–258. doi: 10.1002/jab.770060406. [DOI] [PubMed] [Google Scholar]
- 39.Nichols KG, Puleo DA. Effect of metal ions on the formation and function of osteoclastic cells in vitro. J Biomed Mater Res. 1997;35(2):265–271. doi: 10.1002/(sici)1097-4636(199705)35:2<265::aid-jbm14>3.0.co;2-g. [DOI] [PubMed] [Google Scholar]
- 40.Andreeva DV, Fix D, Mohwald H, Shchukin DG. Buffering polyelectrolyte multilayers for active corrosion protection. J Mater Chem. 2008;18(15):1738–1740. [Google Scholar]


