

Abstract
We present a microscale cell culture system with an interdigitated microarray of excimer-laser-ablated indium tin oxide electrodes for electrical stimulation of cultured cells. The system has been characterized in a range of geometeries and stimulation regimes via electrochemical impedance spectroscopy and used to culture primary cardiomyocytes and human adipose derived stem cells. Over 6 days of culture with electrical stimulation (2 ms duration, 1 Hz, 180 μm wide electrodes with 200 μm spacing), both cell types exhibited enhanced proliferation, elongation and alignment, and adipose derived stem cells exhibited higher numbers of Connexin-43-composed gap junctions.
Introduction
Cardiac tissue engineering utilizes cardiogenic cells, structural templates (scaffolds), and regulatory factors (molecular and physical) presented to the cells by a culture system (biorector) to generate engineered constructs that emulate the properties of the native tissue.1 The recently established biomimetic approach attempts to recapitulate specific aspects of the in vivo developmental milieu, including 3-dimensional structure, biochemical cues,2,3 and physical forces (electrical4–6 and mechanical7–9) and thereby “instruct” the cells to assemble into functional tissue units.
Human embryonic,10–12 adult,13–15 and induced pluripotent (iPS) stem cells16,17 are all considered promising cell sources for cardiac tissue engineering that are now being investigated for safe and efficacious utilization. We are interested in directed differentiation of cardiogenic cells using electrical field stimulation, in conjunction with the application of molecular regulatory factors. We previously showed that a biomimetic system designed to deliver electric signals mimicking those in native heart resulted in rapid development of conductive and contractile properties in tissue constructs based on neonatal rat cardiomyocytes. Over only 8 days of culture, electrical stimulation induced cell alignment and coupling, increased amplitude of synchronous contractions, and led to a remarkable level of ultrastructural organization.1,5 We also showed that electrical fields can affect morphology and alignment of human adipose tissue derived stem cells (hASCs) cultured in a two-dimensional (2D) culture setting and subjected to a direct-current field.18 Electrical stimulation may be a controllable alternative to cardiac differentiation of hASCs using medium supplementation with rat cardiomyocyte extract19 or 5-azacytidine.20
Other groups have developed the in vitro models of arrhythmia,21 mechano-electrical feedback22 and protocols for maintaining stable cardiac phenotype in culture.23,24 These studies employed various electrode configurations, including point-stimulation electrodes,21,22 line electrodes,22 or rod-shaped electrodes,23–25 with adjustments to specific types of culture, that in some cases resulted in technically challenging solutions. For example, to use carbon rod electrodes for stimulating cell monolayers, inserts6 have been constrcuted that elevate the culture surface to the central plane of the electrodes, so that cells are grown in the middle of the applied electrical field. Gaskets have also been used to stabilize tissue constructs at a stable position between the electrodes.26 In all cases, additional length was required at the end of each carbon rod to allow making electrical connections.
These previous studies and the need to study cardiogenic cells in a wide range of experimental parameters (e.g., cell developmental stage; combinations, levels and timing of application of cytokines), motivate the development of advanced micro-scale systems (environmental control, multiparameteric signaling, imaging compatibility) that would allow screening of electrical stimulation parameters (e.g., signal amplitude, frequency, duration, shape, spatial-variance) for the optimization of cell differentiation regimens.
An attractive alternative to conventional electrodes is a thin film of Indium Tin Oxide (ITO), which combines excellent electrical conductivity with optical transparency,27 and the ability for micropatterning. ITO has been used in a wide range of non-biological applications, including flat panel displays, solar cells, and surface heaters for automobile windows.28 Because ITO appears to be non-toxic and stable at warm and humid conditions associated with cell culture, glass plates coated with ITO have been used in monolayer cultures of a variety of cell types, including bacterial, neuronal and endothelial cells.29–34 Of note, micropatterned electrodes, as opposed to flat sheets, allow for spatial control of the electrical field passed through the cells (instead of over the cells). The micropatterned ITO substrates have thus found application in biosensing,34 as stimulation electrodes35 and recording electrodes36 for optical mapping of whole heart-preparations, and as electrode arrays with non-uniform electric fields for dielectrophoretic cell patterning.37,38
We describe a novel surface-patterned microbioreactor array, where an excimer laser-based method was used to generate a micropatterned ITO substrate with an interdigitated array of electrodes designed for electrical stimulation of cultured cells. Fabrication via photolithography involves a long series of steps: dehydrated ITO-glass slides are coated with positive photoresist, exposed to ultraviolet light through a photomask, exposed regions are removed in a developer solution, ITO regions not protected by photoresist are etched away with acid, and the remaining photoresist is removed by sonicating in acetone.39 The excimer laser-based method enables direct patterning of the ITO in a single step, and without the use of harsh chemicals or a customized photomask. The process is rather simple and reproducible, and - for small batch sizes typically involved in prototyping applications - excimer laser ablation (~10 min/slide) will often be faster than the acid etching (~5 h/run).
We demonstrate the utility of excimer laser-ablated ITO as a patternable and optical imaging-compatible substrate for long-term, micro-scale cell culture with electrical stimulation. We have electrically characterized laser-ablated interdigitated ITO microelectrodes of various geometries, performed modeling of induced electric fields during cell stimulation, and investigated electrical stimulation of cultured neonatal rat cardiomyocytes and human adipose derived stem cells.
Methods
Laser Ablation of ITO Slides
ITO slides (Delta Technologies, Stillwater, MN), with a nominal coating thickness of 1,500–2,000 Å and sheet resistance of 4–8 Ω were ablated using a RapidX-1000 Excimer Laser System (Resonetics, Nashua NH) equipped with a LPX200 Lambda Physik excimer laser. Ablation was done at a wavelength of 248 nm (obtained with KrF gas), and energy density of 400 mJ/cm2. The laser beam was shone onto a stainless steel mask with a 2 mm × 2 mm cutout, and the 10x optics reduced the final spot size at surface to a 0.2 × 0.2 mm square (Fig. 1A). With each pulse, we ablated a 200 μm × 200 μm square, moving in 10 μm increments. We ablated a strip of ITO to create the interdigitated electrode array (Fig. 1B–C) and an insulating strip in the middle of the 75 × 25 mm slide to allow for two independent culture wells (Fig. 1D).
Figure 1. Indium-tin-oxide patterned substrate.

(A) Schematic of the laser-ablation process of the indium-tin-oxide substrates. (B) Closeup image of patterned electrode array with 200 μm electrodes and 200 μm spacing (scale bar corresponds to 200 μm). (C) Atomic force micrograph of a 50 μm-wide electrode patterned via laser ablation (scale bar: 50 μm) (D) Photograph of slide patterned with two interdigitated electrode arrays. (E) Photograph of bioreactor with two culture wells (employed for all studies reported here).
Fabrication of the Two-Well Bioreactor
Two culture wells were made out of poly(dimethylsiloxane) (PDMS) (Essex Chemical, Sylgard®184) on the top of the laser patterned ITO-coated glass (Fig. 1E). The culture wells were fabricated by curing PDMS in a mold fabricated by QuickParts to our specifications with a precision of 50 μm. A 10:1 mixture of PDMS and initiator was poured into the “negative” acrylite mold and cured at 60 °C for 2 hours. The PDMS two-well structure was peeled gently from the acrylite surface and was attached directly to the ITO-coated 75 × 25 mm glass slide by treatment with atmospheric RF plasma (Plasma Cleaner PDC-002, Harrick Plasma). The two hydrophilic surfaces were then pressed together for a few minutes to ensure a tight seal. Wires were attached to the positive and negative electrodes via conductive tape (McMaster Carr), to provide connection to the electrical stimulator. The resulting bioreactor was then cleaned with 70% ethanol and autoclaved at 120 °C.
Surface Characterization by Atomic Force Microscopy
Atomic force microscopy (AFM) was used to determine depth of the patterned electrode. The Dimension V atomic force microscope (Veeco Instruments Inc., Plainview, NY) was operated in tapping mode using a 200–250 μm long silicon cantilever with a spring constant of 2.8 N/m. AFM images were taken in air at room temperature (21°C) and standard flattened image processing was applied to raw data to correct for possible hysteresis of the piezoelectric material or crosstalk between the (x,y,z) axes.
Electrochemical Impedance Spectroscopy
The effects of electrode configurations, input voltages, and time of use (“ageing”) have all been assessed by performing current measurements and electrochemical impedance spectroscopy (EIS), as previously described.40–42 For current measurements, an electrical circuit with a 10-ohm resistor in series with the bioreactor was constructed. The potential across the resistor was measured and recorded over time using a 100 MHz, 1.25 gigasamples per second oscilloscope (Tektronix TDS3014B). The current was then calculated using Ohm’s Law (I=V/R where V is voltage measured with the oscilloscope, I is current, and R is resistance).
EIS measurements were taken using an electrochemical interface (Solartron 1287) and frequency response analyzer (FRA, Solartron 1250) controlled by a computer with ZPlot software. EIS spectra were acquired for each electrode over a frequency range from 1 × 100 to 1 × 10⁶ Hz, with perturbation amplitudes (input voltages) of 10 mV and 1 V. Collected data were evaluated in ZView 2.5b software to generate Nyquist and Bode plots, and from these, data were fit to a simple “Randles’ cell” equivalent circuit, (Fig. 2D) using instant fit functions. In a Randles’ cell, Rs represents the resistance of the bulk solution, Rp represents the polarization resistance (the electrode’s resistance to corrosion), and a “constant-phase element” (CPE) represents, in lieu of a capacitor, the capacitance of the non-ideal double layer at the electrode/electrolyte interface. A CPE’s impedance is of the form Z=1/[(CPE)(jω)η], where the factor η expresses the degree of non-ideality of the CPE, and ranges in value from 0 to 1 (for an ideal capacitor, η is equal to 1, decreasing with increasing “non-ideality”). EIS measurements were performed in 1x PBS to facilitate comparisons with literature data and our other studies, since the conductivity of PBS (15 mS/cm) is similar to that of culture medium with 10% FBS (~14 mS/cm).43
Figure 2. Electrical characterization of patterned ITO substrate.

(A–B) Bode plot of (A) electrode impedance and (B) phase versus frequency for a new (solid) and aged (dotted) ITO electrode array (used for 6 weeks of continuous stimulation) with 180 μm electrodes and 200 μm spacing. (C) Graph of current for ITO electrode array with 180 μm electrodes and 200 μm spacing and input stimulus of 250 mV. (D) Equivalent circuit for modeling the electrochemical behavior of the ITO electrode array.
Modeling of Electrical Fields in Bioreactor
To model the electrical field experienced by the cells at the bioreactor surface, we assumed electroquasistatic conditions and used a commercially available software (Multiphysics, Comsol, electrostatics module). The electroquasistatic approximation is generally considered appropriate for simple cases such as homogenous, isotropic media, where the system under consideration is much smaller than the wavelengths of interest (for biological systems generally under 10 kHz and for some cases even below the GHz range).38,44 In our case, with the application of monophasic rectangular pulses 2 ms in duration, greater than 99% of the power of the applied signal lies in the frequency band below 10 KHz, (95% lies in the band below 1 KHz).45 Furthermore, we assumed an isotropic medium with conductance of 15 mS/cm so that we could calculate the electric fields by solving Maxwell’s equations with the electroquasistatic approximation.44 Since the ITO height is several orders of magnitude smaller than the spacing between electrodes, we assumed that the electrodes were of infinitesimal height relative to the laser-ablated surface. We also assumed that the glass surface provides an electrically insulating boundary condition, and solved the equations using triangular mesh of elements with an average area of 48 μm2.
Cell Culture
Cardiac cells were isolated as previously described5,42,46 from neonatal rat heart ventricles. Human adipose tissue-derived stem cells (hASCs) were derived as previously described,47 expanded in monolayers and used at the second passage. The interdigitated electrode cell-culture surfaces were coated with 0.05% calf skin collagen type I in 0.1N acetic acid and incubated for 1 h at 37 °C prior to cell culture. Cells were seeded at a density of 100,000 cells/cm2 (cardiomyocytes) and 5,000 cells/cm2 (hASCs), and cultured for 7 days either with or without applying electrical stimulation, in high glucose DMEM supplemented with 10% fetal bovine serum. Medium was changed two times a week. In electrically stimulated cultures, electrical conditioning was initiated at 24 hours or 3 days after seeding for ASCs or cardiomyocytes, respectively.
Electrical Stimulation Regime
All cell cultures were performed on an ITO microarray of electrodes with a width of 180 μm and spacing of 200 μm. Cardiac cells were stimulated for 4 days using square monophasic pulses (1 ms duration, 1 Hz, 500 mV amplitude) after 3 days of preculture without electrical stimulation, as previously described.6 Adipose tissue-derived stem cells were stimulated for 6 days using square monophasic pulses (2 ms duration, 1 Hz, 20 mV amplitude) after one day of preculture without electrical stimulation.
Assessment of Contractile Activity
Contractile activity was assessed via image analysis of videos taken at a 10x magnification. Cells were maintained in a Tyrode’s solution at 37°C by means of a heated stage, as in our previous studies.25 Videos of unpaced cells were taken at four different spots to record spontaneous beating. Then, one spot was chosen for recording of the cells under pacing conditions at amplitudes of 40 mV, 80 mV and 1.25 V, a frequency of 1 Hz, and a stimulus duration of 1 ms. For subsequent analysis, we used six videos of 3 s duration for each condition. We measured areas of contracting cells with ImageJ software using the “freehand selection” tool and calculated the percentage of total area beating.
Expression of Cardiac Markers
Cells were fixed in 3% paraformaldehyde for 15 minutes at room temperature (0.5mL per well), incubated with 0.1M Glycine in PBS (pH 7.5) for 5 minutes, and rinsed 3 times with PBS at room temperature. After fixing, we followed a previously established protocol for immunofluorescence,25 using rabbit anti Connexin-43 (1:150, from Millipore) and AlexaFluor ® 488 phalloidin (1:200, from Invitrogen).
Cell Counts
Cell nuclei were counted by ImageJ software on DAPI-stained images taken at 10x magnification, using 6 images (0.57 mm2 each) per data point. Student’s t-test (two samples, assuming equal variances) was used to determine differences between the groups, considering p<0.01 as statistically significant.
Gap Junction Analysis
The density of gap junctions was assessed in sections fluorescently stained for the gap junctional protein Connexin-43 using a custom-developed software, as previously described.25 We analyzed images of each condition (stimulated or control) taken at 40x magnification, and with an exposure time of 1,000 ms. Images of labeled gap junctions and nuclear stains were processed separately in order to label and count objects which would correspond to the number of gap junctions, or cell nuclei, respectively. From the total numbers of gap junctions and cell nuclei we calculated the ratio of gap junctions/nucleus. We analyzed 4 images for each condition from 7 wells and 2 independent experiments, for a total of approximately 1,000–1,500 cells evaluated per condition. Student’s t-test (two samples, assuming equal variances) was used to determine differences between the groups, considering p<0.01 as statistically significant.
Measurement of Cell Alignment
Phalloidin-stained images taken at 10x magnification were analyzed by using ImageJ software for the quantification of cell alignment.48 After performing contrast enhancement, edge detection and image thresholding to identify actin fibers, the program calculated the major (longest) and minor (shortest) radii of each cell by fitting the cell outline to an optimized ellipse shape. Alignment was defined as the angle between the major axis and the zero-angle base line, which was set to be perpendicular to the direction of the electrodes. For quantification, 6 images (0.57 mm2 each) per sample were taken. An F-test was used to determine differences between the groups, considering p<0.01 as statistically significant.
Electrical Characterization of the ITO Bioreactor
By excimer laser ablation of ITO coated glass slides, we generated micro-scale culture surfaces for application of electrical stimulation with a range of electrode widths and spacings. The depth of the etched pattern determined via atomic force microscopy was between 200 and 220 nm (Fig. 1C), indicating complete ablation of the ITO surface with a 20 nm “curl”, consistent with other results for laser ablation of ITO by ultra-fast pulses.49 The ablation of the ITO surface was further confirmed by measuring the resistance between the electrodes and observing electrical isolation (> 40 MΩ).
The system was characterized over a wide range of frequencies using electrochemical impedance spectroscopy. A highly non-linear behavior was evidenced by the measured impedance and phase diagrams as a function of frequency (Fig. 2A and B). The system was found to exhibit a “corner frequency” in the KHz range (Fig. 2A), with high impedance at low frequencies and stable impedance at high frequencies. The ITO system can thus be described as a “high pass filter”, due to the high impedance presented to low-frequency signals. As is commonly done with electrochemical impedance spectra, we have performed analysis by fitting data to an equivalent electrical circuit model, the Randles’ cell (Fig. 2D). The resulting calculated values of each electrical element in the equivalent circuit are shown in Table 1.
Table 1.
Equivalent circuit parameters calculated using the Randles’ cell model for various electrode widths and spacing, and perturbation voltages
| Electrode Width (μm) | Electrode Spacing μm) | Perturbation Voltage | Rs (Ω) | CPE (F·sη−1) | Rp (Ω) | η (unitless) |
|---|---|---|---|---|---|---|
| 50 | 200 | 10mV | 60.88 ± 0.75 | 2.42E-06 ± 5.7E-08 | 5.72E+14 ± 2.9E+11 | 0.93 ± 3.8E-03 |
| 1 V | 59.0 ± 0.57 | 2.53E-06 ± 4.6E-08 | 3.65E+14 ± 2.2E+11 | 0.93 ± 2.9E-03 | ||
| 100 | 200 | 10 mV | 63.5 ± 0.49 | 1.99E-06 ± 2.8E-08 | 1.34E+15 ± 2.1E+11 | 0.94 ± 2.2E-03 |
| 1 V | 61.2 ± 0.51 | 2.06E-06 ± 3.1E-08 | 8.28E+14 ± 2.2E+11 | 0.94 ± 2.4E-03 | ||
| 180 | 200 | 10 mV | 49.6 ± 0.28 | 2.90E-06 ± 3.0E-08 | 5.20E+14 ± 1.1E+11 | 0.95 ± 1.6E-03 |
| 1 V | 48.1 ± 0.60 | 3.25E-06 ± 7.8E-08 | 1.81E+14 ± 2.4E+11 | 0.93 ± 3.9E-03 | ||
| 200 | 400 | 10 mV | 39.8 ± 0.30 | 5.20E-06 ± 8.0E-08 | 2.48E+13 ± 9.5E+10 | 0.97 ± 2.6E-03 |
| 1 V | 39.1 ± 0.29 | 5.40E-06 ± 8.6E-08 | 2.89E+14 ± 9.0E+10 | 0.97 ± 2.7E-03 | ||
| 400 | 400 | 10mV | 48.7 ± 0.40 | 3.12E-06 ± 6.0E-08 | 3.45E+14 ± 1.9E+11 | 0.94 ± 3.1E-03 |
| 1 V | 47.5 ± 0.36 | 3.12E-06 ± 4.5E-08 | 4.05E+14 ± 1.4E+11 | 0.95 ± 2.3E-03 |
Because there is no single solution for an equivalent circuit, the elements in the model should have a basis in the physical electrochemistry of the system. In a Randles’ cell, Rs represents the resistance of bulk solution, Rp represents the polarization resistance (the electrode’s resistance to corrosion), and the constant-phase element (CPE) represents the non-ideal capacitance of the double layer at the electrode/electrolyte interface (please also see Mehtods). The agreement between the measured data and the fitting spectra indicated that this equivalent circuit provided a feasible, if not unique, model to describe the performance of the interdigitated electrode array system. When electrochemical impedance data for a range of electrode geometries and input amplitudes were fit to equivalent circuit parameters (Fig. 2D), Rp values were consistently on the order of 1014 Ohms. This high resistance to corrosion is consistent with past findings of ITO’s stability within a range of pH values.50 The corrosion mechanism of ITO is based on the electrochemical formation of Cl+ and OH− radical species able to withdraw electrons from In–O surface bonds,51 and the lack of corrosion points to reversible processes (electrochemical double layer) as the mechanism for charge injection under the pulsatile stimuli applied to cells.
One benefit of high Rp is the mitigation of the effect of cell attachment on electrode behavior. In previous studies with ITO electrode arrays for E coli cell culture, the most significant change with cell attachment was found in the electron-transfer resistance, indicating that assembly of the antibody protein layer on the electrode surface introduced an electron-transfer barrier.34 Given the high electron-transfer resistance of the system, it is unlikely that the cell proliferation and attachment would provide any appreciable effect on electrode behavior. Indeed we did not observe any changes in currents while stimulating cardiac cells as compared to cell-free bioreactors (data not shown).
In addition to high Rp for all configurations and input amplitudes, we also observed high measured values for η (the term corresponding to the goodness-of-fit when comparing actual data to the behavior of an ideal capacitor), ranging from 0.93 to 0.97. The stability of the bioreactor’s properties over a range of input amplitudes and geometries, coupled with the low error associated with the equivalent circuit parameters, indicates that the kinetic and diffusional processes involved in charge transfer at the electrode-electrolyte interface are likely independent of the input stimulus. Of note, the bioreactor could be used continuously for at least 6 weeks without observing changes of electrical properties (Fig. 2A, B).
When we compared the ITO interdigitated electrode system presented here with the carbon graphite electrode systems we have used in the past for culture of 3-dimensional tissue engineered cardiac constructs, we see some similarities. Both systems can be modeled very well by a Randles’ cell, and when modeled, exhibit very large Rp,40 indicative of high resistance to galvanic corrosion. We can therefore assume that the main mechanism for charge injection is reversible in both the ITO and carbon electrode systems, which is beneficial for cell culture since corrosive processes are kept to a minimum. In addition, the ITO electrodes appear to age even more slowly than carbon electrodes, which exhibited small yet measurable changes in electrode properties after just one week of stimulation.41 The corner frequency for ITO is two orders of magnitude higher than that for carbon electrodes (103 Hz versus 101 Hz, respectively), and much closer to that of titanium nitride, titanium, and stainless steel electrodes that we have also characterized.42 This higher corner frequency, in combination with a high resistance to corrosion, indicates that the capability of ITO substrate for charge injection is lower than that for carbon. In contrast, stainless steel electrodes have low resistance to galvanic corrosion, and supply much more current by irreversible Faradaic processes.
Modeling of Electrical Parameters
In modeling studies, the magnitudes of electric fields supplied to the cells in the ITO system characterized here were compared to the systems utilizing electrodes with high Rp and high capacitance (such as carbon rods). Specifically, we used equivalent-circuit parameters to approximate the resistance of the solution relative to the total impedance between the two electrodes (which in turn is the sum of solution resistance and the impedances of the electrode-electrolyte interface). Because of the high values of both Rp and η, we can approximate Rp as an open circuit and CPE as an ideal capacitor. The impedance of our electrochemical system will thus be a function of time (or frequency) as in a simple series RC circuit, in which the proportion of the electric field across the solution is Rs/(Rs+1/jωC), where Rs is the solution resistance extracted from EIS data, C refers to the CPE value, and ω refers to the frequency of the applied stimulus. For ITO electrodes that are 180 μm wide and spaced 200 μm apart, and using the approximation that most of the transmitted energy is at the fundamental frequency (which for 1 ms pulses is 1/1.0 ms or 1 kHz), the ratio of the voltage delivered to the cells versus the applied voltage is 0.41, compared to 0.9997 ≈ 1 calculated for carbon electrodes. We could apply this approximation to the relative electric fields in each system to adjust the voltage from one system to another.
Examination of current profiles of the ITO array during a 2 ms square-wave pulse shows that the current rapidly diminishes during the first 1 ms of stimulation (Fig. 2C), which is much faster than for carbon electrodes where only about 10% of the current dimishes during 2 ms of stimulation.42 Given the interdependence between stimulus strength and duration when stimulating electrically-excitable cells, the required excitation stimulus should decrease as the stimulation is prolonged.52 We thus might need to adjust the stimulation parameters translated from the carbon rod to the ITO system (for example, when working with neonatal rat cardiomyocytes, 1 ms pulses require about 10% higher amplitude than 2 ms pulses to achieve cell excitation). Despite the attenuation of stimuli longer than 1 ms in the ITO system, there is rationale for applying longer stimuli, as for example biphasic stimulation by the reversal of charge stored in the double layer after the cessation of stimulus (the signal between 2 and 3 ms in Fig. 2C). Studying the effects of biphasic stimulation and determining the length of delay for the complete reversal of charge will need to be addressed in future work. Another area of interest is to investigate the roughnesses of the ITO surface, and reduce the corner frequency of electrodes as has been done for non-biological applications53 (note that the high capacitance of carbon electrodes has been attributed in part to its porous surface42).
The finite-element modeling predicts a constant electric field between the electrodes close to the cell culture (Fig. 3). For the ITO interdigitated electrode system with the carbon electrodes we have used in the past to culture engineered cardiac tissues, we also see constant field between the electrodes, as long as tissue constructs are close to the plane connecting the centers of the electrodes, and placed a few millimeters away from the edges of the electrodes.4 Increasing the fraction of cell culture surface in which the cells are exposed to electric field may provide rationale for using narrower stimulation electrodes, given the high resistance to corrosion of electrodes as narrow as 50 μm. However, the benefit of narrower electrodes must be weighed against the drawbacks of diminished capacitance (attenuating the electric field delivered to the cells), as well as the risk of reaching the resolution threshold for ITO ablation using stainless steel masks. For feature sizes smaller than 50 μm, a chrome-on-quartz mask must be employed. These masks are expensive, easily damaged, and susceptible to accidental application of laser fluence higher than the mask ablation threshold.54
Figure 3. Finite-element modeling.
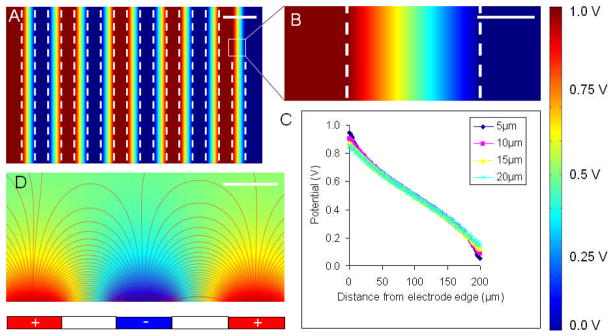
(A,B,D) A colormap of electric potential and (C) potential vs. position plot are shown for an ITO electrode array with 200 μm electrodes and 200 μm spacing with an applied voltage of 1 V. (A) top view of five pairs of positive and negative electrodes. (B) close-up of the space between a single positive and negative electrode (dashed lines indicate electrode edges). (C) plot of potential vs. position at different heights above the glass surface between the electrodes. (D) cross-sectional view of the electrical field lines between electrodes. Scale bars: (A) 300 μm, (B) 100 μm, (D) 200 μm.
Electrical Stimulation of Cardiomyocytes
Neonatal rat cardiomyocytes cultured in the bioreactor with interdigitated ITO electrodes were fully viable after 3 days of continuous pulsatile electrical stimulation, with no apparent adverse effects (Fig. 4A). Nonstimulated cells aggregated more readily than stimulated cells (Fig. 4B). Morphologically, the cells cultured in the presence of pulsatile electric fields were spread and, qualitatively, they appeared to be aligned in the direction perpendicular to the applied electric field, as in previous studies.55 Functionally, an increase in the beating area was associated with an increase in the testing amplitude. At all pacing amplitudes, a higher percent area of cells was beating when cells were electrically stimulated during culture than in nonstimulated controls.
Figure 4. Electrical stimulation of neonatal rat cardiac cells on an ITO electrode array with 180 μm electrodes and 200 μm spacing.
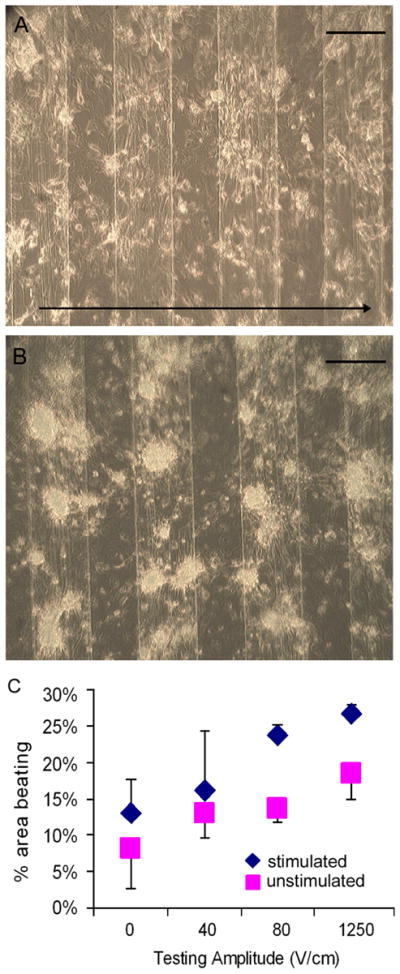
Bright field images of cells at day 4 of culture either with (A) or without (B) electrical stimulation. Arrow in section A shows the direction of the applied electric field. Graph (C) represents the percent area beating per well for cardiac cells cultured with (blue) or without (pink) electrical stimulation for a range of testing stimuli. Scale bar corresponds to 200 μm.
An unanswered question prior to this study was whether the ablated ITO surface might be providing topographical cues to the cultured cells. In previous studies of neonatal rat fibroblasts on abraded surfaces, which used a larger scale Petri-dish based bioreactor fitted with carbon rod electrodes and monolayer cell culture inserts,6 electrical stimulation (i) significantly enhanced cell elongation, and (ii) promoted cell orientation in the direction perpendicular to the field lines when the abrasions were also placed perpendicular to the field lines.6 The lesser elongation of the cells in unstimulated cultures (Fig. 4B) suggests that the elongation of stimulated cells (Fig. 4A) was due to the electrical and not topographical cues. This is consistent with the findings that structures on the order of 1–10 μm have physiological relevance for these cell types.56 In native rat heart, elongated cardiomyocytes are tightly positioned between capillaries (7 μm in diameter) that are spaced 20 μm apart.57
In the system we present here, the 180 μm electrodes are outside this range, and further studies are needed to quantify the presence of any alignment in the non-stimulated case at different electrode spacings and ITO depths. For cells more sensitive to topographical cues, thinner ITO layers are available, although at higher sheet resistance. For studies at lower cell densities, we might need to reduce electrode width, despite the trade-off of lower capacitance.
Electrical Stimulation of hASCs
Human adipose tissue-derived stem cells (hASCs) exposed to a pulsatile electric field from the ITO electrode array proliferated more rapidly (Fig. 5E), had more gap junctions (Fig. 5F) and oriented themselves in a direction more perpendicular to the applied electric field (Fig. 5G) as compared to nonstimulated controls. These results are consistent with the enhanced proliferation and elongation observed for human bone marrow-derived mesenchymal stem cells in an electrical field.58,59 We have also observed the elongation and alignment of hASCs stimulated in DC fields.18 The mechanism of transduction of the electrical signals to the cells is by ion channels, and several types of channels have been found in hASCs, that are associated with delayed rectifier-like K+ current, a Ca2+-activated K+ current, a transient outward K+ current, and a TTX-sensitive transient inward sodium current.60 In addition, hASCs express at the mRNA level the subunits of ion channels and, through transfection, can be directed to express voltage-dependent Ca2+ and K+ channels.61 An interesting question for future work is which of these ion channels are involved in transduction of electrical signals, and if electrical stimulation could drive expression of additonal ion channels. If so, electrical stimulation might be an alternative to the use of mutated cells (such as iPS cells) in order to drive commitment of non-embryonic stem cells into a particular lineage.
Figure 5. Effects of electrical stimulation on hASCs.

(A,B) F-Actin (red) and DAPI (blue) of ASC culture with (A) or without (B) electrical stimulation. (C,D) Connexin-43 (green) and DAPI (blue) of ASC culture with (C) or without (D) electrical stimulation. Arrows in sections A and C show the direction of the applied electric field. Graphs (E, F, G) show (E) the number of measured gap junctions per cell, (F) the number of cells measured per mm2 and (G) the direction of actin fibers for ASCs cultured with (+ES) or without (−ES) electrical stimulation. *represents statistically significant difference (p<0.01). Scale bar corresponds to 100 μm.
Future Work
In its present form, the method we propose can generate micro-scale cell culture surfaces with solely a 20 nm “curl”. An interesting area of future work could be to further refine the ITO ablation (e.g., through the use of a photoresist layer).
In addition, although we observed more alignment in cultures of electrically-stimulated as compared to nonstimulated cells, we cannot rule out the possibility that patterned ITO surface provides additional cues to the cultured cells, either via topography or by possible differential adsorption of proteins to ITO and glass. Another area of future work could thus involve systematic studies of cell phenotype, alignment and elongation for different patterns and thicknesses of ITO substrates, in order to evaluate possible topological effects of the pattern, differential adhesion to glass and ITO, or other effects of the ITO/glass pattern on cell phenotype in the absence of electrical stimulation.
In addition, because ITO lacks transparency in the infrared range,62 there are some applications (e.g. the use of near-infrared flurophores63) for which the patterned ITO presented here would not be suitable. Thin films made of carbon nanotubes might be a solution for work in infrared range,64 and it would be of interest to test the electrical, patterning and cell culture properties of these substrates. Further optimization of electric field parameters for electrical stimulation of ASCs is an important area of ongoing and future work, as well as further evaluation of the phenotypic changes the cells experience during electrical stimulation.
Fabricating electrode arrays with individually addressable electrodes for scanning different electrical stimulation parameters in parallel could present an interesting method to perform studies of spatially-varying electrical fields. Correlations between the regime of stimulation, cell proliferation, orientation, differentiation and ion channel expression would certainly help utilize the potential of electrical stimulation for derivation of excitable cells from various human cell sources.
Conclusions
The bioreactor with interdigitated ITO electrodes described here integrates the use of electrical stimulation for directing cellular organization, and microfluidics that enables miniaturization of the cell culture system. We have developed a platform for cell culture with pulsatile electrical stimulation, and demonstrated its utility in studies of neonatal rat cardiomyocytes and human adipose tissue-derived stem cells. For both cell types, the ITO bioreactor platform could be used to study cell proliferation, differentiation, morphological and phenotype in response to the applied electrical field, in long-term culture with imaging compatibility.
Acknowledgments
The authors thank Jeffrey Gimble for kindly providing human adipose derived stem cells, Dennis Ward for assistance with the excimer laser system, Robert Langer for access to EIS equipment, David Kaplan, Keith Yeager and Elisa Cimetta for many helpful discussions, Timothy Martens and George Eng for harvesting neonatal rat hearts, and Nebojsa Mirkovic for help with the manuscript preparation. The work was funded by NIH (P41 EB002520 and R01 HL076485 to GVN) and the Columbia University Presidential Fellowship (to NT).
References
- 1.Radisic M, Park H, Gerecht S, Cannizzaro C, Langer R, Vunjak-Novakovic G. Philos Trans R Soc Lond B Biol Sci. 2007;362:1357. doi: 10.1098/rstb.2007.2121. [DOI] [PMC free article] [PubMed] [Google Scholar]
- 2.Christman KL, Lee RJ. J Am Coll Cardiol. 2006;48:907. doi: 10.1016/j.jacc.2006.06.005. [DOI] [PubMed] [Google Scholar]
- 3.Radisic M, Park H, Chen F, Salazar-Lazzaro JE, Wang Y, Dennis R, Langer R, Freed LE, Vunjak-Novakovic G. Tissue Eng. 2006;12:2077. doi: 10.1089/ten.2006.12.2077. [DOI] [PubMed] [Google Scholar]
- 4.Tandon N, Cannizzaro C, Chao G, Maidhof R, Radisic M, Vunjak-Novakovic G. Nat Protoc. 2009;4:155. doi: 10.1038/nprot.2008.183. [DOI] [PMC free article] [PubMed] [Google Scholar]
- 5.Radisic M, Park H, Shing H, Consi T, Schoen FJ, Langer R, Freed LE, Vunjak-Novakovic G. Proc Natl Acad Sci U S A. 2004;101:18129. doi: 10.1073/pnas.0407817101. [DOI] [PMC free article] [PubMed] [Google Scholar]
- 6.Au HT, Cheng I, Chowdhury MF, Radisic M. Biomaterials. 2007;28:4277. doi: 10.1016/j.biomaterials.2007.06.001. [DOI] [PMC free article] [PubMed] [Google Scholar]
- 7.Zimmermann WH, Melnychenko I, Wasmeier G, Didie M, Naito H, Nixdorff U, Hess A, Budinsky L, Brune K, Michaelis B, Dhein S, Schwoerer A, Ehmke H, Eschenhagen T. Nat Med. 2006;12:452. doi: 10.1038/nm1394. [DOI] [PubMed] [Google Scholar]
- 8.Zimmermann WKS, Schubert P, Didié M, Münzel F, Heubach JF, Kostin S, Neuhuber WL, Eschenhagen T. Circ Res. 2002;90:223. doi: 10.1161/hh0202.103644. [DOI] [PubMed] [Google Scholar]
- 9.Naito H, Melnychenko I, Didie M, Schneiderbanger K, Schubert P, Rosenkranz S, Eschenhagen T, Zimmermann W-H. Circulation. 2006;114:I–72. doi: 10.1161/CIRCULATIONAHA.105.001560. [DOI] [PubMed] [Google Scholar]
- 10.Yang L, Soonpaa MH, Adler ED, Roepke TK, Kattman SJ, Kennedy M, Henckaerts E, Bonham K, Abbott GW, Linden RM, Field LJ, Keller GM. Nature. 2008;453:524. doi: 10.1038/nature06894. [DOI] [PubMed] [Google Scholar]
- 11.Caspi O, Lesman A, Basevitch Y, Gepstein A, Arbel G, Habib IHM, Gepstein L, Levenberg S. Circ Res. 2007;100:263. doi: 10.1161/01.RES.0000257776.05673.ff. [DOI] [PubMed] [Google Scholar]
- 12.Zimmermann WH, Eschenhagen T. Trends Cardiovasc Med. 2007;17:134. doi: 10.1016/j.tcm.2007.02.007. [DOI] [PubMed] [Google Scholar]
- 13.Planat-Benard V, Menard C, Andre M, Puceat M, Perez A, Garcia-Verdugo JM, Penicaud L, Casteilla L. Circ Res. 2004;94:223. doi: 10.1161/01.RES.0000109792.43271.47. [DOI] [PubMed] [Google Scholar]
- 14.Miyahara Y, Nagaya N, Kataoka M, Yanagawa B, Tanaka K, Hao H, Ishino K, Ishida H, Shimizu T, Kangawa K, Sano S, Okano T, Kitamura S, Mori H. Nat Med. 2006;12:459. doi: 10.1038/nm1391. [DOI] [PubMed] [Google Scholar]
- 15.Zuk PA, Zhu M, Mizuno H, Huang J, Futrell JW, Katz AJ, Benhaim P, Lorenz HP, Hedrick MH. Tissue Eng. 2001;7:211. doi: 10.1089/107632701300062859. [DOI] [PubMed] [Google Scholar]
- 16.Zhang J, Wilson GF, Soerens AG, Koonce CH, Yu J, Palecek SP, Thomson JA, Kamp TJ. Circ Res. 2009;104:e30. doi: 10.1161/CIRCRESAHA.108.192237. [DOI] [PMC free article] [PubMed] [Google Scholar]
- 17.Schenke-Layland K, Rhodes KE, Angelis E, Butylkova Y, Heydarkhan-Hagvall S, Gekas C, Zhang R, Goldhaber JI, Mikkola HK, Plath K, MacLellan WR. Stem Cells. 2008;26:1537. doi: 10.1634/stemcells.2008-0033. [DOI] [PMC free article] [PubMed] [Google Scholar]
- 18.Tandon N, Goh B, Marsano A, Chao P-HG, Montouri-Sorrentino C, Gimble J, Vunjak-Novakovic G. Conf Proc IEEE Eng Med Biol Soc. 2009 doi: 10.1109/IEMBS.2009.5333142. [DOI] [PMC free article] [PubMed] [Google Scholar]
- 19.Gaustad KG, Boquest AC, Anderson BE, Gerdes AM, Colla P. Biochem Biophys Res Commun. 2004;314:420. doi: 10.1016/j.bbrc.2003.12.109. [DOI] [PubMed] [Google Scholar]
- 20.Rangappa S, Fen C, Lee EH, Bongso A, Wei ESK. Ann Thorac Surg. 2003;75:775. doi: 10.1016/s0003-4975(02)04568-x. [DOI] [PubMed] [Google Scholar]
- 21.Bian W, Tung L. Circ Res. 2006;98:29. doi: 10.1161/01.RES.0000209770.72203.01. [DOI] [PubMed] [Google Scholar]
- 22.Kong CR, Bursac N, Tung L. J Appl Physiol. 2005;98:2328. doi: 10.1152/japplphysiol.01084.2004. [DOI] [PubMed] [Google Scholar]
- 23.Sathaye A, Bursac N, Sheehy S, Tung L. J Mol Cell Cardiol. 2006;41:633. doi: 10.1016/j.yjmcc.2006.06.076. [DOI] [PubMed] [Google Scholar]
- 24.Berger HJ, Prasad SK, Davidoff AJ, Pimental D, Ellingsen O, Marsh JD, Smith TW, Kelly RA. Am J Physiol Heart Circ Physiol. 1994;266:H341. doi: 10.1152/ajpheart.1994.266.1.H341. [DOI] [PubMed] [Google Scholar]
- 25.Vunjak-Novakovic G, Tandon N, Godier AF, Martens T, Maidhof R, Marsano A, Radisic M. Tissue Engineering Reviews. 2009 doi: 10.1089/ten.teb.2009.0352. accepted for publication. [DOI] [PMC free article] [PubMed] [Google Scholar]
- 26.Chiu L, Iyer R, King J-P, Radisic M. Tissue Eng, Part A. 2008:14. doi: 10.1089/ten.tea.2007.0244. Epub ahead of print. [DOI] [PMC free article] [PubMed] [Google Scholar]
- 27.Kim H, Gilmore CM, Pique A, Horwitz JS, Mattoussi H, Murata H, Kafafi ZH, Chrisey DB. J Appl Phys. 1999;86:6451. [Google Scholar]
- 28.Hartnagel HL, Dawar AL, Jain AK, Jagadish C. Semiconducting Transparent Thin Films. Taylor and Francis; Bristol: 1995. [Google Scholar]
- 29.Gross GW, Wen WY, Lin JW. J Neurosci Methods. 1985;15:243. doi: 10.1016/0165-0270(85)90105-0. [DOI] [PubMed] [Google Scholar]
- 30.Gross GW, Rhoades BK, Reust DL, Schwalm FU. J Neurosci Methods. 1993;50:131. doi: 10.1016/0165-0270(93)90001-8. [DOI] [PubMed] [Google Scholar]
- 31.Mie M, Ohgushi H, Haruyama T, Kobatake E, Aizawa M. Proceedings of the 18th Annual International Conference of the IEEE; 1996. pp. 2055–2057. [Google Scholar]
- 32.Choi CK, English AE, Jun SI, Kihm KD, Rack PD. Biosen Bioelectron. 2007;22:2585. doi: 10.1016/j.bios.2006.10.006. [DOI] [PubMed] [Google Scholar]
- 33.Bieberich E, Guiseppi-Elie A. Biosens Bioelectron. 2004;19:923. doi: 10.1016/j.bios.2003.08.016. [DOI] [PubMed] [Google Scholar]
- 34.Yang L, Li Y, Erf GF. Anal Chem. 2004;76:1107. doi: 10.1021/ac0352575. [DOI] [PubMed] [Google Scholar]
- 35.Liau J, Dumas J, Janks D, Roth BJ, Knisley SB. Ann Biomed Eng. 2004;32:1202. doi: 10.1114/b:abme.0000039354.41647.1b. [DOI] [PubMed] [Google Scholar]
- 36.Knisley SB, Pollard AE. Am J Physiol Heart Circ Physiol. 2005;289:H1137. doi: 10.1152/ajpheart.00064.2005. [DOI] [PubMed] [Google Scholar]
- 37.Hsiung LC, Yang CH, Chiu CL, Chen CL, Wang Y, Lee H, Cheng JY, Ho MC, Wo AM. Biosens Bioelectron. 2008;24:875. doi: 10.1016/j.bios.2008.07.027. [DOI] [PubMed] [Google Scholar]
- 38.Voldman J. Annu Rev Biomed Eng. 2006;8:425. doi: 10.1146/annurev.bioeng.8.061505.095739. [DOI] [PubMed] [Google Scholar]
- 39.Shah S, Revzin A. J Vis Exp. 2007;7:259. doi: 10.3791/259. [DOI] [PMC free article] [PubMed] [Google Scholar]
- 40.Tandon N, Cannizzaro C, Figallo E, Voldman J, Vunjak-Novakovic G. Conf Proc IEEE Eng Med Biol Soc. 2006;2006:845. doi: 10.1109/IEMBS.2006.259747. [DOI] [PubMed] [Google Scholar]
- 41.Tandon N, Marsano A, Cannizzaro C, Voldman J, Vunjak-Novakovic G. Conf Proc IEEE Eng Med Biol Soc. 2008;2008:3594. doi: 10.1109/IEMBS.2008.4649983. [DOI] [PMC free article] [PubMed] [Google Scholar]
- 42.Cannizzaro C, Tandon N, Figallo E, Park H, Gerecht S, Radisic M, Elvassore N, Vunjak-Novakovic G. In: Methods in Molecular Medicine, Tissue Engineering. Hauser H, Fussenegger M, editors. Humana Press; 2007. p. 291. [DOI] [PubMed] [Google Scholar]
- 43.Norlin A, Pan J, Leygraf C. J Electrochem Soc. 2005;152:J7. [Google Scholar]
- 44.Durand D, Bronzino JD, editors. The Biomedical Engineering Handbook. 1995;Chapter 17:229–251. [Google Scholar]
- 45.Stern HP, Mahmoud SA, Stern LE. Communication Systems : Analysis and Design. Prentice Hall; 2004. pp. 76–88. [Google Scholar]
- 46.Radisic M, Marsano A, Maidhof R, Wang Y, Vunjak-Novakovic G. Nat Protoc. 2008;3:719. doi: 10.1038/nprot.2008.40. [DOI] [PMC free article] [PubMed] [Google Scholar]
- 47.Halvorsen Y, Wilkison W, Gimble J. Int J Obes Relat Metab Disord. 2000;24:S41. doi: 10.1038/sj.ijo.0801503. [DOI] [PubMed] [Google Scholar]
- 48.Teixeira AI, Nealey PF, Murphy CJ. J Biomed Mater Res A. 2004;71A:369. doi: 10.1002/jbm.a.30089. [DOI] [PubMed] [Google Scholar]
- 49.Ashkenasi D, Müller G, Rosenfeld A, Stoian R, Hertel IV, Bulgakova NM, Campbell EEB. Applied Physics A: Materials Science & Processing. 2003;77:223. [Google Scholar]
- 50.Armstrong ANaNR, HOF, editors. Elsevier; Amsterdam: 1988. p. 224. [Google Scholar]
- 51.Folcher G, Cachet H, Froment M, Bruneaux J. Thin Solid Films. 1997;301:242. [Google Scholar]
- 52.Plonsey R, Barr Roger C. Bioelectricity: A Quantitative Approach. Springer Science; New York: 2007. [Google Scholar]
- 53.Kim KB, Tak YH, Han YS, Baik KH, Yoon MH, Lee MH. Jpn J Appl Phys. 2003;42:L438. [Google Scholar]
- 54.Mutapcic E, Iovenitti P, Hayes J. Int J Adv Manuf Tech. 2008 [Google Scholar]
- 55.Zhao M, Forrester JV, McCaig CD. Proc Natl Acad Sci USA. 1999;96:4942. doi: 10.1073/pnas.96.9.4942. [DOI] [PMC free article] [PubMed] [Google Scholar]
- 56.den Braber E, de Ruijter J, Ginsel L, von Recum A, Jansen J. J Biomed Mater Res. 1998;40:291. doi: 10.1002/(sici)1097-4636(199805)40:2<291::aid-jbm14>3.0.co;2-p. [DOI] [PubMed] [Google Scholar]
- 57.Rakusan KB, Growth K. 1982;46:275. [PubMed] [Google Scholar]
- 58.Mooney EJ, Mackle JN, Barry F, O’Brien T, Murphy M, Barron V. Circulation. 2008;118:S_428-c. [Google Scholar]
- 59.Ercan B, Webster TJ. BMES. 2007 Session P4.177. [Google Scholar]
- 60.Bai X, Ma J, Pan Z, Song YH, Freyberg S, Yan Y, Vykoukal D, Alt E. Am J Physiol Cell Physiol. 2007;293:C1539. doi: 10.1152/ajpcell.00089.2007. [DOI] [PubMed] [Google Scholar]
- 61.Bai X, Pinkernell K, Song YH, Nabzdyk C, Reiser J, Alt E. Biochem Biophys Res Commun. 2007;353:665. doi: 10.1016/j.bbrc.2006.12.103. [DOI] [PubMed] [Google Scholar]
- 62.Brewer SH, Franzen S. J Alloys and Compounds. 2002;338:73. [Google Scholar]
- 63.Patonay G, Strekowski L, Raszkiewicz A, Kim JS. Optical Molecular Probes for Biomedical Applications. In: Achilefu SIB, Darryl J, Raghavachari R, editors. Proceedings of the SPIE. Vol. 2006. 2006. p. 70. [Google Scholar]
- 64.Hu L, Hecht DS, Gruner G. Appl Phys Lett. 2009;94:081103. [Google Scholar]