

Abstract
Estrogen-related receptors (ERRs) α, β, and γ are orphan nuclear hormone receptors with no known ligands. Little is known concerning the role of ERRβ in energy homeostasis, since complete ERRβ-null mice die mid-gestation. We generated two viable conditional ERRβ-null mouse models to address its metabolic function. Whole-body deletion of ERRβ in Sox2-Cre:ERRβlox/lox mice resulted in major alterations in body composition, metabolic rate, meal patterns, and voluntary physical activity levels. Nestin-Cre:ERRβlox/lox mice exhibited decreased expression of ERRβ in hindbrain neurons, the predominant site of expression, decreased Neuropeptide Y (NPY) gene expression in the hindbrain, increased lean body mass, insulin sensitivity, increased energy expenditure, decreased satiety, and decreased time between meals. In the absence of ERRβ, increased ERRγ signaling decreased satiety and the duration of time between meals, similar to meal patterns observed for both the Sox2-Cre:ERRβlox/lox and Nestin-Cre:ERRβlox/lox strains of mice. Central and/or peripheral ERRγ signaling may modulate these phenotypes by decreasing NPY gene expression. Overall, the relative expression ratio between ERRβ and ERRγ may be important in modulating ingestive behavior, specifically satiety, gene expression, as well as whole-body energy balance.
Keywords: meal patterns, metabolism, hindbrain, medulla, mice
INTRODUCTION
Nuclear receptors function to maintain homeostasis throughout life by acting as ligand-mediated transcription factors that bind to either natural ligands (e.g., small lipophilic hormones, retinoic acids, vitamins, metabolites) or exogenous ligands (e.g., pesticides, drugs) (Trapp and Holsboer, 1996). Estrogen-related receptor (ERR) α, ERRβ, and ERRγ are orphan nuclear receptors with no known ligand (Giguere, 2008). ERRs were first identified on the basis of sequence homology to estrogen receptor α (Giguere et al., 1988). However, although both bind to the estrogen response element (ERE) to regulate transcription, estrogen is not a ligand for ERRs (Vanacker et al., 1999; Giguere, 2008).
Two members of the ERR family, ERRα and ERRγ, play important roles in metabolism (Giguere et al., 1988; Luo et al., 2003; Bookout et al., 2006). Like ERRα and ERRγ, ERRβ expression levels are high in the retina, liver, adipose tissue, skeletal muscle, and heart (Giguere et al., 1988; Luo et al., 2003; Blackshaw et al., 2004; Bookout et al., 2006; Gofflot et al., 2007; Giguere, 2008). However, unlike the other ERR family members, ERRβ has not been directly investigated for a role in regulation of metabolism. Mice homozygous for targeted mutations of ERRβ die during mid-gestation due to defects in placental development, precluding postnatal analysis of a potential function in maintaining energy homeostasis (Luo et al., 1997). Sox2-Cre:ERRβlox/lox mice, in which ERRβ is deleted from embryonic tissue, survive to adulthood and show defects in both inner ear development and rod photoreceptor survival (Chen and Nathans, 2007; Onishi et al., 2010). While retinal photoreceptors mutant for ERRβ show reduced expression of genes regulating both carbohydrate and fatty acid metabolism (Onishi et al., 2010), whether these cells exhibit metabolic changes relative to wild-type remains unknown. Interestingly, high expression of ERRβ mRNAs in the central nervous system (CNS) is primarily restricted to the hindbrain, including the dorsal vagal complex (Lein et al., 2007), a region important for controlling food intake (Grill and Kaplan, 2002; Grill et al., 2002; Grill, 2006; Hayes et al., 2010). These data led us to ask whether ERRβ also plays a role in maintaining food intake to regulate systemic energy balance and to investigate further the expression profile in the brain.
We have addressed this question by analyzing the behavior and metabolic phenotype for two different lines of conditional mutant mice. The first of these is Sox2-Cre:ERRβlox/lox, in which ERRβ is deleted throughout the developing embryo (Chen and Nathans, 2007; Onishi et al., 2010). We generated a second model, Nestin-Cre:ERRβlox/lox mice, in which ERRβ expression is selectively eliminated in the developing nervous system (Tronche et al., 1999), primarily in the hindbrain due to ERRβ gene expression patterns. Both mutants showed significantly altered metabolism, body composition, body weight, and appetite, highlighting the role of hindbrain neurons in regulation of these processes. Notably, ERRβ is the first gene whose selective deletion in the hindbrain alters intermeal intervals and satiety ratio, providing insight into the CNS pathways that regulate these less understood aspects of ingestive behavior.
MATERIALS AND METHODS
Animals and food intake measurements
Sox2-Cre:ERRβlox/lox and Nestin-Cre:ERRβlox/lox mice were generated and genotyped as previously described (Chen and Nathans, 2007). Adult Sox2:ERRβlox/lox mice were analyzed and Nes-Cre:ERRβlox/lox animals were studied at 1, 3, 7, and 12 months of age. The wild-type Nestin-Cre:ERRβlox/lox mice were litter-mate matched to Nestin-Cre:ERRβlox/lox mice by breeding mice that were heterozygous for the Nestin-Cre and the ERRβ flox allele (e.g. Nestin-Crecre/+;Errβlox/+×Nestin-Crecre/+;Errβlox/+). Wild-type mice consisted of Nestin-Cre and ErrBlox mice and an analysis was conducted to verify that there was no phenotype difference between the mice. All animals were provided. Mice were maintained in a temperature and humidity regulated vivarium, a 12:12 hour light-dark cycle, and had ad libitum access to standard laboratory chow (2018, Harlan-Teklad, Harlan Laboratories, Frederick, MD, USA) and water. The Johns Hopkins University School of Medicine Institutional Animal Care and Use Committee approved all animal procedures and all experimental procedures utilizing animals were performed in accordance with guidelines stated by the National Institute of Health for the Care and Use of Laboratory Animals.
Metabolism, activity, and body composition measurements
Indirect calorimetry was used to assess whole-body metabolic profiles of knockout versus wild-type mice to determine differences in energy expenditure, as well as usage of fat and carbohydrate fuels. Individual indirect calorimeter chambers were used to test mice for metabolic differences (Oxymax, Columbus Instruments, Columbus, OH, USA). Mice were adapted to chambers 24 hours prior to the start of the experiment, with data acquisition for 4 days on ad libitum chow access, followed by one day of fasting and one day of refeeding. Data was reported as an average over each day for metabolic measurements for each subject. Oxymax software (V.4.03) allowed for sampling of oxygen and carbon dioxide levels across each chamber every 15 minutes. Rates of oxygen consumption (VO2 ml/FFM/hr, rate of oxidative metabolism) (FFM – fat free mass) and carbon dioxide production (VCO2) were reported. Oxymax software calculated the respiratory exchange ratio (RER = VCO2/ VO2) to estimate relative oxidation of carbohydrate (RER = 1.0) versus fat (RER = 0.7), not accounting for protein oxidation. The caloric value (CV: 3.815 + [1.232×RER]) multiplied by VO2 provided an estimate rate of energy expenditure (EE, kCal/FFM/hr). Body composition was determined using a whole-body NMR machine (EchoMRI, Waco, TX), which provided values for fat mass, fat-free mass (e.g. lean mass), and water content. To measure locomotor activity, mice were placed in open-field test chambers for two days. The open field test chambers emitted infrared beams across the open field from sensor panels and consisted of a 40 cm×40 cm×30 cm plexiglass chamber (Digiscan, Accuscan Instruments, Columbus, OH, USA). The detected beam interruptions were counted and resulting data were used to measure changes in locomotor activity between the groups. Results are presented as the average for a 24-hour period of time on the second day.
Meal pattern analysis and DY131 injection
Analysis of meal patterns was performed and all groups received ad libitum access to pellets (20mg pellet). Meal patterns were measured for 4-6 consecutive days, with food intake and body weight measurements taken daily at the same time each day. The meal patterns were measured for multiple days to allow the mice to acclimatize to the cage and feeding apparatus, to minimize spillage of pellets and to allow for consistent food intake. Sox2-Cre:ERRβlox/lox mice and wild-type mice were provided five days to acclimatize to the cages due to heightened behavioral activity, whereas the Nes-Cre:ERRβlox/lox mice were allowed two days to acclimatize to the cage and feeding apparatus. At the same time each day, the amount of pellets spilled was counted for each mouse and total spillage was subtracted from total amount of pellets consumed. Data were averaged over the last 24-hour period and presented in the figures. Meal patterns were compared between genotypes. The cages (8 in×8 in plexiglass) contained a nest box, an opening to a pellet dispenser and an infrared device to detect the presence of the pellet (Coulbourn Instruments, Allentown, PA, USA). Removal of pellet sent a signal to a connected computer, which recorded the number of pellets consumed during 5 minute intervals (Med Associates, Inc. Software, St. Albans, VT, USA). A meal was determined to start when 5 pellets were removed and the meal terminated when 10 minutes elapsed with no feeding. DY131 (# 2266, Tocris, Bristol, United Kingdom) was injected via an intraperitoneal injection (i.p.) just prior to lights off, for 30 consecutive days, at the dose of 10µM/g body weight. Food intake, body weight and meal patterns were measured exactly as described above for four consecutive days during the course of the treatment. Food was removed 2-hours prior to sacrificing the DY131 injected mice, with collection of hypothalami occurring 4-hours prior to the onset of the dark cycle. Meal patters were analyzed using the Tongue Twister program (T.A. Houpt, Florida State University, Tallahassee, FL, USA).
RNA extraction and quantitative real-time PCR
The hindbrain region was dissected in phosphate buffered saline solution, with collection of the brain region occurring 4-hours prior to the onset of the dark cycle. RNA from whole hindbrain tissue was extracted using RNeasy Midi kits (Qiagen, Valencia, CA, USA) and quantified using a Nanodrop 1000 spectrophotometer (Thermo Scientific, Waltham, MA, USA). Using 1 µg of RNA, cDNA was synthesized using Superscript II reverse transcriptase (Invitrogen) and random primers (Invitrogen), as previously described (Byerly et al., 2009). Using quantitative real-time PCR SYBR green master mix from Applied Biosystems (Life Technologies, Carlsbad, CA, USA), mRNA levels were quantified and the output provided a Ct value for the threshold cycle. As described previously, ΔCt value was calculated by normalizing the data to 18S and the ΔΔCt value was generated by normalizing the data to control animals (Byerly et al., 2009). The following primer pairs were used for the analysis: ERRβ fwd – AACCGAATGTCGTCCGAAGAC, ERRβ rev – GTGGCTGAGGGCATCAATG; NPY fwd – ATGCTAGGTAACAAGCGAATGG, NPY rev – TGTCGCAGAGCGGAGTAGTAT; proopiomelanocortin (POMC) fwd – ATGCCGAGATTCTGCTACAG, POMC rev – TGCTGCTGTTCCTGGGGC; 18S fwd – GCAATTATTCCCCATGAACG and 18S rev- GGCCTCACTAAACCATCCAA.
Insulin tolerance test, glucose tolerance test, and blood chemistry
In order to perform the insulin tolerance test (ITT), blood glucose measurements were taken just prior to an insulin injection (1.0 unit/kg of body weight) and at the following time points: 15, 30, 45, 60, and 90 minutes. ITT was performed using 7-month-old mice that were fasted for 3 hours prior to baseline collection, with the first blood glucose measurement starting at 6 hours prior to lights out. If blood glucose levels dropped below 30 mg/dL for any mouse, the collection of data was terminated and to prevent hypoglycemia 200 µl of 10% glucose was provided i.p. injection. The glucose tolerance test (GTT) was performed after a 6-hour fast using 7-month-old mice. Food was removed at lights on and baseline blood glucose measurements taken 6 hours later. Glucose was administered to each mouse at a dose of 10 µl/10% glucose per g body weight. Blood glucose measurements were taken at 15, 30, 60, 120, and 180 minutes following delivery of the glucose, with food being returned to the mice after the last time point.
Mathematical modeling for insulin sensitivity
Insulin and glucose levels provided during the glucose tolerance test allowed us to utilize the minimal model approach to determine insulin sensitivity (Bergman et al., 1979; Bergman et al., 1981; Caumo et al., 2000; Breda et al., 2001; Cobelli et al., 2007). The following area under the curve formula was used to fit the data–gathered from the glucose tolerance test and determine the insulin sensitivity index (SI(GTT)) (Caumo et al., 2000; Breda et al., 2001):
The nomenclature in this formula represents the following: G - plasma glucose concentration, ΔG - the glucose concentration above baseline, ΔI - insulin concentrations above baseline, ΔG(t) is equal to g(t)-g(basal), the area under the curve (AUC), GE - glucose efficiency (equal to 0.024) (Caumo et al., 2000), f - fraction of the glucose taken up and was set to 1, DGTT - dose of the glucose/ body weight (10 µl of 10% glucose per g body weight) (Caumo et al., 2000; Breda et al., 2001). The area under the curve is determined using the trapezoid rule from time 0-t (Caumo et al., 2000).
In situ hybridization, MPSS and microarray
In order generate the riboprobes for in situ hybridization (ISH), the cDNA plasmids for POMC and NPY were purified according to manufacturer’s protocol using a DNA miniprep kit (K2100-10, Invitrogen, Carlsbad, CA, USA). T3 or T7 RNA polymerase (Roche) was used to synthesize the probe (2 hours at 37° C), checked on a denaturing gel, and then be purified using LiCl precipitation. Brains were fresh frozen in OCT compound and stored at −80° C. Minor modifications were made to the previously published ISH protocol as follows (Blackshaw and Snyder, 1997): coverslips were removed after hybridization and incubated twice in 0.2x SSC at 65° C for 30 minutes. After this, slides were washed for 5 minutes in 0.2x SSC then for 5 minutes in 0.1M Tris (pH 7.5) and then blocked for 1-hour with 0.1% HISS, 0.1M Tris (pH 7.5) and 0.15M NaCl. ISH images for ERRβ and ERRγ ISH data were obtained and published under the terms of use for the Allen Brain Institute (Lein et al., 2007; http://mouse.brain-map.org/, 2012). Data for the whole-genome correlation analysis using ISH for the medulla of the hindbrain, was obtained and published under the terms of use for the Allen Brain Institute (Lein et al., 2007; http://mouse.brain-map.org/, 2012). Microarray data was conducted and verified via ISH as previously described (Blackshaw et al., 2010; Shimogori et al., 2010). Massively parallel signature data (MPSS) data was obtained using the GEO accession number (GSE1581).
Statistical analysis
Repeated measures ANOVA with a Fisher post-hoc analysis (Statistica, v.8.0, Tulsa, OK, USA), a one-way ANOVA, or a student’s t-test were the statistical tests utilized to determine differences between the groups. For all statistical tests p< 0.05 was considered significant and the values reported in the figures represent means ± SEM.
RESULTS
Sox2:ERRβlox/lox mice have altered body weight, body composition, metabolism, locomotor activity levels, and meal patterns
To explore the potential role of ERRβ in regulating energy balance, we investigated the phenotype of Sox2-Cre:ERRβlox/lox mice, in which ERRβ expression is absent from early embryonic stages. Sox2-Cre has been shown to elicit highly efficient recombination within epiblast cells and their descendents, allowing germ-line deletion of ERRβ, (Hayashi et al., 2002) and conditional mutants using the Sox2-Cre are known to exhibit a phenotype that resembles conventional null mice (Feng et al., 2008). By 9 months of age, Sox2-Cre:ERRβlox/lox mice on a standard laboratory chow diet had lower body weights relative to age-matched wild-type mice [F1,10=32.57, P=0.001] (Figure 1a). Lower body weight in Sox2-Cre:ERRβlox/lox mice was due primarily to a decrease in fat mass [F1,10=46.53, P=0.001] (Figure 1b). The Sox2-Cre:ERRβlox/lox mice also had a modest but significant decrease in fat free mass (FFM) [F1,10=6.21, P=0.037] (Figure 1c), which is most likely due to the 8 gram difference in body weight between the two groups. A reduction in adiposity in Sox2-Cre:ERRβlox/lox mice may result from an increase in voluntary physical activity levels. Indeed, we observed an increase in locomotor activity in knockout mice relative to wild-type controls [t6=3.03, P=0.038] (Figure 1d). As expected, increased physical activity in Sox2-Cre:ERRβlox/lox mice led to an overall increase in whole-body metabolic rate, with increased VO2 [F1,10=16.82, P=0.003], VCO2 [F1,10=12.42, P=0.008], and increased energy expenditure [F1,10=15.02, P=0.004] (Figures 1e, f and h, respectively). All metabolic data were normalized to fat free mass (FFM). There was no observed change in respiratory exchange ratio [F1,10=1.91, P=0.20] (RER, Figure 1g).
Figure 1.

Whole-body deletion of ERRβ altered systemic energy balance. Sox2-Cre:ERRβlox/lox mice have decreased a) body weight, b) fat mass and c) lean mass relative to wild-type (WT) mice. d) Physical activity levels, e) VO2 and f) VCO2 are increased, with no change in g) respiratory exchange ratio (RER), and an increase in h) whole-body energy expenditure in Sox2-Cre:ERRβlox/lox mice relative to WT. i) Physical activity over 22-hour period of time presented in 2-hour blocks [repeated measures ANOVA, fisher post-hoc: F1,16=16.82, P<0.05]. j–k) Measurements for whole-body metabolism for blocks 14 and 16, which coincided with 4–8 hours after the light cycle began. Sox2-Cre:ERRβlox/lox mice exhibited increased j) VO2 and k) energy expenditure, relative to WT mice. Data shown are mean ± SEM for each group (n=4–6/genotype). * Denotes significant difference, p<0.05.
In order to further determine whether physical activity levels contributed toward alterations in whole-body energy balance in the Sox2-Cre:ERRβlox/lox mice, we plotted physical activity levels over the course of a day and observed that there were no differences in activity levels between the groups 4–8 hours after initiation of the light cycle [4–6 hours: t6=1.41, P=0.23; 6–8 hours: t6=1.58, P=0.18] (Figure 1i). In fact, the duration of time with no differences in activity between the groups falls within a time period that also allows for basal metabolic rate to be potentially determined, since the requirements for determining basal metabolic rate are rest and no consumption of food. During this same time period, 4–8 hours after initiation of the light cycle, we also measured differences in whole-body metabolic rate between the Sox2-Cre:ERRβlox/lox mice and wild-type littermates. Sox2-Cre:ERRβlox/lox mice had increased respiratory exchange ratio [F1,10=7.07, P=0.03] (RER, Figure 1g), due to increased VO2 [F1,10=8.98, P=0.02] and VCO2 [F1,10=5.98, P=0.044] (data not shown), and increased energy expenditure (EE) [F1,10=9.15, P=0.016] (Figure 1k). These data indicate that whole-body deletion of ERRβ results in major alterations in energy homeostasis that remain when the mice are not physically active.
Food intake is tightly coupled to overall energy balance. In the absence of ERRβ, these highly active mice also consumed a greater number of pellets [F1,10=36.52, P=0.001] (Figure 2a). The macrostructure of food intake was also altered, suggesting that ERRβ can regulate behavior associated with food ingestion. Sox2-Cre:ERRβlox/lox mice elicited new patterns of food intake relative to wild-type mice over a 24-hour period, with decreased time between meals [F1,14=4.96, P=0.047] (Figure 2b, intermeal interval, IMI), decreased intermeal satiety ratio [F1,14=15.25, P=0.002] (Figure 2c, defined as the duration of satiety between meals, intermeal interval relative to meal size), intrameal satiety ratio [F1,14=7.85, P=0.017] (Figure 2d, defined as the number of pellets consumed in a minute), and a no change, but a slight overall increase, in meal size [F1,14=1.51, P=0.24] (Figure 2e) and meal number [F1,14=2.30, P=0.15] (Figure 2f).
Figure 2.

Whole-body deletion of ERRβ altered food intake and meal patterns. Sox2-Cre:ERRβlox/lox mice compared to wild-type (WT) consume more a) total food pellets, show a decreased time between meals; b) intermeal interval, and have a decreased c) satiety ratio: intermeal and d) intra-meal, and no change in e) meal size or f) meal number (n=6–8/genotype). Data shown are mean ± SEM for each group.* Denotes significant difference, p<0.05.
To further elucidate the underlying physiological process regulating meal patterns in the Sox2-Cre:ERRβlox/lox mice, we decided to apply the weibull test. The weibull test analyzes the microstructure of a meal by fitting a mathematical equation (y = Aexp[(-Bt)c]) to a meal (Rushing et al., 1997; Fox and Byerly, 2004). We analyzed the initial rate of intake (A), which is regulated primarily by positive feedback such as oropharyngeal stimulation. We also analyzed the rate at which intake declined (B), which is regulated by negative feedback arising from vagal afferent signals arising from the periphery (Smith, 1996; Rushing et al., 1997). The weibull function revealed that Sox2-Cre:ERRβlox/lox had increased positive feedback [F1,9=8.07, P=0.02] (A: WT – 3.5±0.24, Sox2-Cre:ERRβlox/lox – 5.01±0.33) and no change in negative feedback [F1,9=0.97, P=0.36] (B: WT – 0.012±0.004, Sox2-Cre:ERRβlox/lox – 0.007±0.0001), relative to WT mice. These results demonstrate that Sox2-Cre:ERRβlox/lox mice have alterations in the oropharyngeal component underlying the microstructure of meals, and most likely not a peripheral component associated with vagal afferent signalling, which suggests that ERRβ signalling in the central nervous system may modulate meal patterns.
Decreased ERRβ expression in the hindbrain alters NPY gene expression, locomotor activity levels, body composition, meal patterns, and fasting-induced food intake
Major alterations in whole-body metabolism, voluntary physical activity levels, and meal patterns in Sox2-Cre:ERRβlox/lox mice indicate that ERRβ regulates multiple aspects of energy homeostasis. To determine whether loss of neurally-expressed ERRβ might be causing the observed changes reported in Sox2-Cre:ERRβlox/lox mice, we generated a neural-specific loss-of-function of ERRβ by crossing ERRβ-floxed mice with Nestin-Cre mice, which specifically express Cre recombinase in neural progenitors (Dubois et al., 2006). The resulting Nes-Cre:ERRβlox/lox mice did not exhibit circling behavior or the vestibular defects seen in Sox2-Cre:ERRβlox/lox animals (Chen and Nathans, 2007). Both massively parallel signature sequencing (MPSS) (Figure 3a; medulla - 9 out of 4,276,308 tags, pons – 20 out of 4,613,817 tags, hypothalamus – 0 out of 4,307,909 tags, and eye – 337 out of 4,075,553 tags) and microarray data (Figure 3d–k; Shimogori, et al. 2010)) show that ERRβ mRNA is primarily expressed in the hindbrain. In situ hybridization analysis further confirmed that ERRβ mRNA was only detected in the hindbrain (Figure 3b and c) (Gofflot et al., 2007; Lein et al., 2007; Shimogori et al., 2010), the resulting Nes-Cre:ERRβlox/lox mice thus allowed us to address the contribution of ERRβ-expressing neurons in the hindbrain to regulating food intake and whole-body energy balance. We also utilized microarray technology to verify the absence of ERRβ gene expression in the hypothalamus. We utilized hypothalmi from developing mice starting at embryonic day (e) 11 until e18, and in postnatal animals P0 until P42. There were no detectable levels of ERRβ (Figure 3d) gene expression in the hypothalamus during development or in the adult animal. Our results are consistent with the lack of ERRβ gene expression in the hypothalamus during development as reported by genepaint resource (Visel et al., 2004). Our array data also confirmed the absence of constitutive androstane receptor (Car/NR1I3), pregnane X receptor (Pxr/NR1I2), and peroxisome proliferator activated receptor alpha (PPAR-α) in the hypothalamus (Figure 3e–g), three of the genes that are known not to be expressed in either the CNS or hypothalamus (Bookout et al., 2006; Gofflot et al., 2007). In contrast, our array data confirmed the expression of neuropeptide genes (POMC, agouti related protein - AgRP, NPY, cocaine and amphetamine regulated transcript - CART) known to be expressed in the hypothalamus (Fig. 3h–k).
Figure 3.
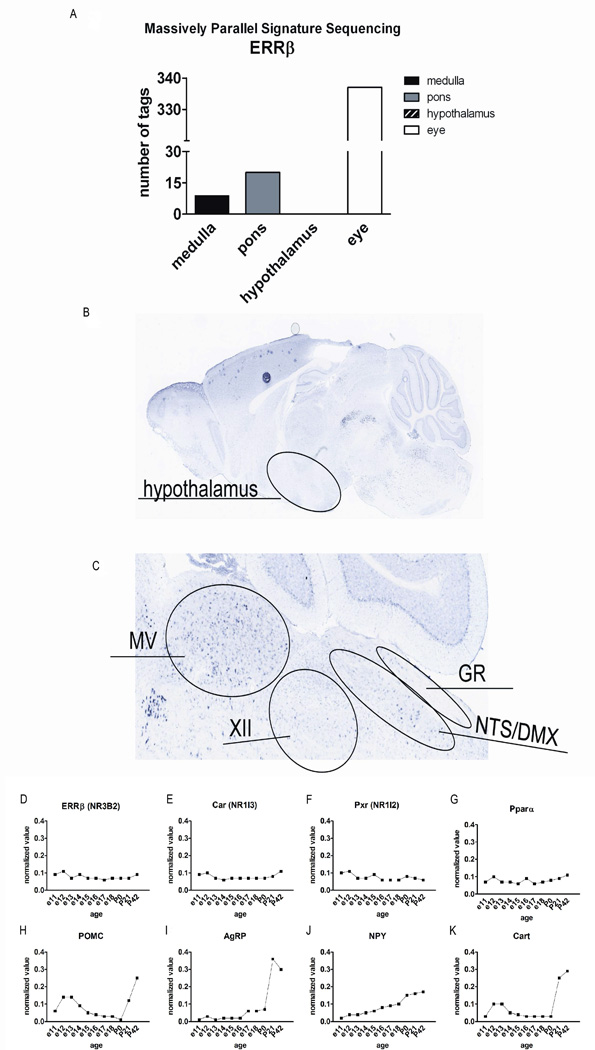
Expression analysis for ERRβ in the brain. a) Massively parallel signature sequencing expression data from mouse nervous system reveals that ERRβ is enriched in eye and hindbrain, but absent from hypothalamus. Data is obtained from GEO reference series GSE1581. b) ERRβ gene expression is primarily located in the hindbrain, and not in the hypothalamus (image credit: Allen Institute for Brain Science). c) Hindbrain ERRβ gene expression is present in the nuclei known to modulate food intake, the dorsal vagal complex (NTS/DMX), as well as other hindbrain nuclei (image credit: Allen Institute for Brain Science). d–k) Developmental microarray analysis of the hypothalamus, from embryonic day (e) 11 until postnatal day (P) 42. d) ERRβ gene expression is not present in the hypothalamus during development or in the adult. The results were confirmed by comparing gene expression levels to genes identified to have no expression in the CNS, e) Car (NR1I3) and f) Pxr (NR1I2), or in the hypothalamus, g) Pparα. h-k) Positive controls for genes known to be expressed in the hypothalamus.
Since alterations in whole-body metabolism and meal patterns were observed in Sox2-Cre:ERRβlox/lox mice, we examined expression levels for several genes in the hindbrains of Nes-Cre:ERRβlox/lox mice, specifically ERRβ and two hindbrain neuropeptides known to modulate energy balance and food intake, NPY and POMC. Hindbrain ERRβ mRNA levels were reduced by 60% in Nes-Cre:ERRβlox/lox mice relative to wild-type animals [F1,11=7.71, P=0.02] (Figure 4a). In addition, we observed a 48% decrease in hindbrain NPY mRNA levels in Nes-Cre:ERRβlox/lox mice relative to wild-type [F1,11=5.28, P=0.04], with no difference in the levels of POMC [F1,11=0.15, P=0.71] (Figures 4b and c, respectively). These data indicate that ERRβ deletion in the CNS preferentially affects neuropeptide gene expression in the hindbrain.
Figure 4.

Nestin-cre deletion of ERRβ altered hindbrain NPY mRNA levels, body weight, physical activity levels, and lean mass. Nes-Cre:ERRβlox/lox mice have a) decreased ERRβ gene expression, b) reduced NPY mRNA levels, and c) no change in POMC mRNA levels relative to wild-type mice in the hindbrain (WT) (n=5–6/genotype). d) Nes-Cre:ERRβlox/lox mice have increased body weight at 3, 7, and 12 months of age relative to wild-type mice (n=5–8/genotype). e) Nes-Cre:ERRβlox/lox mice have increased physical activity levels relative to wild-type (WT) mice at 1 and 12 months of age. f) Fat mass is not altered in Nes-Cre:ERRβlox/lox relative to wild-type mice. g) Lean mass is increased in Nes-Cre:ERRβlox/lox relative to wild-type mice at 12 months of age. (n=6/genotype). Data shown are mean ± SEM for each group. * Denotes significant difference, p<0.05.
At one month of age, Nes-Cre:ERRβlox/lox mice on a standard laboratory chow diet displayed equivalent body weight relative to control littermates [F1,13=0.18, P=0.80] (Figure 4d). However, by 3, 7, and 12 months of age the Nes-Cre:ERRβlox/lox mice had increased body weight relative to the wild-type mice [3 months: F1,15=186.51, P=0.001, 7 months: F1,9=10.88, P=0.01, 12 months: F1,11=6.90, P=0.03] (Figure 4d). The lack of change in body weight in one-month-old Nes-Cre:ERRβlox/lox mice could potentially be attributed to enhanced energy expenditure from elevated locomotor activity levels [t8=3.98, P=0.01] (Figure 4e). By twelve months of age, elevated physical activity was still present in Nes-Cre:ERRβlox/lox mice compared to wild-type mice [t8=2.59, P=0.03] (Figure 4e). Mice with a neural-specific deletion of ERRβ had no change in fat mass and increased fat-free mass (FFM) at 12 months of age [fat mass: F1,11=0.05, P=0.82, fat-free mass: F1,11=12.35, P=0.01] (Figures 4f and g, respectively); the increased FFM could provide an explanation for the increased body weight observed in Nes-Cre:ERRβlox/lox mice.
We then examined the macrostructure of food intake in the Nes-Cre:ERRβlox/lox mice. There was no difference in total food intake consumed between Nes-Cre:ERRβlox/lox and WT mice [F1,12=0.02, P=0.90] (Figure 5a). As with Sox2-Cre:ERRβlox/lox animals, mice with a neuron-specific deletion of ERRβ also showed a similar decrease in intermeal interval and intermeal satiety ratio relative to wild-type mice [IMI: F1,12=9.87, P=0.01, intermeal satiety ratio: F1,12=6.97, P=0.02] (Figures 5b and c, respectively), with no change in meal number [F1,12=0.58, P=0.46] (Figure 5d). Due to a modest reduction in meal size, the Nes-Cre:ERRβlox/lox mice were able to compensate for their lower intermeal interval (i.e., the mice eat more frequently) and satiety ratio, which did not result in overall changes in total amount of food consumed [F1,13=0.16, P=0.69] (Figures 5e and a, respectively). In addition, prior to, during and after a 24-hour fast, adult Nes-Cre:ERRβlox/lox mice showed alterations in whole-body metabolism. Nes-Cre:ERRβlox/lox mice significantly increased RER [fed: F1,10=8.62, P=0.02, re-fed: F1,10=18.12, P=0.003] (Figure 5f) and increased energy expenditure during the fed state [fed: F1,10=7.39, P=0.03] (Figure 5g). Again, we examined the microstructure of a meal utilizing the weibull function and determined that there was no change in any of the weibull parameters for the Nestin-Cre:ERRβlox/lox mice, relative to WT mice [F1,13=2.52, P=0.15] (A: WT – 4.28±0.90, Nestin-Cre:ERRβlox/lox – 1.93±0.53) and no change in negative feedback [F1,13=1.02, P=0.34] (B: WT – 2.09±0.71, Nestin-Cre:ERRβlox/lox – 0.082±0.73). This suggests that Nestin-Cre:ERRβlox/lox mice have an alteration that regulates the macrostructure of food intake, but not the microstructure, and that peripheral vagal afferent signalling modulating food intake in the Nestin-Cre:ERRβlox/lox mice is likely not altered. Although it remains to be determined whether efferent vagal signalling associated with this system is altered.
Figure 5.

Neural progenitor-specific deletion of ERRβ altered meal patterns and whole-body metabolism. a) Total food intake was not different between WT and Nes-Cre:ERRβlox/lox mice. b) Intermeal interval (IMI) and c) satiety ratio were decreased in Nes-Cre:ERRβlox/lox mice (n=4) relative to wild-type (WT) mice (n=8). There is no change in d) meal number, but there was a trend for decreased e) meal size between Nes-Cre:ERRβlox/lox and WT mice. f-g) Nes-Cre:ERRβlox/lox mice (n=5/genotype) show a trend toward increased f) respiratory exchange ratio and g) energy expenditure during fed and re-feeding states, but not during a fasted state. Data shown are mean ± SEM for each group.* Denotes significant difference, p<0.05. # Denotes p-value = 0.053.
Differences between the Nestin-Cre and ErrBloxmicewere analyzed, which were designatedWT mice. We did not observe any significant difference in total food intake, or the macrostructure of meal patterns between Nestin-Cre and ErrBloxmice. Specifically, there was no significant change between the two groups for any of the following parameters: total pellet consumption [F1,10=0.07, P=0.80] (ErrBlox: 250±32, Nestin-Cre: 255±48), [F1,10=1.13, P=0.31] intrameal satiety ratio (ErrBlox: 6.8±0.79, Nestin-Cre: 6.6±0.48), [F1,10=4.48, P=0.10] intermeal interval (ErrBlox: 69.9±7.7, Nestin-Cre: 48.2±4.8) and meal size [F1,10=4.85, P=0.06] (ErrBlox: 15.6±2.1, Nestin-Cre: 10.7±2.0).
CNS-specific deletion of ERRβ enhances peripheral tissue insulin sensitivity
To determine whether glucose tolerance was altered in Nes-Cre:ERRβlox/lox mice, blood glucose and insulin levels were measured during a glucose tolerance test (GTT). Mice were initially fasted for six hours, with no differences observed in fasting blood glucose concentrations between wild-type and Nes-Cre:ERRβlox/lox mice [F1,8=2.22, P=0.18] (Figure 6a, baseline). A bolus of glucose (1 g/kg of body weight) was given to each mouse via intraperitoneal route, and blood glucose concentrations were measured at 15, 30, 60, 120, and 180 minutes post injection. Nes-Cre:ERRβlox/lox mice showed enhanced glucose clearance from the blood into peripheral tissues at 60 minutes following glucose injection [F1,8=4.32, fisher post-hoc: 60 minutes - P=0.02] (Figure 6a) and no difference in cumulative glucose disposal as indicated by the area-under-the curve [F1,8=1.61, P=0.25] (Figure 6b).The rate of glucose disposal in the peripheral tissues depends on the magnitude of insulin secretion from the pancreatic β cells and/or tissue insulin sensitivity. Insulin levels were actually lower in Nes-Cre:ERRβlox/lox mice compared to wild-type mice at 30 min post glucose injection [F1,8=6.11, P=0.04] (Figure 6c), suggesting that Nes-Cre:ERRβlox/lox mice may have greater insulin sensitivity in peripheral tissues.
Figure 6.

Neuron-specific deletion of ERRβ altered insulin sensitivity during insulin and glucose tolerance test. a-b) 7-month-old Nes-Cre:ERRβlox/lox mice (open symbol) have a greater a) glucose tolerance relative to WT mice (closed symbol), with no overall difference in glucose disposal as indicated by the b) area-under-the-curve. In the course of the GTT, Nes-Cre:ERRβlox/lox mice showed reduced c) insulin levels compared to WT mice at 30 minutes after glucose administration, suggesting greater insulin sensitivity in the Nes-Cre:ERRβlox/lox mice. d) ITT test confirmed Nes-Cre:ERRβlox/lox have increased insulin-stimulated glucose uptake, and an overall decrease as indicated by the e) area-under-the-curve. f) GTT and insulin data were used to estimated insulin sensitivity using the classic minimal model, and Nes-Cre:ERRβlox/lox mice demonstrated increased insulin sensitivity relative to WT mice. (n=4/genotype) Data shown are mean ± SEM for each group.* Denotes significant difference from all other groups, p<0.05.
To further determine whether Nes-Cre:ERRβlox/lox mice are indeed more insulin sensitive, we performed an insulin tolerance test (ITT). Nes-Cre:ERRβlox/lox mice demonstrated an overall greater insulin-stimulated glucose clearance at 15, 30, 45, 60, and 90 min after insulin injection [F1,8=4.74, fisher post-hoc: 45 minutes - P=0.02, 60 minutes - P=0.04, 120 minutes - P=0.02] (Figure 6d). The cumulative glucose disposal stimulated by insulin was significantly greater in Nes-Cre:ERRβlox/lox mice compared to wild-type controls [F1,8=41.0, P=0.0001] (Figure 6e), since the greater rate of insulin-stimulated glucose uptake resulted in lower blood glucose levels.
To further confirm that Nes-Cre:ERRβlox/lox mice having greater insulin sensitivity, we utilized mathematical modeling to estimate insulin sensitivity (Bergman et al., 1979) by applying the minimal model analysis to glucose and insulin levels obtained during a glucose tolerance test (Muniyappa R, 2008). The classic minimal model used to determine insulin sensitivity has been shown to highly correlate with results provided by the hyperinsulinemic clamp (Breda et al., 2001). Glucose and insulin levels were determined at the same time point during the glucose tolerance test (Figure 6a and c). The data were fit to the area under the curve mathematical model (see Methods) as previously described (Bergman et al., 1979; Bergman et al., 1981; Caumo et al., 2000; Breda et al., 2001; Cobelli et al., 2007). The results of this analysis confirmed that Nes-Cre:ERRβlox/lox do indeed have increased insulin sensitivity relative to WT mice [t8=2.13, P=0.04] (Figure 6f).
Enhanced ERRγ function in modulating food intake when ERRβ gene expression is absent or diminished
Members of the ERR family recognize similar transcriptional response elements, and exogenous ligands sometimes activate more than one ERR isoform, suggesting that they may have overlapping roles to regulate physiological processes. We investigated ERRγ gene expression in the hindbrain using in situ hybridization and revealed that ERRγ is expressed in the same hindbrain nuclei as ERRβ (Figure 7a). We then confirmed overlapping regions of gene expression patterns for ERRβ and ERRγ by running a correlational analysis in the medulla of the hindbrain by utilizing a whole-genome ISH resource(Lein et al., Jan 11; http://mouse.brain-map.org/). The results of this analysis determined that the region of gene expression in the medulla for ERRβ and ERRγ highly correlate with one another (0.715) (Lein et al., Jan 11; http://mouse.brain-map.org/). In fact, ERRγ ranked number 11 out of 1295 genes in total that correlated with ERRβ gene expression. The gene that had the highest expression pattern with ERRβ had a correlation constant of 1.0, and the second highest gene had a correlation constant of 0.83, whereas ERRγ ranked number 11 with a correlation constant of 0.715 (Lein et al., Jan 11; http://mouse.brain-map.org/). Given this, we hypothesized that ERRγ signalling may regulate meal patterns in the absence, or decreased expression, of ERRβ. We demonstrated that Nes-Cre:ERRβlox/lox mice have increased ERRγ gene expression, relative to ERRβ, in the hindbrain, whereas wild-type mice express the same levels of ERRγ relative to ERRβ (WT - ERRγ:ERRβ expression ratio equal to 100, 1:1, Figure 7b).
Figure 7.

DY131 activated ERRγ singaling is able to modulate meal patterns in a manner similar to ERRβ deficient mice. a) ISH of ERRγ gene expression in the hindbrain (image credit: Allen Institute for Brain Science). b) The ratio of ERRγ to ERRβ receptor activation is increased in DY131 treated mice. We also observed a similar trend in gene expression for Nes-Cre:ERRβlox/lox mice, suggesting a pharmacological comparison. Sox2-Cre:ERRβlox/lox lack complete ERRβ gene expression, therefore a ratio of expression cannot be provided (NA). c) DY131 increased total food intake in WT mice and in mice lacking complete expression of ERRβ (Sox2-Cre:ERRβlox/lox). d) DY131 activation of both ERRβ and ERRγ did not alter IMI in WT mice. However, under ERRβ deficient conditions, ERRγ activation was able to decrease IMI to a similar level as observed in Nes-Cre:ERRβlox/lox mice. e-f) DY131 decreased inter and intrameal satiety ratio in WT mice, as well as in mice with a whole body deficiency of ERRβ, a satiety level similar to that observed in Nes-Cre:ERRβlox/lox mice. (n=6-9/genotype) Data shown are mean ± SEM for each group.* Denotes significant difference from all other groups, p<0.05.
Very few commercially available ERR agonists have been developed to target only one ERR isoform, and there are currently no ERRγ specific drugs available. DY131 is an agonist specific for both ERRβ and ERRγ, with DY131 activating ERRγ signalling with greater efficiency than ERRβ (Yu and Forman, 2005). ERRγ gene expression is increased relative to ERRβ in both the Nes-Cre:ERRβlox/lox and DY131 preferentially activates ERRγ over ERRβ in a similar ratio as that observed in the Nes-Cre:ERRβlox/lox mice (173.6 versus 143.6 respectively, see Figure 7b). The ratio of the ERRγ:ERRβ gene expression in the Nes-Cre:ERRβlox/lox mice is represented primarily for clearer interpretation of the DY131 pharmacology in vivo test. Therefore, we predicted that DY131 delivered to wild-type mice should induce similar meal patterns as that observed for Nes-Cre:ERRβlox/lox and Sox2-Cre:ERRβlox/lox mice (Figure 2 and 6), and increased ERRγ gene expression, relative to ERRβ or in the absence of ERRβ, may mediate the ingestive behaviour phenotype seen in ERRβ-null or in Nes-Cre:ERRβlox/lox mice.
Nes-Cre:ERRβlox/lox mice demonstrated the importance of ERRβ signalling in the hindbrain to regulate meal patterns. Therefore, we determined whether DY131 was able to cross the blood-brain barrier and activate ERRβ and ERRγ in the CNS. Blood brain barrier penetration can be calculated by determining whether the topological polar surface area (TPSA) is less than 70 (Kelder et al., 1999; Ertl et al., 2000). DY131 has a TPSA of 64 (http://www.daylight.com/meetings/emug00/Ertl/tpsa.html), allowing us to determine that DY131 was able to activate both central and peripheral ERRβ and ERRγ receptors.
We tested two doses of DY131, 10 and 30µM per gram body weight, in wild-type mice and verified that the animals did not get sick and did not demonstrate any aversion to food (data not shown). For in vivo testing, we chose to utilize wild-type and Sox2-Cre:ERRβlox/lox mice because they are completely null for ERRβ gene expression in all tissues, which allows us to determine - for the first time - ERRγ specific effects on meal patterns in the absence of ERRβ, since DY131 (an ERRβ/γ agonist) can only activate ERRγ in these ERRβ-null mice. Again, there is no ERRγ specific agonist commercially available, precluding the ability to determine the role of ERRγ specifically in another mouse model.
Sox2-Cre:ERRβlox/lox (Sox2-Cre:ERRβlox/lox DY) and wild-type (WT DY) mice were injected with 1 ul (10µM stock) per gram body weight of DY131. Sox2-Cre:ERRβlox/lox (Sox2-Cre:ERRβlox/lox C) and wild-type (WT C) control mice received only the vehicle injection. We demonstrated that wild-type mice injected with DY131 increased total food intake similar to both vehicle injected Sox2-Cre:ERRβlox/lox and DY131 injected Sox2-Cre:ERRβlox/lox, relative to vehicle treated wild-type mice [F1,15=16.01, fisher post-hoc:WT vs. WT DY P=0.15; WT vs Sox2-Cre:ERRβlox/lox C P=0.001; WT vs. Sox2-Cre:ERRβlox/lox DY131 P=0.01] (Figure 7c). In fact, the total number of pellets consumed by DY131 treated wild-type mice and vehicle treated Sox2-Cre:ERRβlox/lox mice resembled the total pellets consumed by untreated Nes-Cre:ERRβlox/lox mice (Figure 7c). Sox2-Cre:ERRβlox/lox treated with DY131 increased total pellet intake relative to all other groups. Intermeal and intrameal satiety ratio decreased in mice treated with a daily single injection of DY131 [Intermeal satiety ratio - F1,15=41.03, P=0.0005, fisher post-hoc:WT vs. WT DY P=0.01; WT vs Sox2-Cre:ERRβlox/lox C P=0.0004; WT vs. Sox2-Cre:ERRβlox/lox DY131 P=0.0002, Intrameal satiety ratio - F1,15=34.88, fisher post-hoc:WT vs. WT DY P=0.0004; WT vs Sox2-Cre:ERRβlox/lox C P=0.0003; WT vs. Sox2-Cre:ERRβlox/lox DY131 P=0.00004] (Figure 7d and e, respectively). Wild-type mice treated with DY131 and vehicle treated Sox2-Cre:ERRβlox/lox mice had decreased satiety ratios, and DY131 treated Sox2-Cre:ERRβlox/lox mice had an even greater suppression of satiety ratios (Figure 7d and e). The satiety ratios for DY131 treated wild-type mice, DY131 treated Sox2-Cre:ERRβlox/lox mice, and vehicle treated Sox2-Cre:ERRβlox/lox mice resembled the satiety ratio for Nes-Cre:ERRβlox/lox mice (Figure 7d and e). Furthermore, DY131 treatment decreased intermeal interval in Sox2-Cre:ERRβlox/lox to a similar level as either vehicle treated Sox2-Cre:ERRβlox/lox and untreated Nes-Cre:ERRβlox/lox mice [F1,15=8.92, fisher post-hoc:WT vs. WT DY P=0.40; WT vs Sox2-Cre:ERRβlox/lox C P=0.04; WT vs. Sox2-Cre:ERRβlox/lox DY131 P=0.04] (Figure 7f). However DY131 injected into WT mice was not sufficient to decrease intermeal interval, suggesting that DY131 in wild-type mice more potently regulated satiety ratio, but in the absence of all ERRβ gene expression DY131 was also able to decrease intermeal interval, along with decreased satiety.
Finally, in order to confirm whether alterations in ERRβ/γ signalling subsequently modified NPY gene expression, as demonstrated by Nes-Cre:ERRβlox/lox hindbrain analysis with qPCR (Figure 4b), mice were treated with DY131 for 30 days and ISH analysis for neuropeptides was performed. (Figure 8).We determined that ERRγ gene expression was present in the hypothalamus (data not shown), but not ERRβ, and confirmed that ERRγ was expressed in both the hypothalamus and hindbrain utilizing an online ISH resource (Lein et al., 2007; 2012).Since DY131 was delivered via i.p., which permeates the BBB, and ERRγ, NPY and POMC are expressed in both the hindbrain and the hypothalamus, we chose to analyze the hypothalamus for ISH since the resolution of our ISH procedure and probes for this brain region has been previously optimized (Shimogori et al., 2010). We also chose to analyze the hypothalamus for changes in gene expression after DY131 treatment given that this region of the brain has a semi-permeable blood brain barrier (BBB), and since neurons of the arcuate nucleus (ARC) are known to be able to detect compounds in the blood. Analyzing the hypothalamus, the arcuate, further ensures that the DY131 compound would be detected by neurons, even though the TPSA of DY131 suggested that it should be able to permeate the BBB.
Figure 8.

Neuropeptide gene expression in the hypothalamus. In situ hybridization (ISH) for POMC (top row) and NPY (bottom row) in the arcuate nucleus of the hypothalamus. Wild-type mice were treated with either vehicle (+/+ vehicle) or DY131 (+/+ DY131) or Sox2-Cre:ERRβlox/lox mice were treated with vehicle (−/− vehicle) or DY131 (−/− DY131).
Sox2-Cre:ERRβlox/lox mice treated with DY131 (−/− DY131) demonstrated down regulation of NPY gene expression along the ventral portion of the median eminence/arcuate nucleus region relative to the Sox2-Cre:ERRβlox/lox vehicle treated mice (−/− vehicle ) (Figure 8: bottom row - compare ventral median region arrows −/− vehicle to −/− DY131). There was also an overall modest reduction in POMC (Figure 8: top row - compare distal arcuate region +/+ vehicle to −/− DY131). This suggests that, in the absence of ERRβ, delivery of DY131 to both the central and peripheral systems, which targeted all regions of the brain that express ERRγ, does decrease NPY mRNA levels in vivo. The ISH data further supports the decreased levels of hindbrain NPY gene expression observed in the the Nes-Cre:ERRβlox/lox mice.
Given that DY131 was able to alter meal patterns in wild-type mice, similar to that observed for both Sox2-Cre:ERRβlox/lox and Nes-Cre:ERRβlox/lox mice, suggests that ERRγ activation modulated meal patterns when mice are deficient in central and/or peripheral ERRβ gene expression. The Sox2-Cre:ERRβlox/lox mice allowed us to test whole body upregulation of ERRγ activation alone, for the first time, and Sox2-Cre:ERRβlox/lox treated with DY131 demonstrated a dramatic decrease in IMI and satiety ratio. The amount of total food intake was comparable between Sox2-Cre:ERRβlox/lox and Nes-Cre:ERRβlox/lox mice, relative to wild-type control mice, demonstrating the central hindbrain role of ERRβ in modulating food intake. However, it still remains to be determined whether ERRγ modulated these parameters of food intake via peripheral and/or central signaling. These data suggest that increased ERRγ signaling may modulate food intake, in the absence of ERRβ, and this may be regulated via NPY gene expression.
DISCUSSION
Central and peripheral systems signal to control energy regulation, which is maintained through balancing food intake, storage and energy expenditure. However, the central nervous system alone can contribute toward a altering whole-body energy balance. For decades the hypothalamus has been considered the central regulator of food intake and energy balance in the CNS. More recently, neuropeptides have been shown to regulate whole-body energy balance by acting on brainstem nuclei, and some, more specifically, on the DVC within the hindbrain. Cholecytokinin acts in the brain, with receptor expression in both the hypothalamus and hindbrain, and has been shown to influence meal patterns (Bi et al., 2004); however, body weight is not altered in mice lacking the cholecytokinin receptor (Kopin et al., 1999) and, to our knowledge, hindbrain specific deletion of the cholecytokinin receptor has not been investigated. Our current study has identified ERRβ, which is prominently and selectively expressed in the DVC and other hindbrain nuclei, as a novel nuclear receptor that regulates whole-body metabolism, insulin sensitivity and meal patterns. Energy balance is primarily maintained by the following three main effectors systems: behavioral, autonomic, and neuroendocrine. We provide evidence that ERRβ is a novel component of the hindbrain neurocircuitry that regulates energy balance.
Knockout mice for all isoforms of ERR genes have been generated. ERRβ−/− mice die mid-gestation, whereas ERRγ−/− mice die shortly after birth due to cardiac failure (Alaynick et al., 2007). ERRα−/− mice are viable and show reduced adiposity with no changes in food intake and blood chemistry (Luo et al., 2003). ERRα also regulates glucose metabolism by suppressing phosphoenolpyruvate carboxykinase (PEPCK) gene expression, a rate-limiting enzyme involved in hepatic gluconeogenesis (Herzog et al., 2006). In contrast, no differences were observed in fasting blood glucose levels between wild-type and Nes-Cre:ERRβlox/lox mice, indicating that neurally-expressed ERRβ is not involved in regulating hepatic glucose output in a fasted state. However, unlike ERRα−/− mice, Nes-Cre:ERRβlox/lox mice show greater insulin sensitivity.
Previously, body weight phenotypes for Nestin-cre mice have been reported (Briancon et al., 2010; Begriche et al., 2011). However, the reported Nestin-Cre phenotype is opposite to the phenotype we demonstrated for the Nestin-Cre:ERRβlox/lox mice. In addition, Briancon et.al. (Briancon et al., 2010) compared Nestin-cre mice with a different strain of floxed mice and demonstrated that Nestin-cre mice, which also consumed a standard chow diet, had decreased body weight, higher adiposity and were less tolerant to a glucose tolerance test. Nestin-Cre:ERRβlox/lox mice demonstrated the opposite phenotype in these respects, suggesting that the effects observed in our mice were not due to the Nestin-Cre transgene.
The role of ERRγ in regulating metabolism was confirmed in ERRγ−/− mice (Alaynick et al., 2007). ERRγ−/− mice have a disruption in normal cardiac function due to major metabolic alterations (Alaynick et al., 2007). During development the heart of ERRγ−/− mice relied on glucose metabolism, and then failed to switch to a reliance on oxidative fat metabolism in the postnatal period, which then resulted in the death of ERRγ−/− mice shortly after birth (Alaynick et al., 2007). ERRβ−/− mice do not appear to have gross heart defects. However, mice with a global or CNS-specific deletion of ERRβ show a preference for carbohydrate metabolism as indicated by a higher RER in these mice, raising the possibility that ERRβ and ERRγ may regulate expression of overlapping target genes. In addition, we demonstrated for the first time in vivo that the ERRβ/γ agonist (DY131) was able to alter food intake and accentuate meal patterns, specifically by decreasing IMI and satiety ratio, when ERRβ is deleted from the entire body. This model allowed us to characterize for the first time the role of increased ERRγ signaling in modulating whole-body energy balance. Furthermore, Nes-Cre:ERRβlox/lox mice with decreased ERRβ gene expression in the hindbrain also exhibit a similar pattern of food intake, relative to wild-type mice treated with DY131 or Sox2-Cre:ERRβlox/lox mice treated with DY131. These data suggest that increased ERRγ gene expression decreased IMI and satiety ratio when ERRβ gene expression is diminished in the hindbrain.
In regards to alterations in locomotor activity contributing to alterations in food intake, both the Sox2-Cre:ERRβlox/lox and Nes-Cre:ERRβlox/lox mice do exhibit enhanced locomotor activity. However, the 10-fold increase in activity is only observed for the Sox2-cre ERRβlox/lox mice and not in the Nes-Cre:ERRβlox/lox mice. Increased RER and energy expenditure is observed in Sox2-cre ERRβlox/lox mice, relative to wild-type, when data is analyzed in regards to basal metabolic rate, and when no significant difference in the physical activity level is present between the two groups. The Nes-Cre:ERRβlox/lox mice also exhibit increased RER and energy expenditure, suggesting that hindbrain ERRβ mechanisms are, indeed, the site of action driving this phenotype. The Nes-Cre:ERRβlox/lox mice also exhibit similar alterations as the Sox2-cre ERRβlox/lox mice in regards to the macrostructure of food intake, in the absence of the increased activity, which provided us with the appropriate control to conclude that ERRβ deletion, specifically in the hindbrain, also alters the macrostructure of food intake, specifically satiety ratio and IMI.
Hindbrain signaling modulates behavior, meal patterns, as well as pancreatic endocrine secretion (Berthoud and Powley, 1985; Berthoud et al., 1990; Smith, 1996). The vagal afferent information is sent to the DVC, where it is integrated and then modulates various aspects of meal patterns (Smith, 1996). Control of the endocrine pancreas has been shown to be modulated by the dorsal motor nucleus (DMX) of the DVC, in the hindbrain (Berthoud and Powley, 1985; Berthoud et al., 1990). Our data suggest that ERRβ may acts as a regulator of glucose homeostasis in peripheral tissues, with expression in the medulla that includes the DVC region (dorsal motor nucleus and nucleus tractus solitarius, NTS) (Lein et al., 2007; 2012). Regulate of insulin secretion occurs via gastric and hepatic branches of the vagus nerve, and this has been shown to be regulated specifically by the medial columns of the DMX (Berthoud et al., 1990). We propose a model that ERRβ is a nuclear receptor in the hindbrain that regulates whole-body energy balance. Decreased gene expression of the ERRβ in the hindbrain increased lean mass, RER and energy expenditure. Given the correlation of gene expression patterns that we observed between ERRβ and ERRγ in the medulla of the brain, we hypothesize that this may influence the macrostructure of meal patterns (e.g. centrally driven satiety mechanisms) via decreased NPY gene expression resulting from increased ERRγ signaling, as demonstrated by treating mice null for ERRβ in all tissues with the ERRγ/ β agonist (DY131). DY131 treatment, in vivo, reduced NPY gene expression and altered meal patterns (e.g. satiety).Therefore, it is not surprising that decreased expression of ERRβ in the hindbrain resulted in increased ERRγ:ERRβ gene expression ratio, relative to WT mice, attenuated NPY gene expression, enhanced insulin sensitivity, increased glucose tolerance, and decreased satiety, with a decrease in the duration of time between meals (e.g. intermeal interval) (Figure 9).
Figure 9.

A model depicting how decreased ERRβ gene expression in the CNS, primarily in the hindbrain where ERRβ is expressed, altered gene expression patterns, glucose metabolism and meal patterns. ERRβ deficiency in the CNS increased the ERRγ to ERRβ gene expression ratio in a manner that resembles DY131 drug treatment. Decreased ERRβ gene expression resulted in decreased NPY gene expression, increased insulin sensitivity, and decreased blood glucose. levels. We propose that changes in blood glucose levels reduced satiety and decreased the time between meals (i.e., intermeal interval).
The glucostatic theory for food intake states that blood glucose levels are detected by neurons, and that, when blood glucose levels are low, the activity of neurons are also low, which signals hunger (Mayer, 1953). The brain region thought to modulate this behavior is the hypothalamus, a region known to integrate signals to maintain energy balance (Hetherington and Ranson, 1983; Anand and Brobeck, 1984). Since then, an alternative hypothesis was proposed to suggest that the control of systemic energy balance is distributed across different brain regions (Grill and Kaplan, 2002; Grill, 2006). For example, glucoregulatory cells in the hindbrain have been shown to control food intake and blood glucose (Ritter et al., 2000), specifically in the DVC, where ERRβ gene expression is observed. Hindbrain neurons containing catecholamines are present in the NTS and DMX of the rat (Dahlstrom and Fuxe, 1964). NPY is expressed in catecholaminergic neurons, which have been shown to regulate glucoregulatory responses (Ritter et al., 2006). Our loss-of-function studies on ERRβ support a hindbrain-driven mechanism to control energy balance by altering ERRγ gene expression, as well as NPY gene expression.
NPY is an orexigenic neuropeptide expressed throughout the peripheral and central nervous system (Adrian et al., 1983; Allen et al., 1983; Dumont et al., 1992) and has been widely investigated in the control of appetite and body weight gain, as well as many other physiological systems (Dumont et al., 1992). Nes-Cre:ERRβlox/lox mice have decreased ERRβ and NPY gene expression in the hindbrain. The Nes-Cre:ERRβlox/lox mice demonstrate decreased NPY gene expression and decreased intrameal food intake responses, consistent with the role of NPY in the hindbrain in regulating food intake behavior (Baird et al., 2008), which has shown that increased NPY signaling in the hindbrain increased intrameal food intake responses. Furthermore, NPY knockout mice demonstrate similar behavioral and physiological alterations as those observed in the Nes-Cre:ERRβlox/lox mice. For example, increased NPY levels in the NTS of the DVC have been shown to increase insulin secretion (Dunbar et al., 1992), whereas Nes-Cre:ERRβlox/lox mice have decreased NPY gene expression in the hindbrain and decreased insulin secretion. Together, this data suggests that NPY gene expression, specifically in the hindbrain, modulated insulin secretion and alterations in meal patterns consistent with the phenotypes observed in the Nes-Cre:ERRβlox/lox mice. We demonstrate for the first time that decreased ERRβ expression in the hindbrain of the CNS is sufficient to increase peripheral tissue insulin sensitivity and that ERRβ signaling is upstream of NPY gene expression.
Summary
Selective reduction of ERRβ expression in the CNS resulted in an increased ratio of ERRγ gene expression relative to ERRβ, decreased NPY gene expression in the hindbrain, significantly decreased intermeal interval and satiety, and enhanced body weight, lean mass, insulin sensitivity, and whole-body energy metabolism. These data support the hypothesis that an extra-hypothalamic site, such as the hindbrain, can modulate peripheral tissue metabolism and food intake.
Acknowledgements
This work was supported in part by grants from the American Heart Association (SDG2260721 to G.W.W., PRE3790034 to Z.W.), the Baltimore Diabetes Research and Training Center (P60DK079637 to G.W.W.), the National Institutes of Health (DK084171 to G.W.W.), the National Institute of Diabetes and Digestive and Kidney Diseases training fellowship (T32DK007751 to M.S.B.), and an NRSA fellowship from N.I.H. (F32DK084607 to J.M.P.)
Abbreviations
- AgRP
Agouti related protein
- AUC
area under the curve
- Car
constitutive androstane receptor
- CART
cocaine and amphetamine regulated transcript
- CNS
central nervous system
- EE
energy expenditure
- ERRα
Estrogen-related receptor α
- ERRβ
Estrogen-related receptor β
- ERR γ
Estrogen-related receptor γ
- FFM
– fat free mass
- GTT
glucose tolerance test
- IMI
intermeal interval
- ISH
in situ hybridization
- ITT
insulin tolerance test
- MPSS
Massively parallel signature data
- NPY
Neuropeptide Y
- POMC
Proopiomelanocortin
- PPAR-α
peroxisome proliferator activated receptor alpha
- Pxr
pregnane X receptor
- RER
respiratory exchange ratio
- TPSA
topological polar surface area
- WT
wild-type
REFERENCES
- Adrian TE, Allen JM, Bloom SR, Ghatei MA, Rossor MN, Roberts GW, Crow TJ, Tatemoto K, Polak JM. Neuropeptide Y distribution in human brain. Nature. 1983;306:584–586. doi: 10.1038/306584a0. [DOI] [PubMed] [Google Scholar]
- Alaynick WA, Kondo RP, Xie W, He W, Dufour CR, Downes M, Jonker JW, Giles W, Naviaux RK, Giguere V, Evans RM. ERRgamma directs and maintains the transition to oxidative metabolism in the postnatal heart. Cell Metab. 2007;6:13–24. doi: 10.1016/j.cmet.2007.06.007. [DOI] [PubMed] [Google Scholar]
- Allen YS, Adrian TE, Allen JM, Tatemoto K, Crow TJ, Bloom SR, Polak JM. Neuropeptide Y distribution in the rat brain. Science. 1983;221:877–879. doi: 10.1126/science.6136091. [DOI] [PubMed] [Google Scholar]
- Anand BK, Brobeck JR. Nutrition classics. The Yale Journal of Biology and Medicine. Volume XXIV 1951–1952. Hypothalamic control of food intake in rats and cats. Nutrition Reviews. 1984;42:354–356. doi: 10.1111/j.1753-4887.1984.tb02255.x. [DOI] [PubMed] [Google Scholar]
- Baird JP, Rios C, Loveland JL, Beck J, Tran A, Mahoney CE. Effects of hindbrain melanin-concentrating hormone and neuropeptide Y administration on licking for water, saccharin, and sucrose solutions. Am J Physiol Regul Integr Comp Physiol. 2008;294:R329–R343. doi: 10.1152/ajpregu.00611.2006. [DOI] [PMC free article] [PubMed] [Google Scholar]
- Begriche K, Levasseur PR, Zhang J, Rossi J, Skorupa D, Solt LA, Young B, Burris TP, Marks DL, Mynatt RL, Butler AA. Genetic dissection of the functions of the melanocortin-3 receptor, a seven-transmembrane G-protein-coupled receptor, suggests roles for central and peripheral receptors in energy homeostasis. J Biol Chem. 2011;286:40771–40781. doi: 10.1074/jbc.M111.278374. [DOI] [PMC free article] [PubMed] [Google Scholar]
- Bergman RN, Phillips LS, Cobelli C. Physiologic evaluation of factors controlling glucose tolerance in man: measurement of insulin sensitivity and beta-cell glucose sensitivity from the response to intravenous glucose. J Clin Invest. 1981;68:1456–1467. doi: 10.1172/JCI110398. [DOI] [PMC free article] [PubMed] [Google Scholar]
- Bergman RN, Ider YZ, Bowden CR, Cobelli C. Quantitative estimation of insulin sensitivity. Am J Physiol. 1979;236:E667–E677. doi: 10.1152/ajpendo.1979.236.6.E667. [DOI] [PubMed] [Google Scholar]
- Berthoud HR, Powley TL. Altered plasma insulin and glucose after obesity-producing bipiperidyl brain lesions. Am J Physiol. 1985;248:R46–R53. doi: 10.1152/ajpregu.1985.248.1.R46. [DOI] [PubMed] [Google Scholar]
- Berthoud HR, Fox EA, Powley TL. Localization of vagal preganglionics that stimulate insulin and glucagon secretion. Am J Physiol. 1990;258:R160–R168. doi: 10.1152/ajpregu.1990.258.1.R160. [DOI] [PubMed] [Google Scholar]
- Bi S, Scott KA, Kopin AS, Moran TH. Differential roles for cholecystokinin a receptors in energy balance in rats and mice. Endocrinology. 2004;145:3873–3880. doi: 10.1210/en.2004-0284. [DOI] [PubMed] [Google Scholar]
- Blackshaw S, Snyder SH. Developmental expression pattern of phototransduction components in mammalian pineal implies a light-sensing function. J Neurosci. 1997;17:8074–8082. doi: 10.1523/JNEUROSCI.17-21-08074.1997. [DOI] [PMC free article] [PubMed] [Google Scholar]
- Blackshaw S, Scholpp S, Placzek M, Ingraham H, Simerly R, Shimogori T. Molecular pathways controlling development of thalamus and hypothalamus: from neural specification to circuit formation. J Neurosci. 2010;30:14925–14930. doi: 10.1523/JNEUROSCI.4499-10.2010. [DOI] [PMC free article] [PubMed] [Google Scholar]
- Blackshaw S, Harpavat S, Trimarchi J, Cai L, Huang H, Kuo WP, Weber G, Lee K, Fraioli RE, Cho SH, Yung R, Asch E, Ohno-Machado L, Wong WH, Cepko CL. Genomic analysis of mouse retinal development. PLoS Biol. 2004;2:E247. doi: 10.1371/journal.pbio.0020247. [DOI] [PMC free article] [PubMed] [Google Scholar]
- Bookout AL, Jeong Y, Downes M, Yu RT, Evans RM, Mangelsdorf DJ. Anatomical profiling of nuclear receptor expression reveals a hierarchical transcriptional network. Cell. 2006;126:789–799. doi: 10.1016/j.cell.2006.06.049. [DOI] [PMC free article] [PubMed] [Google Scholar]
- Breda E, Cavaghan MK, Toffolo G, Polonsky KS, Cobelli C. Oral glucose tolerance test minimal model indexes of beta-cell function and insulin sensitivity. Diabetes. 2001;50:150–158. doi: 10.2337/diabetes.50.1.150. [DOI] [PubMed] [Google Scholar]
- Briancon N, McNay DE, Maratos-Flier E, Flier JS. Combined neural inactivation of suppressor of cytokine signaling-3 and protein-tyrosine phosphatase-1B reveals additive, synergistic, and factor-specific roles in the regulation of body energy balance. Diabetes. 2010;59:3074–3084. doi: 10.2337/db10-0481. [DOI] [PMC free article] [PubMed] [Google Scholar]
- Byerly MS, Simon J, Lebihan-Duval E, Duclos MJ, Cogburn LA, Porter TE. Effects of BDNF, T3, and corticosterone on expression of the hypothalamic obesity gene network in vivo and in vitro. Am J Physiol Regul Integr Comp Physiol. 2009;296:R1180–R1189. doi: 10.1152/ajpregu.90813.2008. [DOI] [PMC free article] [PubMed] [Google Scholar]
- Caumo A, Bergman RN, Cobelli C. Insulin sensitivity from meal tolerance tests in normal subjects: a minimal model index. J Clin Endocrinol Metab. 2000;85:4396–4402. doi: 10.1210/jcem.85.11.6982. [DOI] [PubMed] [Google Scholar]
- Chen J, Nathans J. Estrogen-related receptor beta/NR3B2 controls epithelial cell fate and endolymph production by the stria vascularis. Dev Cell. 2007;13:325–337. doi: 10.1016/j.devcel.2007.07.011. [DOI] [PubMed] [Google Scholar]
- Cobelli C, Toffolo GM, Dalla Man C, Campioni M, Denti P, Caumo A, Butler P, Rizza R. Assessment of beta-cell function in humans, simultaneously with insulin sensitivity and hepatic extraction, from intravenous and oral glucose tests. Am J Physiol Endocrinol Metab. 2007;293:E1–E15. doi: 10.1152/ajpendo.00421.2006. [DOI] [PubMed] [Google Scholar]
- Dahlstrom A, Fuxe K. Localization of monoamines in the lower brain stem. Experientia. 1964;20:398–399. doi: 10.1007/BF02147990. [DOI] [PubMed] [Google Scholar]
- Dubois NC, Hofmann D, Kaloulis K, Bishop JM, Trumpp A. Nestin-Cre transgenic mouse line Nes-Cre1 mediates highly efficient Cre/loxP mediated recombination in the nervous system, kidney, and somite-derived tissues. Genesis. 2006;44:355–360. doi: 10.1002/dvg.20226. [DOI] [PubMed] [Google Scholar]
- Dumont Y, Martel JC, Fournier A, St-Pierre S, Quirion R. Neuropeptide Y and neuropeptide Y receptor subtypes in brain and peripheral tissues. Prog Neurobiol. 1992;38:125–167. doi: 10.1016/0301-0082(92)90038-g. [DOI] [PubMed] [Google Scholar]
- Dunbar JC, Ergene E, Barraco RA. Neuropeptide-Y stimulation of insulin secretion is mediated via the nucleus tractus solitarius. Horm Metab Res. 1992;24:103–105. doi: 10.1055/s-2007-1003268. [DOI] [PubMed] [Google Scholar]
- Ertl P, Rohde B, Selzer P. Fast calculation of molecular polar surface area as a sum of fragment-based contributions and its application to the prediction of drug transport properties. J Med Chem. 2000;43:3714–3717. doi: 10.1021/jm000942e. [DOI] [PubMed] [Google Scholar]
- Feng JQ, Scott G, Guo D, Jiang B, Harris M, Ward T, Ray M, Bonewald LF, Harris SE, Mishina Y. Generation of a conditional null allele for Dmp1 in mouse. Genesis. 2008;46:87–91. doi: 10.1002/dvg.20370. [DOI] [PMC free article] [PubMed] [Google Scholar]
- Fox EA, Byerly MS. A mechanism underlying mature-onset obesity: evidence from the hyperphagic phenotype of brain-derived neurotrophic factor mutants. Am J Physiol Regul Integr Comp Physiol. 2004;286:R994–R1004. doi: 10.1152/ajpregu.00727.2003. [DOI] [PubMed] [Google Scholar]
- Giguere V. Transcriptional control of energy homeostasis by the estrogen-related receptors. Endocr Rev. 2008;29:677–696. doi: 10.1210/er.2008-0017. [DOI] [PubMed] [Google Scholar]
- Giguere V, Yang N, Segui P, Evans RM. Identification of a new class of steroid hormone receptors. Nature. 1988;331:91–94. doi: 10.1038/331091a0. [DOI] [PubMed] [Google Scholar]
- Gofflot F, Chartoire N, Vasseur L, Heikkinen S, Dembele D, Le Merrer J, Auwerx J. Systematic gene expression mapping clusters nuclear receptors according to their function in the brain. Cell. 2007;131:405–418. doi: 10.1016/j.cell.2007.09.012. [DOI] [PubMed] [Google Scholar]
- Grill HJ. Distributed neural control of energy balance: contributions from hindbrain and hypothalamus. Obesity (Silver Spring) 2006;14(Suppl 5):216S–221S. doi: 10.1038/oby.2006.312. [DOI] [PubMed] [Google Scholar]
- Grill HJ, Kaplan JM. The neuroanatomical axis for control of energy balance. Front Neuroendocrinol. 2002;23:2–40. doi: 10.1006/frne.2001.0224. [DOI] [PubMed] [Google Scholar]
- Grill HJ, Schwartz MW, Kaplan JM, Foxhall JS, Breininger J, Baskin DG. Evidence that the caudal brainstem is a target for the inhibitory effect of leptin on food intake. Endocrinology. 2002;143:239–246. doi: 10.1210/endo.143.1.8589. [DOI] [PubMed] [Google Scholar]
- Hayashi S, Lewis P, Pevny L, McMahon AP. Efficient gene modulation in mouse epiblast using a Sox2Cre transgenic mouse strain. Mech Dev. 2002;119(Suppl 1):S97–S101. doi: 10.1016/s0925-4773(03)00099-6. [DOI] [PubMed] [Google Scholar]
- Hayes MR, Skibicka KP, Leichner TM, Guarnieri DJ, DiLeone RJ, Bence KK, Grill HJ. Endogenous leptin signaling in the caudal nucleus tractus solitarius and area postrema is required for energy balance regulation. Cell Metab. 2010;11:77–83. doi: 10.1016/j.cmet.2009.10.009. [DOI] [PMC free article] [PubMed] [Google Scholar]
- Herzog B, Cardenas J, Hall RK, Villena JA, Budge PJ, Giguere V, Granner DK, Kralli A. Estrogen-related receptor alpha is a repressor of phosphoenolpyruvate carboxykinase gene transcription. J Biol Chem. 2006;281:99–106. doi: 10.1074/jbc.M509276200. [DOI] [PubMed] [Google Scholar]
- Hetherington A, Ranson S. Nutrition Classics. The Anatomical Record, Volume 78, 1940: Hypothalamic lesions and adiposity in the rat. Nutrition Reviews. 1983;41:124–127. doi: 10.1111/j.1753-4887.1983.tb07169.x. [DOI] [PubMed] [Google Scholar]
- Allen Brain Atlas. 2012 http://mousebrain-maporg/ W.
- Kelder J, Grootenhuis PD, Bayada DM, Delbressine LP, Ploemen JP. Polar molecular surface as a dominating determinant for oral absorption and brain penetration of drugs. Pharm Res. 1999;16:1514–1519. doi: 10.1023/a:1015040217741. [DOI] [PubMed] [Google Scholar]
- Kopin AS, Mathes WF, McBride EW, Nguyen M, Al-Haider W, Schmitz F, Bonner-Weir S, Kanarek R, Beinborn M. The cholecystokinin-A receptor mediates inhibition of food intake yet is not essential for the maintenance of body weight. J Clin Invest. 1999;103:383–391. doi: 10.1172/JCI4901. [DOI] [PMC free article] [PubMed] [Google Scholar]
- Lein ES, Hawrylycz MJ, Ao N, Ayres M, Bensinger A, Bernard A, Boe AF, Boguski MS, Brockway KS, Byrnes EJ, Chen L, Chen TM, Chin MC, Chong J, Crook BE, Czaplinska A, Dang CN, Datta S, Dee NR, Desaki AL, Desta T, Diep E, Dolbeare TA, Donelan MJ, Dong HW, Dougherty JG, Duncan BJ, Ebbert AJ, Eichele G, Estin LK, Faber C, Facer BA, Fields R, Fischer SR, Fliss TP, Frensley C, Gates SN, Glattfelder KJ, Halverson KR, Hart MR, Hohmann JG, Howell MP, Jeung DP, Johnson RA, Karr PT, Kawal R, Kidney JM, Knapik RH, Kuan CL, Lake JH, Laramee AR, Larsen KD, Lau C, Lemon TA, Liang AJ, Liu Y, Luong LT, Michaels J, Morgan JJ, Morgan RJ, Mortrud MT, Mosqueda NF, Ng LL, Ng R, Orta GJ, Overly CC, Pak TH, Parry SE, Pathak SD, Pearson OC, Puchalski RB, Riley ZL, Rockett HR, Rowland SA, Royall JJ, Ruiz MJ, Sarno NR, Schaffnit K, Shapovalova NV, Sivisay T, Slaughterbeck CR, Smith SC, Smith KA, Smith BI, Sodt AJ, Stewart NN, Stumpf KR, Sunkin SM, Sutram M, Tam A, Teemer CD, Thaller C, Thompson CL, Varnam LR, Visel A, Whitlock RM, Wohnoutka PE, Wolkey CK, Wong VY, Wood M, et al. Genome-wide atlas of gene expression in the adult mouse brain. Nature. 2007;445:168–176. doi: 10.1038/nature05453. [DOI] [PubMed] [Google Scholar]
- Luo J, Sladek R, Bader JA, Matthyssen A, Rossant J, Giguere V. Placental abnormalities in mouse embryos lacking the orphan nuclear receptor ERR-beta. Nature. 1997;388:778–782. doi: 10.1038/42022. [DOI] [PubMed] [Google Scholar]
- Luo J, Sladek R, Carrier J, Bader JA, Richard D, Giguere V. Reduced fat mass in mice lacking orphan nuclear receptor estrogen-related receptor alpha. Mol Cell Biol. 2003;23:7947–7956. doi: 10.1128/MCB.23.22.7947-7956.2003. [DOI] [PMC free article] [PubMed] [Google Scholar]
- Mayer J. Glucostatic mechanism of regulation of food intake. N Engl J Med. 1953;249:13–16. doi: 10.1056/NEJM195307022490104. [DOI] [PubMed] [Google Scholar]
- Muniyappa RLS, Chen H, Quon MJ. Current approaches for assessing insulin sensitivity and resistance in vivo: advantages, limitations, and appropriate usage. Am J Physiol Endocrinol Metab. 2008;294:15–26. doi: 10.1152/ajpendo.00645.2007. [DOI] [PubMed] [Google Scholar]
- Onishi A, Peng GH, Poth EM, Lee DA, Chen J, Alexis U, de Melo J, Chen S, Blackshaw S. The orphan nuclear hormone receptor ERRbeta controls rod photoreceptor survival. Proc Natl Acad Sci U S A. 2010;107:11579–11584. doi: 10.1073/pnas.1000102107. [DOI] [PMC free article] [PubMed] [Google Scholar]
- Ritter S, Dinh TT, Zhang Y. Localization of hindbrain glucoreceptive sites controlling food intake and blood glucose. Brain Res. 2000;856:37–47. doi: 10.1016/s0006-8993(99)02327-6. [DOI] [PubMed] [Google Scholar]
- Ritter S, Dinh TT, Li AJ. Hindbrain catecholamine neurons control multiple glucoregulatory responses. Physiol Behav. 2006;89:490–500. doi: 10.1016/j.physbeh.2006.05.036. [DOI] [PubMed] [Google Scholar]
- Rushing PA, Houpt TA, Henderson RP, Gibbs J. High lick rate is maintained throughout spontaneous liquid meals in freely feeding rats. Physiol Behav. 1997;62:1185–1188. doi: 10.1016/s0031-9384(97)00308-9. [DOI] [PubMed] [Google Scholar]
- Shimogori T, Lee DA, Miranda-Angulo A, Yang Y, Wang H, Jiang L, Yoshida AC, Kataoka A, Mashiko H, Avetisyan M, Qi L, Qian J, Blackshaw S. A genomic atlas of mouse hypothalamic development. Nat Neurosci. 2010;13:767–775. doi: 10.1038/nn.2545. [DOI] [PMC free article] [PubMed] [Google Scholar]
- Smith GP. The direct and indirect controls of meal size. Neurosci Biobehav Rev. 1996;20:41–46. doi: 10.1016/0149-7634(95)00038-g. [DOI] [PubMed] [Google Scholar]
- Trapp T, Holsboer F. Nuclear orphan receptor as a repressor of glucocorticoid receptor transcriptional activity. J Biol Chem. 1996;271:9879–9882. doi: 10.1074/jbc.271.17.9879. [DOI] [PubMed] [Google Scholar]
- Tronche F, Kellendonk C, Kretz O, Gass P, Anlag K, Orban PC, Bock R, Klein R, Schutz G. Disruption of the glucocorticoid receptor gene in the nervous system results in reduced anxiety. Nat Genet. 1999;23:99–103. doi: 10.1038/12703. [DOI] [PubMed] [Google Scholar]
- Vanacker JM, Pettersson K, Gustafsson JA, Laudet V. Transcriptional targets shared by estrogen receptor-related receptors (ERRs) and estrogen receptor (ER) alpha, but not by ERbeta. Embo J. 1999;18:4270–4279. doi: 10.1093/emboj/18.15.4270. [DOI] [PMC free article] [PubMed] [Google Scholar]
- Visel A, Thaller C, Eichele G. GenePaint.org: an atlas of gene expression patterns in the mouse embryo. Nucleic Acids Res. 2004;32:D552–D556. doi: 10.1093/nar/gkh029. [DOI] [PMC free article] [PubMed] [Google Scholar]
- Yu DD, Forman BM. Identification of an agonist ligand for estrogen-related receptors ERRbeta/gamma. Bioorg Med Chem Lett. 2005;15:1311–1313. doi: 10.1016/j.bmcl.2005.01.025. [DOI] [PubMed] [Google Scholar]