

Abstract
The transformation of sensory signals as they pass through cortical circuits has been revealed almost exclusively through studies of the primary sensory cortices, where principles of laminar organization, local connectivity and parallel processing have been elucidated. In contrast, almost nothing is known about the circuitry or laminar features of multisensory processing in higher-order, multisensory cortex. Therefore, using the ferret higher-order multisensory rostral posterior parietal (PPr) cortex, the present investigation employed a combination of multichannel recording and neuroanatomical techniques to elucidate the laminar basis of multisensory cortical processing. The proportion of multisensory neurons, the share of neurons showing multisensory integration, and the magnitude of multisensory integration were all found to differ by layer in a way that matched the functional or connectional characteristics of the PPr. Specifically, the supragranular layers (L2–3) demonstrated among the highest proportions of multisensory neurons and the highest incidence of multisensory response enhancement, while also receiving the highest levels of extrinsic inputs, exhibiting the highest dendritic spine densities, and providing a major source of local connectivity. In contrast, layer 6 showed the highest proportion of unisensory neurons while receiving the fewest external and local projections and exhibiting the lowest dendritic spine densities. Coupled with a lack of input from principal thalamic nuclei and a minimal layer 4, these observations indicate that this higher-level multisensory cortex shows unique functional and organizational modifications from the well-known patterns identified for primary sensory cortical regions.
Keywords: Parietal Cortex, Convergence, Integration, Somatosensation, Vision, Ferret
INTRODUCTION
Efforts to understand the connectional basis of cortical sensory processing have focused almost exclusively on the primary and lower-level unisensory cortices. However, the brain also uses information derived from combinations of different sensory modalities to influence perception and guide behavior (for review, see Stein and Meredith, 1993). Cortical areas dedicated to these multiple sensory tasks have been identified as multisensory. While many cortical areas contain a scattering of neurons which can be influenced by more than one modality, higher-level association cortices contain a large proportion of multisensory neurons that exhibit suprathreshold activity in response to more than one sensory modality: they are bimodal. Such bimodal neurons have been readily identified in numerous higher-level cortical areas, like the primate superior temporal sulcus (Benevento et al., 1977; Bruce et al., 1981; Hikosaka et al., 1988) intraparietal sulcus (Avillac et al., 2007; Bremmer et al., 2002; Cohen, 2009; Duhamel et al., 1998; Russ et al., 2006; Schlack et al., 2005), frontal and prefrontal cortex (Fogassi et al., 1996; Graziano et al., 1999; Romanski, 2007), the cat anterior ectosylvian (Clemo et al., 2011; Jiang et al., 1994; Wallace et al., 1992) and suprasylvian sulcal regions (Allman and Meredith, 2007; Clemo et al., 2007; Yaka et al., 2002) and rodent cortex (Wallace et al., 2004; Menzel and Barth, 2005). Another characteristic of these higher-level cortices is that they receive thalamic inputs primarily from the non-specific nuclei such as the lateral posterior and pulvinar nuclei (Bucci, 2009; Matsuzaki et al., 2004; Roda and Reinoso-Suarez, 1983; Romanski et al., 1997; Takahashi, 1985; Yeterian and Pandya, 1989) that terminate largely outside cortical layer 4 (Rockland et al., 1999) depending on the area and the species (for review, see Jones, 2007). In addition, significant activation of higher-order cortices arrives through cortico-cortical connections (Felleman and Van Essen, 1991; Van Essen, 2005; Zeki and Shipp, 1988). Collectively, these features distinguish higher-level, multisensory cortices from their lower-level, primary cortical counterparts.
In contrast to the investigative attention directed toward lower-level sensory areas, few studies have evaluated the laminar features or connectional organization of higher-order multisensory cortices. In rat multisensory cortex, multiunit activation by separate auditory or tactile stimulation co-localizes across the cortical thickness (Menzel and Barth, 2005). In monkeys, multisensory neurons in the superior temporal sulcal region were demonstrated to cluster spatially (Dahl et al., 2009), and the laminar distribution of separate visual, auditory and somatosensory activation of this same cortical region has been examined (Schroeder and Foxe, 2002). On the other hand, recent neuroanatomical studies of cat multisensory cortices have demonstrated a strong preference for cortico-cortical inputs to terminate within layers 2-3 (Clemo et al., 2007; 2008; Dehner et al., 2004; Meredith et al., 2006; Monteiro et al., 2003) reviewed in (Clemo et al., 2011), but correlations with laminar multisensory properties were not made. Altogether, these few observations indicate that the laminar basis for multisensory processing is largely unexplored.
To evaluate the laminar basis of cortical multisensory processing, the rostral posterior parietal cortex of the ferret (PPr) was selected as the experimental model. The PPr is bordered, anteriorly, by the third somatosensory area (SIII; Foxworthy and Meredith, 2011) and, posteriorly, by the caudal posterior parietal visual area (PPc; Manger et al., 2002). Located between these two different sensory representations, the PPr contains neurons that respond to either (unisensory) (Foxworthy et al., 2012; Manger et al., 2002), or independently to both somatosensory and visual stimulation (bimodal) (Foxworthy et al., 2012) whose receptive fields are of sufficient size that a standardized set of stimuli can activate a large proportion of the constituent neurons. To examine and compare multisensory properties of PPr neurons, three common measures of multisensory processing, identified in other multisensory regions (Meredith et al., 2011), were used. These measures include the proportion of multisensory neurons (see also Dahl et al., 2009), the proportion of multisensory neurons that generate multisensory integration, and the magnitude of multisensory integration, all of which are parametrically related to the properties of the neural connectivity that produced them (Lim et al., 2011). In addition, this parietal region has been well-studied in humans, monkeys and rodents and its role has been established in attention, rectification of spatial maps, goal-directed behaviors and self-awareness (Alais et al., 2010; Blanke, 2012; Calton and Taube, 2009; Kaas et al., 2011; Nitz, 2009; Reep and Corwin, 2009). Furthermore, because all eutherians exhibit a multisensory region between their visual and somatosensory cortical representations (Kaas, 2009; Manger et al., 2002), neuronal properties observed in the ferret PPr may be generalizable to a large number of species. Therefore, using the ferret PPr, the present set of experiments coupled the analysis of connectional properties (using neuroanatomical methods) with a systematic analysis of the measures of multisensory processing (using electrophysiological recordings) to investigate the laminar and connectional bases for cortical multisensory processing.
MATERIALS AND METHODS
All procedures were performed in compliance with the Guide for Care and Use of Laboratory Animals (National Institutes of Health, publication 86–23), the National Research Council's Guidelines for Care and Use of Mammals in Neuroscience and Behavioral Research (2003), and with approval from the Institutional Animal Care and Use Committee at Virginia Commonwealth University.
Electrophysiological Studies
Surgical Procedures
Adult ferrets (n=13) were anesthetized, (8mg/kg ketamine; 0.03mg/kg dexmedetomidine intramuscularly), their heads were secured in a stereotaxic frame and a craniotomy was made to expose the rostral posterior parietal (PPr) region of the suprasylvian gyrus. Over this opening, a recording well/head supporting device was implanted using stainless steel screws and dental acrylic. The well/head support was attached such that the eyes and ears of the animal were not obstructed and no pressure points were present.
Electrophysiological Recording
For recording, the head-support implant was secured to an immobile supporting bar. The animals were intubated through the mouth, ventilated (expired CO2: ~4.5%) and immobilized (pancuronium bromide; 0.3 mg/kg initial dose; 0.2 mg/kg h supplement i.p.). Fluids (lactated Ringer's solution) and supplemental anesthetics (4mg/kg h ketamine; 0.5 mg/kg h acepromazine i.p.) were administered continuously with an infusion pump. Anesthesia and paralytics were necessary to prevent movement of the body and eyes during the lengthy and repeated presentation of somatosensory and visual stimuli at fixed locations. Heart rate was monitored continuously and, if heart rate rose over a sustained period of 5–10 minutes, supplemental anesthetics were administered in addition to that supplied continuously by the infusion pump. Temperature was monitored and maintained at ~38°C with a heating pad. The pupils were dilated with 1% atropine sulfate and the eye was anesthetized with 0.5% proparacaine hydrochloride for the placement of contact lenses to adjust for refractive errors.
Neuron responses were recorded using a 32-channel silicon probe (A4×8–5mm 200–200-413 array; impedance ~1 MΩ; NeuroNexus Technologies, Ann Arbor, MI) that consisted of four 5mm long shanks, each separated by 200μm. Each shank carried 8 recording sites, separated by 200μm each beginning at 50μm from the tip. Neuronal activity was picked up and digitized (rate>25 kHz) using a TDT System III Workstation (TuckerDavis Technologies Alchua, FL) running MatLab software and stored for off-line analysis. The raw signal was bandwidth separated (at 0.5–5kHz) to distinguish spiking activity from local field potentials. Spike signals were then de-noised by a two-stage multiple linear regression function to reject signals common to all channels. Waveforms were then clustered by principal component feature space analysis and then sorted into individual units using an automated Bayesian sort-routine. Spikes which failed to separate within a principal component cluster were marked as outliers and not included for further analysis. Also, spikes which exhibited interspike intervals < 2ms were rejected.
Once the PPr neurons were identified and templated, their responses to sensory stimulation were determined. First, each neuron was assessed independently with manually presented somatosensory (brush strokes, taps, and manual pressure) and visual stimuli (flashed or moving spots or bars of light from a hand-held ophthalmoscope projected onto a translucent hemisphere, 92cm diameter, positioned in front of the animal) to determine the neurons' receptive fields. These receptive fields were used to guide the placement of the subsequent electronically-generated, repeatable somatosensory and visual stimuli, which are described below. Auditory responsiveness was also evaluated using manually presented claps, hisses, whistles at different locations around the animal's head. However, auditory responses were never observed, so quantitative sensory testing (below) progressed using only visual and somatosensory stimulation.
For quantitative sensory testing, somatosensory stimuli were produced by a calibrated 1 gram monofilament fiber moved by an electronically-driven, modified shaker (Ling, 102A) that displaced hair or indented the skin. Visual stimulation consisted of a bar of light, whose movement direction, velocity and amplitude across the visual receptive field was computer-controlled and projected onto the translucent hemisphere. These somatosensory and visual stimuli were presented separately and in combination during recording. During combined presentations, the onsets of the stimuli were offset by 40ms (visual preceded tactile) to roughly compensate for the cortical latency disparity between these modalities. The separate and combined presentations of stimuli were randomly interleaved to compensate for possible shifts in baseline activity, interstimulus intervals randomly varied between 3–7 seconds to avoid response habituation, and each stimulus or combination was repeated 50 times. In this way, a given recording penetration simultaneously recorded neuronal responses for each recording channel to repeated presentations of effective visual, tactile, and combined visual-tactile stimulation. Attention was paid to maintaining the consistency of sensory stimulation between different experiments. The somatosensory stimulus was always positioned on the contralateral side of the face and moved at the same velocity and amplitude; visual stimulation always consisted of a moving (150 °/sec) bar (5×20°) of light that transited 30–40° of contralateral visual space in the nasal-to-temporal direction. Due to the relatively large size of PPr receptive fields, these stimulation parameters were consistent in producing robust responses at the different recording sites across the dimensions of the probe.
When the recording session was completed, the recording probe was withdrawn and the animal was overdosed (Euthasol), perfused intracardially with saline and fixed (4% paraformaldehyde). The brain was blocked stereotaxically and the cortex containing the recording site(s) was serially sectioned (75 μm) in the coronal plane. The sections were mounted on slides and counterstained with cresyl violet. Sections containing the electrode penetrations were photographed using a light microscope to identify those recording sites that were located within the gray matter of the suprasylvian gyrus. Additional histological steps were used to reconstruct individual recording sites to determine their laminar location. Because the recording probe consisted of 4 parallel shanks that created 4 parallel tracks within the tissue, a scaled digital image of the probe (with its recording sites) could be superimposed over the tracks and aligned in two orthogonal planes such that the probe image not only matched the depth of the recording tracks, but also precisely aligned with the medio-lateral spacing of the parallel shanks. This produced a reconstruction of the recording probe that was scaled to the tissue section in which it was used. Next, the cortical laminae were plotted using a light microscope with a PC-driven digitizing stage controlled by Neurolucida software (Microbrightfield Biosciences, Inc., Williston, VT) and superimposed on the scaled image of the tissue and the recording probe. In this way, the individual recording pads of the recording electrode, spaced at 200 μm intervals beginning 50μm from the tip of the shank, were plotted in relation to the location of the different cortical laminae. Finally, in a spreadsheet, each electrode pad and laminar location was correlated with the neuronal waveforms and responses obtained at that site, thereby matching laminar location with neuronal response activity. The few electrode sites that fell on the border between layers were considered ambiguous and were excluded from analysis. Also, electrode sites located in the lower 2/3rds of the medial bank of the suprasylvian sulcus were excluded because of the border with the AMLS visual area (Manger et al., 2008).
Data Analysis
To evaluate the neuronal responses to the somatosensory, visual and combined stimulation, custom software (MatLab) was used to compile and quantify the spiking activity of each identified neuron after the criteria of Bell et al., (2005). A neuronal response was operationally defined as spiking activity which was >3 standard deviations from spontaneous activity, that lasted for 15ms duration, and ended when activity returned to baseline for at least 15ms. Neurons showing suprathreshold activation to more than one sensory modality were defined as bimodal forms of multisensory neurons. Neurons which showed suprathreshold activation by only one modality were identified as unisensory neurons that were further distinguished into one of two categories. Those unisensory neurons which exhibited responses that were significantly different in the combined stimulus condition than in the unisensory stimulus condition (determined by paired t-test) were classified as subthreshold multisensory neurons. Alternatively, unisensory neurons not significantly affected by combined-modality stimulation were designated as unisensory neurons. Finally, neurons which failed to show activation by any sensory stimulus or combination were defined as unresponsive neurons. These criteria are consistent with other published studies of multisensory cortical neurons (reviewed in Allman et al., 2009).
Multisensory (bimodal and subthreshold) neurons were further analyzed to evaluate their integrated responses to multisensory stimulation. Responses showing a significantly greater activation (mean spikes/trial) to multisensory stimuli when compared to that elicited by the most effective single modality stimulus (determined by paired t-test) were classified as showing response enhancement, those exhibiting a significantly reduced activation to multisensory versus the best unisensory stimulus were defined as showing response depression. The magnitude of multisensory integration was calculated according to the method of Meredith and Stein (1986) using the formula: (CM-SMmax)/ SMmax × 100 = % Integration. In this equation, SMmax was the neuron's response to the most effective unisensory stimulus and CM was the response to the multisensory stimulus. Both the category and magnitude of multisensory integration were tabulated and examined by cortical lamina. For further comparisons, the Shapiro-Wilk test for normality was used to determine if each dataset had a normal distribution. Where a normal distribution was verified, parametric tests (T-test, ANOVA, Tukey test) were used for further comparisons. If the data was not normally distributed, nonparametric statistical tests (Kruskal-Wallis,) were utilized. Kruskal-Wallis tests that reached significance were further analyzed using pairwise Wilcoxon rank sum tests with Bonferroni corrected significance levels (α/n). All statistical tests were performed utilizing the statistical software JMP (Statistical Discovery Software, SAS Institute Inc., Cary NC).
Anatomical Studies
Surgical Procedures
Ferrets (n=14) were anesthetized, (8mg/kg ketamine; 0.03mg/kg dexmedetomidine intramuscularly), their heads secured in a stereotaxic frame and, under aseptic conditions, a craniotomy was performed to expose the parietal areas of the suprasylvian gyrus. Supplemental anesthetics (8mg/kg ketamine; 0.03mg/kg dexmedetomidine intramuscularly) were administered as necessary. Temperature was maintained near 38°C with a circulating-water heating pad, and body temperature and heart rate were monitored continuously. Extracellular multiunit recordings were made to functionally identify the injection site using a glass-insulated tungsten electrode (tip exposure ~20μm, impedance<1MΩ) inserted to a depth (~750–850μm deep to the pial surface) that yielded vigorous neuronal activity. Neuronal discharges were amplified and played on an audio monitor. Somatosensory responsiveness was assessed using manually presented displacement of the skin or hairs (tapping with calibrated Semmes-Weinstein monofilaments, blowing); visual responsiveness was assessed using manually presented bars of light (from a hand-held ophthalmoscope) and dark (moving a rectangular piece of black cardboard) stimuli. Relatively anterior recordings that identified only somatosensory activity were indicative of somatosensory area SIII, consistent with previous descriptions of the area (Foxworthy and Meredith, 2011). More posterior recordings that encountered only visual responses were designated as the PPc (Manger et al., 2002). Between these two unisensory regions, recordings that simultaneously identified both somatosensory and visual activity revealed the location of the PPr (Manger et al., 2002). Once these different cortical areas were identified, one site was selected for tracer injection.
The tracer consisted of a 10% mixture (in phosphate buffered saline, pH 7.2) of 10,000 and 3,000 molecular weight biotinylated dextran amine (BDA; Invitrogen, Carlsbad CA), which promoted both anterograde and retrograde labeling with the same injection. The tracer was delivered iontophoretically through a glass micropipette (tip diameter between 20 and 40μm) that was lowered to the desired depth under a continuous retaining current of −2.75 μA. When a depth of 600–800μm was reached, positive current pulses (7s on, 7s off) of 6μA were delivered for 20 minutes, after which the current was switched off for ten minutes before withdrawing the pipette. The cortex was then covered with bone wax, the wound sutured closed, and standard postoperative care was provided.
Histological Procedures
Following a 10–14 day post-injection survival period, animals were given an overdose (Euthasol) and perfused intracardially with saline followed by fixative (4.0% paraformaldehyde). The brains were blocked stereotaxically, removed and cryoprotected. Coronal sections (75μm thick) were cut serially using a freezing microtome. One series of sections from each animal (at 150 μm intervals) was processed for BDA visualization using the avidin-biotin peroxidase method with heavy-metal intensification. Reacted sections were mounted on standard chrome-alum gelatin pre-treated slides, dehydrated and coverslipped. An alternate series of sections was processed to visualize cytoarchitectural features using the antibody SMI-32 (SMI-32R; Covance Inc.). The SMI-32 mouse monoclonal IgG1 antibody was prepared against the nonphosphorylated epitope of neurofilament H isolated from homogenized hypothalami from Fischer 344 rats. SMI-32 has been shown to visualize two bands (200 and 180kDa), which merge into a single neurofilament H line on two-dimensional blots (Goldstein et al., 1987; Sternberger, 1986; Sternberger and Sternberger, 1983). This protein is expressed in neuronal cell bodies, dendrites, and some thick axons in both the central and peripheral nervous system (Sternberger and Sterberger, 1983). SMI-32 immunreactivity has previously been shown to reliably distinguish the cortical layers in a variety of species including monkeys (Campbell and Morrison, 1989; Carmichael and Price, 1994; Del Rio and DeFelipe, 1994) and carnivores (Kaneko et al., 1994; van der Gucht et al., 2001), canines (Hof et al., 1996) and ferrets (Bajo et al., 2007; Homman-Ludiye et al., 2010; Keniston et al., 2009). Results from the above studies demonstrate that this antibody generally produced strong labeling in medium to large sized pyramidal neurons located in layers 3 and 5, as well as to demarcate the 6 cortical layers of the ferret PPr (Homman-Ludiye et al., 2010). An additional set of sections (n=3 ferrets) were processed for the antibody NeuN (Anti-NeuN, clone A60; Millipore; antibody to vertebrate neuron-specific nuclear protein). This mouse monoclonal IgG1 antibody was prepared against purified nuclei from mouse brain cells. The anti-NeuN antibody recognizes the DNA-binding, neuron-specific protein NeuN as 2–3 bands in 46–48 kDa range on Western blot analysis and possibly another band at approximately 66kDa (manufacturer's technical information; Luuk et al., 2008; Mullen et al., 1992). This antibody reacts with most neuronal cell types throughout the central and peripheral nervous systems (manufacturer's technical information) where staining is localized primarily in the nucleus of neurons with lighter staining in the cytoplasm (manufacturer's information).
Data Analysis
All processed tissue was examined using a light microscope and a PC-driven digitizing stage controlled by Neurolucida software (Microbrightfield Biosciences, Inc., Williston, VT). Each tissue section was traced to show its tissue outline and gray matter/white matter border. For injections made into the multisensory PPr (n=3 ferrets) to evaluate its anatomical inputs, the locations of retrogradely labeled neurons were plotted in every other BDA-processed section (300 μm interval). The injection site was defined as the region of densest label, usually at the end of the pipette track. BDA-labeled neurons generally were sharply black throughout their soma and dendrites. Labeled neurons were assigned to a specific cortical or thalamic region according to previously published reports of the functional organization of the ferret brain (Bajo et al., 2010; Foxworthy and Meredith, 2011; Homman-Ludiye et al., 2010; Innocenti et al., 2002; Keniston et al., 2009; Leclerc et al., 1993; Manger et al., 2002; 2004; 2008; 2010; McLaughlin et al., 1998; Rice et al., 1993) and local sulcal/gyral landmarks. All injections made into PPr in the different animals produced retrogradely labeled neurons in largely the same brain areas and, therefore, the data from the three animals was combined to determine the average number (and percent) of retrogradely labeled neurons in a given area. Plots of sections containing retrogradely labeled neurons were serially arranged and displayed using a standard graphics program.
Anterograde labeling of projections into PPr from BDA injections into somatosensory SIII (n=3 ferrets) or visual PPc (n=3 ferrets) were visualized with light microscopy and marked using Neurolucida software. Criteria for identification of labeled presumptive boutons, as in other studies (Allman et al., 2008; Clemo et al., 2007, 2008, 2011; Fuentes-Santamaria et al. 2009; Montiero et al. 2003) included a clear connection with an axonal process, occurring as either a symmetrical swelling on each side of the axon (bouton in passage) or at the end of a short, narrow extension (terminal bouton). Cut ends of axons and ambiguous swellings were not marked. Adjacent SMI-32 treated sections were used to visualize and trace the cortical laminae, upon which the plots of labeled boutons were superimposed. From this fused image, Neurolucida software was used to count the number of marked boutons occurring within each layer. This process was repeated until at least 5 sections (per injection locus) through the PPr per animal were evaluated. The laminar data was tabulated by injection site in a spreadsheet and combined to calculate the mean (and percent) of the laminar distribution of a given area's terminations within PPr. Plots of PPr sections containing orthogradely labeled boutons were displayed using a standard graphics program.
Local connections within PPr were assessed from cases (n=5) in which tracer injection into PPr was restricted to the supragranular layers. In these cases, tissue processing and data analysis of the laminar distribution of labeled boutons within the PPr was essentially the same as for the assessment of projections into PPr, described above. However, to control for the different sizes of the different laminae, bouton counts were converted to bouton density values by dividing by the area (mapped and calculated using Neurolucida) of each lamina. No attempt was made to compensate for unobservable boutons contained within the injection site.
Evaluation of the relative thickness (superficial-deep dimension) of each of the cortical laminae in PPr was measured in SMI-32 stained tissue obtained from 5 animals and 10 sections per animal. Using a light microscope with a digitizing stage and Neurolucida software, outlines were made of the six cortical laminae as well as the white matter and the pial surface. A line was digitally drawn through the cortical mantle perpendicular to the pial surface, and the software was then used to measure the thickness of each of the cortical laminae along this line. Measurements were made in the same manner of the laminae from the primary somatosensory area (S1) identified according to the criteria of (Foxworthy and Meredith, 2011; Leclerc et al., 1993; Rice et al., 1993). The thickness of laminae in ferret primary visual cortex (area 17; V1) was measured from published reports of the area that also used the SMI-32 immunostain (Homman-Ludiye et al., 2010; Innocenti et al., 2002). Adjacent sections processed for NeuN and SMI32 were photographed and compared to determine whether both stains revealed similar laminar dimensions.
Golgi-Cox Staining and Dendritic Spine Measures
Male ferrets (n=3; average 132 days old; 1.4 kg weight) were deeply anesthetized (sodium pentobarbital, 60 mg/kg i.p.) and perfused transcardially with 0.9% saline followed by fixative (4% paraformaldehyde). The brain was blocked stereotaxically in the coronal plane, removed from the cranium, and post-fixed for 24 hours in 4% paraformaldehyde. Blocks of cortex containing the PPr from both hemispheres were processed using Rapid GolgiStain Kit (FD NeuroTechnologies, Ellicott City, MD, USA). Following the prescribed incubations, the blocks were sectioned serially (100μm thickness) using a vibratome. Reacted sections were mounted serially on gelatin-coated glass slides, dehydrated, cleared and coverslipped.
The Golgi-Cox stained PPr tissue was surveyed using low magnification light microscopy to identify neurons that demonstrated an identifiable soma with intact apical and basilar dendrites and dendritic spines. Once a neuron was selected, the entire section, its laminar boundaries, and the neuron were reconstructed using a light microscope with a digitizing stage controlled by Neurolucida software. Selected portions of apical and basilar dendrites were identified and traced using high magnification (100× objective, oil), upon which the location of each visible dendritic spine was marked. Structures identified as dendritic spines included sessile spines (short extensions from the parent dendrite that lacked a neck constriction) and pedunculated spines (protrusions that exhibited a neck constriction, usually with a bulbous tip enlargement) according to the criteria of Stuart et al., (2007). Filopodia (regarded as immature or transitory spines) were infrequently observed and were not marked. To avoid artifacts related to low values, spines were marked on segments that could be followed for at least 40 μm. Because the incidence of dendritic spines diminishes near the neuronal soma, no spines were marked within 100μm of the cell body. This process was repeated until at least one apical and 2–4 basilar dendritic segments were measured in 8–12 neurons from each cortical layer from each animal. Because this technique severs large segments of each neuron's dendritic tree, no attempt was made to evaluate the dendritic morphology or branching patterns.
The plots of dendrites with their dendritic spines were analyzed with NeuroExplorer (MBF MicroBrightfield, Willston VT, USA) software to determine the length of dendrite measured and the number of spines that occurred along that segment. These measurements were used to calculate spine density (spines/μm) which was tabulated according to laminar location, dendritic location (apical, basilar), and dendritic branch order. Statistical methods were used to determine the average, and standard error of the mean, of spine densities for the different variables and their combinations. The Shapiro-Wilk test determined that these data showed a normal distribution and parametric statistics (ANOVA, with post-hoc Tukey) tests were applied. Following data analysis, representative dendritic segments were photographed (Nikon Eclipse 60). Images were imported to Photoshop (Adobe Systems) for graphic manipulation (i.e., rotation, tiling, brightness adjustment) and display. Selected neurons were also traced using a light microscope (Nikon E-400) equipped with a camera-lucida attachment and then graphically displayed.
RESULTS
Lamination of PPr
In agreement with previous studies (Manger et al., 2002; Foxworthy and Meredith, 2011), the rostral posterior parietal area (PPr) was identified between somatosensory area SIII (rostral) and visual area PPc (caudal), as illustrated in Figure 1. As in the other regions of ferret neocortex, the PPr exhibited six distinct layers that were evident when processed with SMI-32, as depicted in Figure 1A. Here, layer 1 appears mostly devoid of label; layer 2 had short stained fibers that ran mostly perpendicular to the pial surface; layer 3 contained darkly stained pyramidal neurons; layer 4 was extremely thin and mostly devoid of neurons and label; layer 5 contained darkly stained pyramidal neurons, but sublamination was not discernable (see also Yamamoto et al., 1987); layer 6 was mostly devoid of label and ended where the white matter began. In tissue reacted for NeuN, seen in Figure 1B, the same pattern of lamination was generally evident although the NueN labeling in layer 4 was now evident as sparse patches of small neuronal somata. Examination of layer 4 from Golgi-Cox stained tissue revealed occasional small pyramidal neurons and aspiny non-pyramidals, but definitive examples of spiny stellate neurons were not observed. Measurements of laminar thickness showed that, on average, about 52% of the cortical mantle was occupied by supragranular layers 1 (11.8%), 2 (17.2%) and 3 (22.5%) and 40% by infragranular layers 5 (20.1%) and 6 (20%), while the narrowest lamina of all was layer 4, which represented only an average 8.5% of the cortical thickness. These relative measures are depicted for PPr laminae in Figure 1C and are compared with laminar measurements from ferret primary visual (V1) and primary somatosensory (S1) cortices.
Figure 1.

Location and lamination of ferret rostral posterior parietal (PPr) cortex. In the box (top-right), a lateral view of the ferret cortex shows the location of the (PPr), which is between somatosensory area III (SIII) anteriorly, and the visual caudal posterior parietal cortex (PPc), posteriorly. Also depicted: the primary somatosensory cortex (S1), and, inside the opened suprasylvian sulcus, the medial rostral suprasylvian sulcal area (MRSS), and the anteromedial lateral suprasylvian sulcal area (AMLS). The thick gray line indicates the level from which sections in A–B were taken. The photomicrographs are from adjoining coronal sections through the PPr stained for SMI-32 (A) and NeuN (B), with enlargements (below) focused on layer 4. The laminar boundaries revealed by both SMI-32 and NeuN appear similar. In the enlargement of part (A), SMI-32-labeled pyramidal neurons of layers 3 and 5 are apparent, but layer 4 in between is largely devoid of label. In the enlargement of part (B), NeuN-stained pyramidal neurons of layers 3 and 5 are evident, as are patches of small, rounded neuronal somata in layer 4. Scale for upper images = 500μm; lower images = 100μm. In (C), the line graph summarizes the average thickness of the different cortical laminae (measured from SMI-32 stained tissue) from PPr and S1; V1 data measured from published figures (Homman-Ludiye et al., 2010; Innocenti et al., 2002). Error bars indicate standard error.
Sensory Responses of the PPr
To assess the laminar distribution of sensory and multisensory neuronal properties in the PPr, multi-channel single-unit recordings were performed in 15 different sites (in 13 ferrets) on the suprasylvian gyrus. A representative example is depicted in Figure 2. The recordings yielded a total of 451 sensory responsive neurons that were histologically verified within the PPr. All PPr neurons were tested with standardized computer-generated visual, tactile, and combined visual-tactile stimulation. Responses to these sensory tests defined a given neuron as bimodal-multisensory (50%; 225/451), subthreshold-multisensory (14%; 62/451), unisensory tactile (23%; 103/451), or unisensory visual (13%; 61/451) and representative examples of each are provided in Figure 2. The proportions of neuron types in the PPr, summarized in Figure 3A, were statistically different (Kruskal-Wallis; p = 0.0002). Multiple nonparametric comparisons (α=0.05; α/4=0.0125) showed that bimodal neurons were significantly more prevalent than unisensory visual (p=0.0062), unisensory tactile (p=0.0004) and multisensory subthreshold (p < 0.0001) neurons. The other groups did not differ significantly from each other. In the PPr, response latency to visual stimulation averaged 93.7ms while latency to tactile stimulation averaged 51.5ms, with responses occurring significantly (t-test; visual p=0.0049; tactile p=0.0092) earlier in the supragranular than infragranular layers. These latency values are quite similar to those observed for visual (78–92ms) or tactile (36–45ms) responses in parietal cortex of awake monkeys (Avillac et al., 2007). These data confirm that the ferret PPr not only contains a mixture of visual and tactile neurons (as reported by Manger et al., 2002), but also establishes that the area contains a preponderance (64%) of neurons affected by both sensory modalities: multisensory neurons.
Figure 2.

Electrophysiological recording and neuron classification of PPr sensory neurons. This cresyl violet stained coronal section through the PPr (left=medial; scale bar = 1000μm) shows the location of a scaled schematic of the 32-channel recording probe from one experiment. Screen-shot (lower left) of recorded waveforms from one site demonstrate cluster-cutting and waveform discrimination for identification of single-unit activity (black=1 unit; gray=2nd unit). The black dots on the probe (A–D) indicate the recording locations that correspond with the neuronal activity represented by the histograms on the right. In these data panels, the stimuli are represented by the ramps above the histogram: V = visual; T = tactile; VT = combined. The bimodal neuron (A) responds independently both to V and to T stimulation. The unisensory tactile (B) and visual (C) neurons are activated or influenced by only one sensory modality. The subthreshold multisensory neuron (D) shows activation by one sensory modality (visual in this example) but not by the second sensory modality, yet shows significantly different spiking activity when the visual and tactile stimuli are combined. Histogram time-bins = 10ms.
Figure 3.
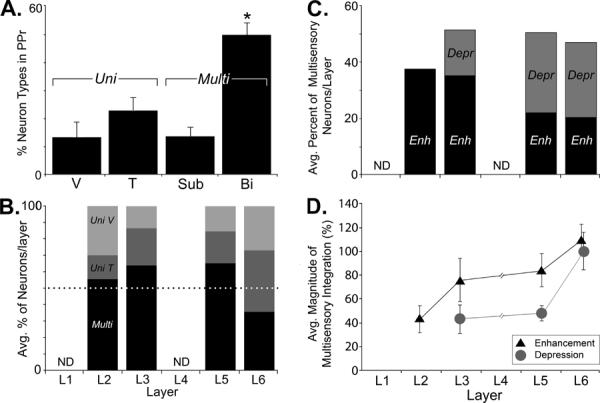
Sensory neuron types and laminar multisensory properties of the PPr. (A) The bar graph shows the percentage (± s.e.) of the different sensory neuron types found in PPr. Of the neurons responsive to sensory stimulation, the majority (64%) were multisensory (Multi), either as subthreshold (Sub) or bimodal (Bi) neurons. Many fewer unisensory (Uni) tactile (T) or visual (V) neurons were encountered. The incidence of bimodal neurons was significantly greater than the other neuron types (asterisk). (B) Within each PPr layer, multisensory (`Multi;' black bars) predominate (>50%, above dotted line) except in L6. Accordingly, proportionally fewer unisensory tactile (dark gray) neurons and unisensory visual neurons (light gray) were observed in all layers but layer 6 (values = average percentage of neuron types by lamina; see text for variance). Too few neurons were localized to layers 1 and 4 for comparisons (ND = not sufficient data). (C) Neurons in PPr, when exposed to multisensory stimulation, showed enhanced (black, “Enh”) or depressed (gray, “Depr“) responses (values = average percentage of multisensory neurons; see text for variance). Supragranular layer (L2–3) neurons showing integrated responses mainly generated enhancement, while those in infragranular layers (L5–6) showed a mixture of depressed or enhanced responses. (D) The average magnitude of multisensory integration (Enhancement = black triangles; Depression = gray circles) tended to increase in the deeper laminae (error bars indicate SE). See text for statistical treatments.
Several histologically-confirmed recording penetrations in the visual area PPc (n = 5) were also examined using the same standard presentations of visual, tactile, and combined visual-tactile stimulation, while additional penetrations (n = 3) in somatosensory area SIII received the same treatment. In the PPc, all neurons (118) exhibited suprathreshold activation in response to only visual stimuli, while a small proportion (13/118; 11%) had visual responses that were significantly altered by combined visual-tactile stimulation. For the PPc, visual response latency averaged 66.5ms. On the other hand, SIII neurons (78) responded to tactile but not visual stimulation presented alone, although a few (7/78; 9%) had somatosensory responses that were significantly modulated by combined tactile-visual stimulation. For SIII, tactile response latency averaged 40.7 ms. These results, confirm previous experiments that identified SIII as an essentially unisensory tactile area (Foxworthy and Meredith, 2011) and PPc as an essentially unisensory visual area (Manger et al., 2002).
Laminar Distribution of Sensory and Multisensory Neurons in PPr
The laminar distribution of unisensory and multisensory neurons within the PPr was analyzed from the histological reconstructions of the recording sites, and the average percentage of each neuron type (multisensory, unisensory tactile, unisensory visual) was calculated by lamina. No penetrations identified sensory-responsive units in lamina 1. Additionally, only 3 penetrations had recording sites localized in layer 4, from which a total of 12 neurons were identified. Of those layer 4 neurons, 7 were found near the borders of either layer 3 or layer 5, where the responses of large pyramidal neurons could dominate the recording signal. Because recordings in layer 4 yielded an insufficient number of units whose laminar attribution could be ambiguous, data from this layer were not included in the subsequent analysis. Based on data from layers 2, 3, 5 and 6, multisensory neurons were not uniformly distributed across the PPr laminae. As illustrated in Figure 3B, multisensory neurons were the majority of neurons identified in layers 2 (55%), 3 (65%) and 5 (65%), but not in layer 6 (35%). Conversely, unisensory neurons predominated in layer 6 (65%), but not in layers 2 (45%), 3 (35%) or 5 (35%). This distribution of multisensory and unisensory neurons varied significantly by laminae (ANOVA; (F(3,36)=5, p <0.006). A post-hoc Tukey test indicated that layers 3 and 5 had significantly more multisensory neurons than layer 6. Statistical tests (ANOVA; (F(3,36)=5, p<0.006) also showed that the proportion of unisensory neurons varied significantly by layer, a trend that was supported by post-hoc Tukey tests. However, the distribution of unisensory visual versus unisensory tactile neurons did not vary significantly within layers (t-tests, α = 0.05). Thus, the majority of PPr neurons were multisensory and this pattern of multisensory dominance was preserved within layers 2–3 and 5, but not for layer 6.
The average response (mean spikes/trial) to unisensory (visual alone, tactile alone) and multisensory stimulation (combined visual and tactile) was compared across the different laminae. Statistical analysis (Kruskal-Wallis) of laminar responses showed that the average magnitude of responses by layer did not differ to tactile (p=0.471), visual (p=0.107), or multisensory stimuli (p=0.423).
Laminar Distribution of Multisensory Integration in PPr
Not every multisensory neuron generates integrated multisensory responses. Accordingly, the percentage of multisensory PPr neurons that met the criterion for demonstrating multisensory integration was evaluated by layer. As in the analyses above, layer 1 and layer 4 lacked sufficient data to be included in these comparisons. Integrative multisensory neurons in layers 2–3 tended to generate enhanced responses (L2=38%; L3=35%) to combined stimulation, while few examples of response depression were observed (L2=0%; L3=16%). On the other hand, multisensory neurons in layers 5 and 6 showed enhanced (L5=22%; L6=20%) or depressed (L5=28%; L6=27%) multisensory responses. These results are depicted in Figure 3C. Statistical tests (Kruskal-Wallis) indicated that the proportion of neurons showing enhanced (p=0.634) or depressed (p=0.163) responses did not differ significantly by the individual laminae. When the data was re-grouped by supragranular (L2–3) and infragranular (L5–6) location, this treatment revealed that that the proportion of neurons showing multisensory enhancement did not significantly differ (Wilcoxon rank sum; p=0.494) between supra- (36.7%) and infra-granular (23.8%) locations. However, a significant difference (Wilcoxon rank sum; p=0.0432) was found in the share of neurons showing multisensory depression between supra- (6%) and infra-granular (25%) locations. Thus, laminar differences in the incidence of multisensory response depression were apparent within the PPr.
For neurons demonstrating multisensory integration, the magnitude (measured as percent of response increase or decrease) of multisensory integration was also analyzed by laminae. These results are depicted in Figure 3D. These analyses showed that the average level of multisensory enhancement tended to increase in the deeper laminae (L5=84%; L6=110%) versus the supragranular layers (L2=43%; L3=76%). A similar trend was observed for neurons showing multisensory depression, where layer 2 neurons exhibited no response depression at all, layers 3 and 5 showed an average 43% and 46% (respectively) depression, while layer 6 neurons averaged 100%. Statistical tests (Kruskal-Wallis) however, failed to show that the average magnitude of enhancement (p=0.142) or depression (p=0.119) differed significantly among the individual layers.
External Sources of Projections to PPr
Because multisensory processing is dependent on the convergence of information from different sensory systems, anatomical experiments were conducted to evaluate the connectional bases of sensory and multisensory activity in the PPR. To assess the sources of extrinsic inputs to the multisensory PPr, tracer (BDA) was injected (n=3 ferrets) into the PPr under electophysiological guidance. Following processing, the injection sites were determined to be confined to the gyral gray matter and exhibited an area of densely stained neuropil. Darkly stained, retrogradely labeled neurons were found in distinct areas of the cortex and thalamus. A representative case is summarized by the serially arranged coronal sections through the cortex ipsilateral to the injection site in Figure 4, and through the ipsilateral thalamus in Figure 5. As can be seen in Figure 4C, retrogradely labeled neurons were found anteriorly in primary motor cortex (M1), the medial rostral suprasylvian cortex (MRSS), the primary somatosensory cortex (S1), and the third somatosensory cortex (SIII) and posteriorly in the caudal posterior parietal cortex (PPc), and the anteromedial lateral suprasylvian visual area (AMLS). In Figure 5, the retrograde tracer labeled the pulvinar (Pul), the lateral posterior nucleus (LP), and the ventral anterior nucleus (VA). When the data from all the cases with PPr injections was combined (n=3 ferrets; 1,205 neurons), a distinctive pattern of retrograde labeling was observed, as summarized in Figure 6. Overall, the greatest proportion of labeled neurons in a somatosensory region was found in the SIII (42.3% ± 9.3 SE). For the sources of visual inputs to PPr, the highest proportion of labeled neurons were identified in the PPc (15.5% ± 5.2). Retrogradely labeled neurons were also found in somatosensory areas S1 (19.8% ± 5.8) and MRSS (4.7% ± 3.1) and in the visual area AMLS (5.6% ± 3.7). Few neurons were found in motor area M1 (1% ± 0.7). Relative to cortically labeled neurons, comparatively few neurons were identified in the thalamic nuclei: the lateral posterior-pulvinar thalamic complex (LP-Pulv, 4.8% ± 1.7) and the VA (6.3% ± 2.3). These results confirm that the present tracer injections were contained within PPr and were consistent with published thalamo-cortical connections to ferret PPr (Manger et al., 2002). Additionally, tracer injected into PPr in the present experiments did not label thalamic nuclei that are labeled by injection of the adjacent areas SIII or PPc (Manger 2002; Foxworthy and Meredith, 2011). In summary (see Figure 6), these data show that the major sources of somatosensory and visual inputs to PPr are somatosensory area SIII and visual area PPc.
Figure 4.
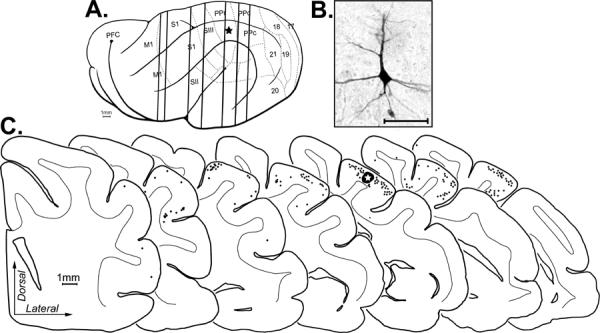
Tracer (BDA) injected into PPr produced retrogradely labeled neurons within the ipsilateral cortical hemisphere. Depicted is an example of a BDA injection made in PPr (indicated by star in lateral overview and the large, blackened/starred area on the 5th coronal section). (A) Vertical lines passing through the brain correspond to the coronal sections shown below. Each retrogradely labeled neuron (an example is shown in the photomicrograph (B); scale = 50 μm) was marked with a single black dot on the coronal sections (C; at bottom). The coronal sections are arranged serially (anterior = left) with the gray-white border of the cortical mantle indicated (thin line. Retrogradely labeled cortical neurons were present in functional areas SIII, MRSS, S1, M1, AMLS, and PPc.
Figure 5.
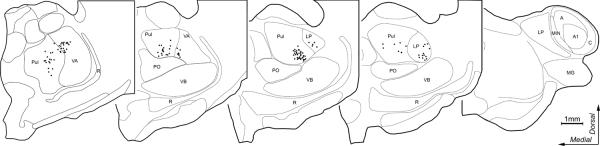
Retrogradely labeled thalamo-cortical neurons from PPr tracer injection. The coronal sections through the thalamus are arranged with anterior (left) to posterior (right); (subdivisions after the criteria of Manger et al., 2002; 2010). Each black dot represents the location of one retrogradely BDA labeled thalamo-cortical neuron. Labeled neurons were found in the pulvinar (Pul), rostral portions of the lateral posterior nucleus (LP), and the ventral anterior nucleus (VA). No label was seen in the posterior nucleus (PO) or any portion of the lateral geniculate nucleus (A=A lamina of LGN; A1=A1 lamina of LGN; C=C lamina of LGN), MIN=medial interlaminar nucleus, MG=medial geniculate nucleus, R=reticular nucleus, or VB=ventrobasal complex.
Figure 6.
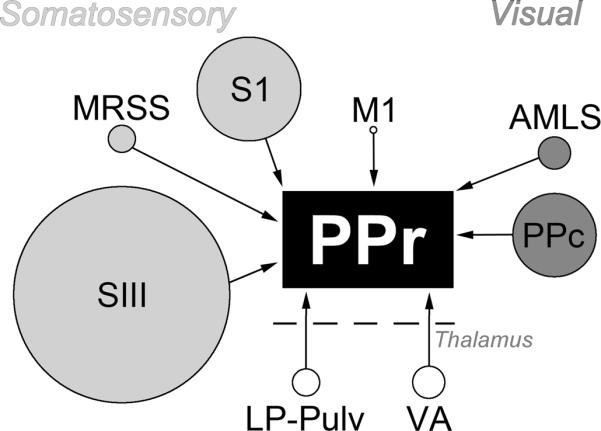
Summary of sources of ipsilateral projections to the PPr. Each source of input to the PPr (central black rectangle) is represented by a circle. The source of each input, somatosensory (light gray), visual (dark gray), motor (M1) and thalamic area (bottom of diagram), is scaled to represent the proportion of the entire projection that originated from the indicated region. The majority of somatosensory inputs to the PPr arose from cortical area SIII and the majority of visual inputs are derived from cortical area PPc, while relatively few originated in the thalamus.
Distribution in PPr of Boutons Labeled from External Sources
Because a majority of neurons in PPr exhibited visual-somatosensory multisensory properties, a potential substrate for this convergence would be for inputs from visual and somatosensory sources to spatially overlap within the PPr. To examine this possibility, tracer (BDA) injections were made, under electrophysiological guidance, into the major cortical sources of somatosensory (area SIII; n=3) and visual (area PPc; n=3) inputs to the PPr. After transport and processing, labeled boutons in the PPr were visualized using light microscopy where they appeared as darkly stained swellings attached to axons either along the length of the axon (boutons in passage) or as terminal boutons at the ends of axonal processes, as demonstrated in Figure 7. The laminar distribution of labeled axon terminals was assessed using alternate sections through the rostro-caudal extent of the PPr, where the laminar boundaries traced from an SMI-32 labeled section were digitally superimposed onto the plot of an adjacent section containing BDA-labeled boutons. At least 5 merged sections per case were examined and a total of 187,228 BDA-labeled boutons were plotted. As depicted in Figure 8, labeled boutons from SIII and PPc were identified throughout the PPr. However, the distribution of labeled boutons in PPr differed substantially by cortical layer (ANOVA; SIII= F(5,12)=37.2; p <0.0001; PPc= F(5,12)=20.7; p<.0001), and post-hoc Tukey tests indicated that layers 2–3 received the strongest projections from each cortical area. The differential laminar distribution of boutons labeled from SIII or PPc are graphed in Figure 8, indicating that 63% of all boutons labeled from SIII and ~58% of axon terminals labeled from PPc terminated in layers 2–3. Thus, the densest inputs from the different sources targeted the same laminae and, thereby, demonstrated a spatial overlap among their projections. In contrast, the infragranular layers, especially layer 6, exhibited dramatically lower levels of extrinsic inputs. Thus, layers 2–3 exhibited the highest concentrations of inputs from both extrinsic sources which, as a consequence, increased the likelihood of convergence occurring within those layers.
Figure 7.
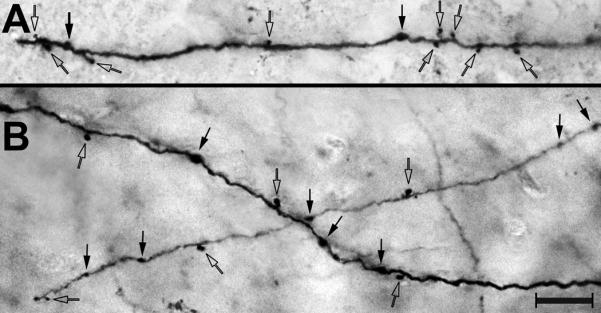
Labeled axon terminals in PPr. Following BDA tracer injection in somatosensory area SIII (A) or visual PPc (B), labeled axon terminals (boutons) were visualized in the PPr using a light microscope (40× objective). Both terminal boutons (open arrows) and boutons in passage (closed arrows) were observed. Scale = 10μm.
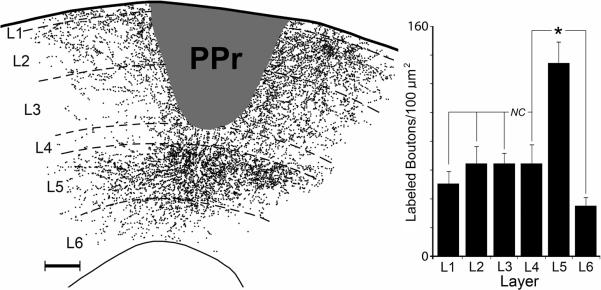
Figure 8.

Axon terminal distribution in PPr labeled from BDA injections into SIII or PPc. Depicted are examples of digitally plotted coronal sections through PPr (scale = 1000μm) showing the laminar distribution of axon terminals (1 dot = 1 labeled bouton) that were orthogradely labeled from somatosensory area SIII (A) or visual PPc (B). The thin black lines represent the laminar borders (L1–L6) traced from an adjacent SMI-32 stained section. The histogram bars represent the average percentage of axon terminals by laminae in the PPr (error bars = standard error; asterisks = statistically significant) also demonstrate that SIII and PPc inputs predominantly target and overlap in layers 2 and 3 of PPr.
Intrinsic Connections of PPr
Tracer (BDA) injections that were restricted to specific laminae in the PPr (n=5) were used to identify patterns of intrinsic connections within the PPr. All cases involved supragranular injections (layer 3 and above), as depicted in the example in Figure 9. Plots of the labeled boutons revealed local supragranular projections to all layers where horizontal connections (to L1–3) and vertical connections (L4–6) were evident (vertical connections within L1–2 could not be measured as they were obscured by the injection site). For the 5 cases examined, a total of 43,402 BDA-labeled boutons were plotted and their differential laminar distribution is summarized in the bar graph in Figure 9. Because not all supragranular intralaminar connections could be accounted for using this technique, comparisons of supragranular labeling could not be made. However, within the granular and infragranular layers, the density of labeled boutons differed significantly (ANOVA (F(2,12) = 18.8, p<0.0002), and post-hoc Tukey tests showed that layer 5 received a significantly higher density of projections from supragranular injections than did layers 4 or 6, while the projections to these other laminae did not significantly differ from each other. Although it is possible that some labeled boutons resulted from collaterals of labeled layer 5 neurons, few layer 5 neurons were retrogradely labeled in these cases, rendering this possibility a minor effect. It should also be noted these injections labeled both excitatory and inhibitory neurons and their projections, which cannot be discriminated with this anatomical technique. Collectively, these results demonstrate that translaminar projections originating from the supragranular layers of the PPr heavily terminate in layer 5.
Figure 9.
Local projections within PPr. The coronal section through the PPr shows the center of a tracer injection (BDA, dark gray area) that was contained within the supragranular layers (scale-100μm). This injection produced labeled axon terminals (1 dot = 1 bouton) across the different cortical laminae (1–6), but were most dense in layer 5. The bar graph (right; n = 5 ferrets) summarizes the distribution of observable local axon terminals labeled from injections in the PPr supragranular layers. While terminal labeling in layer 5 was significantly denser than that within layers 4 or 6, comparisons the supragranular layers could not be made (NC) because putative vertical connections between L2–3 could not be observed (obscured by injection site). Asterisk=statistically significant.
The potential neuronal recipients receiving the translaminar projection from the supragranular layers were evaluated using Golgi-Cox stained tissues and camera-lucida neuronal tracings. For example, in Figure 10, layer 5 and 6 neurons were reconstructed to the extent that their primary apical dendrite could be followed. From this figure, it is evident that the distributions of layer 5 and 6 neurons are quite different as potential recipients of intrinsic and/or extrinsic projections. While the apical dendrites of layer 5 neurons consistently distribute through layers 2–3 where they potentially receive high-density inputs from extrinsic sources, their proximal segments and basilar dendrites (not depicted) are arranged to receive dense translaminar inputs projecting from layer 2–3 neurons. In contrast, layer 6 neurons are arrayed such that translaminar layer 2–3 projections might best contact their distal apical dendrites, while their basilar dendrites (not depicted) are remote from both extrinsic and intrinsic sources of connections. Thus, the differential distribution of neurons and their processes from layers 5 and 6 appears to be consistent with the differential expression of multisensory properties in these same layers.
Figure 10.
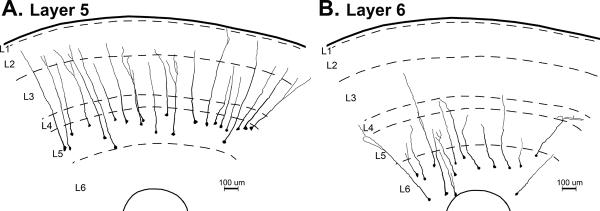
The differential distribution of PPr layer 5 and layer 6 neurons. From Golgi-Cox stained coronal sections through the PPr, camera-lucida drawings show the layers (L1–L6; dashed lines). Also reconstructed are the neuronal somata and apical dendrites (to their furthest, traceable extent) of (A) layer 5 and (B) layer 6 neurons. Note that the layer 5 neurons consistently extended into the supragranular layers, while layer 6 neurons' apical dendrites were largely contained within infragranular locations.
The question of whether connections from external sources and/or local projections could provide the substrate for multisensory convergence in the PPr was assessed by superimposing the data from these different experiments (Figures 3B, 8, 9) onto a single graph illustrated in Figure 11. This depiction revealed that the highest proportion of axon terminals from somatosensory area SIII and from visual area PPc (black lines) occurred within the layers 2–3 of the PPr, where a majority of multisensory neurons were also located (bar graphs). In addition, the highest proportion of translaminar projections from the supragranular, multisensory layers of the PPr (dotted line) terminated in layer 5, which is a layer (bar graph) that also exhibited a majority of multisensory neurons. Conversely, proportionally few extrinsic (black lines) or local (dotted line) connections were observed to within layer 6, where the fewest multisensory neurons (bar graph) occurred. Taken together, these data are consistent with the notion that the overlap of multiple sensory projections provides the substrate for multisensory convergence onto individual neurons, which is supported by single-cell imaging studies of multisensory convergence (Keniston et al., 2010; Meredith et al., 2012).
Figure 11.

Correspondence of laminar connectional and functional properties of PPr. The preferential laminar distribution of converging extrinsic connections from SIII and PPc (solid black lines, scale=left; replotted from Fig 8A–B) into layers 2–3 corresponds to the presence of multisensory neurons in layers 2–3 (histogram bars; scale=right; replotted from Fig.3B) while supporting mostly unisensory processing in layer 6. In addition, intrinsic, translaminar projections from multisensory supragranular layers (dotted line; note different scale=left; replotted from Fig 9) carry signals largely to layer 5, which is a layer that is also characterized by a high level of multisensory neurons (histogram bar; replotted from Fig. 3B).
Dendritic Spine Density
Dendritic spines are the major site of excitatory inputs to cortical principle neurons. Given that there was a differential distribution for extrinsic, as well as local connections within the PPr, it seemed likely that there would be a corresponding differential distribution of dendritic spine occurrence by lamina within the PPr. A total of 63 Golgi-stained PPr pyramidal neurons from layers 2, 3, 5 and 6 were examined for measures of their dendritic spine density (excitatory neurons are not characteristically found in layer 1; stained neurons with intact dendrites were not obtained from layer 4). Dendritic spines were visualized using oil-immersion light microscopy, as depicted in Figure 12A. For each dendritic segment examined (n=423), its branch order, branch layer and soma layer were recorded along with the dendritic spine counts per micron (spine density). In the present sample, measurements were derived from dendritic branch orders 1 through 11and >93% of the data was derived from dendritic branch orders 2–6. For the entire PPr sample, the overall spine density for all neurons in all layers averaged 0.94 spines/μm (±0.27 sd). However, spine density values were not uniformly distributed across the PPr laminae, but were significantly (p<0.0001, t-test) higher for dendrites located in the supragranular, rather than infragranular layers, and this distinction was maintained within each animal (p<0.026, t-test). Significant differences in the density of dendritic spines were also observed for neurons located in the different layers (ANOVA, F(3, 419) =19.3; p<0.0001). Post-hoc Tukey tests revealed that significantly (p<0.0001) higher values of spine density were observed for dendrites of neurons whose soma were located in layers 2 or 3, than those residing in layers 5–6, and this trend is illustrated in Figure 12B. Furthermore, the density of dendritic spines varied significantly with the layer in which the dendritic segment itself resided. Figure 12C shows that while the range of spine densities was fairly similar for each layer, fewer examples of high spine density were observed with deeper the laminar locations. In fact, dendritic segments in layer 2 showed amongst the highest average spine density (1.08 ± 0.29 sd) while those in layers 5–6 showed the lowest (0.86 ± 0.028). This trend was statistically significant (ANOVA, F(5,417)= 9.31; p<0.0001), with post-hoc Tukey tests revealing significant differences between spine measures in layer 2 and in layers 3, 5, 6 (p<0.0027).
Figure 12.

(A) Photomicrographs (100× objective, oil) from PPr neurons showing typical dendritic segments with their attendant dendritic spines from the supragranular (SG) and infragranular (IG) layers. Scale bar = 10 μm. (B) PPr neurons with cell bodies/soma located in a given layer (no neurons were measured in layers 1 or 4) exhibited a range of dendritic spine densities that averaged the highest for supragranular neurons. A line connects average values for each layer. (C) When the laminar location of the dendritic segments was considered, a range of spine densities was observed within each layer that averaged the highest in the supragranular layers. A line connects average values for each layer. See text for statistics.
As described above, neurons and dendritic segments that resided in the supragranular layers tended to exhibit higher spine densities than their infragranular counterparts. However, this trend did not seem to be purely laminar dependent, as is depicted in Figure 13. Despite having among the highest average spine density values, neuronal soma located in layers 2–3 exhibited significantly higher (ANOVA, F(2,133)= 3.25; p=0.043; with post-hoc Tukey tests) dendritic spine densities on segments located in layer 2 than in the other layers in which they were present. In contrast, neuronal soma residing in layer 5 (ANOVA, F(3,109)= 1.89; p=0.13) or 6 (t test, p=0.93) had low spine density values that did not vary significantly among the layers in which their dendritic segments were found. Thus, while neurons in some of the layers demonstrated spine density values that varied across the laminae they occupied, others did not. A possible mechanism for this trend may be that the patterns of spine density for the different layers mirror the laminar pattern established by the extrinsic inputs (see Figure 8), representing a correspondence between inputs/boutons with dendritic spines in the formation of excitatory synapses. However, as shown in Figure 13, layer 5 neurons did not adjust their dendritic spine values, even in the layers that received the translaminar inputs from layer 2–3 (shown in Figure 9). If this is true, perhaps there may be a difference in synaptic weighting between boutons derived from extrinsic versus intrinsic projections, or a large proportion of intrinsic boutons might connect with inhibitory interneurons (not sampled in this study). These data also demonstrate that neurons in the multisensory layers 2–3 can exhibit significantly higher spine density values than their counterparts in multisensory layer 5. These laminar differences in spine density on putative multisensory neurons are consistent with the observation that synaptic load/dendritic spine density is not predicated on the number of sensory modalities that converge in a given region (Clemo and Meredith, 2012).
Figure 13.

PPr neurons with their body/soma located in a particular layer (Soma in L2, L3, L5, or L6) exhibited dendrites that extended into other layers (Dendrite Layers = L1–L6). Neurons in the supragranular layers (Soma in L2 or L3) had dendrites that exhibited relatively high and significantly different (asterisk) spine densities in different layers, but neurons in the infragranular layers (Soma in L5 or L6) had dendrites that essentially showed the same (NS=not significant) low spine density values regardless of the layer in which the dendrites were located. See text for statistics.
DISCUSSION
The present results demonstrate that the ferret PPr, a robustly multisensory cortical region, not only exhibits laminar features specific for multisensory processing, but also performs this function in a manner that is distinct from lower-level unisensory cortices. The evidence also indicates that the multisensory properties of PPr cortex are based largely on the convergence of extrinsic, corticocortical inputs. As summarized in Figure 14, the ferret PPr is characterized by somatosensory and visual responses, with the greatest proportion of inputs from representations of the somatosensory and visual modalities arriving from areas SIII and PPc, respectively. Supporting this connectional arrangement, measures of tactile and visual response latency indicate that both SIII and PPc are activated earlier than responses in the PPr, which is consistent with inputs from SIII and PPc activating the PPr. In addition, the receptive fields in the PPr demonstrate a superimposition of those found in SIII and PPc (Foxworthy and Meredith, 2011; Manger et al., 2002). Both of these input regions have been identified as unisensory (SIII, Foxworthy and Meredith, 2011; PPc, Manger et al., 2002; present study), as were most of the other sources of cortical inputs to the PPr. Only inputs from non-specific thalamus could be regarded as originating from multisensory areas, and these represent only a small fraction of total inputs to the PPr. Thus, these observations indicate that the multisensory properties of PPr neurons are most likely the result of convergence of inputs from different unisensory regions rather than from multisensory sources.
Figure 14.

Summary of the laminar organization of connectivity and unisensory/multisensory properties of PPr. The differential laminar distribution of converging extrinsic connections from unisensory areas SIII and PPc (large, light gray arrows scaled in proportion) favors the generation of multisensory properties in neurons of layers 2–3, which also exhibit a high density of dendritic spines presumably to accommodate the high number of inputs. Intrinsic, translaminar connections (labeled: “local connex”) of layer 2–3 neurons can relay multisensory signals (small, dark grey arrows) largely to layer 5. In contrast, few extrinsic or intrinsic projections reach layer 6, where most neurons are unisensory and exhibit low dendritic spine densities. Output targets of the multisensory layers of the PPr are known to be multisensory, while the output targets of the unisensory layer 6 largely target unisensory areas. This arrangement suggests that unisensory and multisensory signals can be processed in parallel as they route through the PPr circuit. Dotted lines = laminar boundaries. SIII = somatosensory area III; PPc=visual caudal posterior parietal area. Light gray arrows = extrinsic inputs; dark gray arrows = intrinsic connections, black arrows=outputs.
Laminar organization of multisensory properties
Analysis of the laminar distribution of unisensory and multisensory neurons within the PPr revealed that multisensory neurons predominated in layers 2–3 (55–65%), and 5 (65%), but not layer 6 (35%). Similarly, segregation, or clustering of multisensory neurons has also been observed in multisensory superior temporal sulcal cortex (Dahl et al., 2009). In the present study, not only were multisensory neurons differentially distributed by laminae, but also multisensory processing showed a differential laminar distribution across the PPr: both the proportion of neurons demonstrating integration, as well as the magnitude of multisensory integration, tended to vary between supra- and infragranular layers. Such differential distributions of multisensory response features in the PPr appear to be based on the connectivity of the region from extrinsic and local sources.
Laminar organization of input connections
Extrinsic inputs from SIII /PPc preferentially converged in layers 2–3 of the PPr, as summarized in Figure 14, which corresponded with the preponderance of multisensory neurons identified in those layers. On the other hand, reduced extrinsic projections to layer 6 of the PPr were accompanied by reduced levels of multisensory neurons there. This differential distribution of inputs was also paralleled by a differential distribution of dendritic spine densities across the laminae of the PPr. This relationship between converging inputs and multisensory incidence is supported by computational simulations of multisensory convergence (Lim et al., 2011; Meredith et al., 2012).
Laminar organization of intrinsic connections
Given the high proportion of multisensory neurons in layers 2–3 of the PPr, it is expected that outputs from these neurons relay multisensory signals to subsequent neurons in the local circuit. Tracer injections into these layers revealed intrinsic connections to all other laminae and showed an especially dense projection to layer 5. Similar projections from layers 2–3 to layer 5 have been reported in other areas and preparations (Briggs and Callaway, 2005; Hooks et al., 2011; Weiler et al., 2008), suggesting that this is a highly-conserved neocortical pathway. Multisensory neurons predominated in layer 5, but layer 5 neurons have unique anatomy that suggests their multisensory properties are based on more than their local inputs. Layer 5 neurons have basilar dendrites also in layer 5, where they are positioned to receive the massive local projection from the multisensory supragranular layers. In addition, layer 5 neurons have apical dendrites that extend directly into the supragranular layers, where they are positioned to receive connections from the extrinsic unisensory sources. Therefore, layer 5 multisensory neurons receive both convergent (extrinsic: from PPc/SIII) and converged (intrinsic) forms of multisensory inputs in a spatially segregated manner, as diagrammed in Figure 14. Of course, some extrinsic projections overlap with local connections within the other cortical laminae, but their distribution in those regions was more diffuse and less spatially restricted to one set of dendrites or another. On the other hand, layer 6 neurons are located in a PPr region that receives neither extensive extrinsic inputs nor robust local supragranular projections. A similar paucity of inputs from the supragranular layers to layer 6 has been observed in other animals and preparations (Hooks et al., 2011; Weiler et al., 2008; Zarrinpar and Callaway, 2006). Perhaps as a consequence, layer 6 exhibits comparatively few multisensory neurons. It remains to be determined whether local projections from layer 5 neurons innervate their subjacent counterparts in layer 6, although there is evidence for this projection in primary sensory cortices (for review, see (Thomson and Lamy, 2007)). Ultimately, these collective results affirm the expectation that cortical multisensory neurons are the product of convergence of extrinsic inputs as well as local projections (Lim et al., 2011).
Laminar organization of output connections
It is well established that the individual cortical laminae differentially project to specific cortical and subcortical targets. Numerous studies (for review, see (Douglas and Martin, 2004; Thomson and Lamy, 2007)) have established that outputs from layers 2–3 project to ipsilateral and contralateral (callosal) cortical locations, and some layer 5 neurons have ipsilateral cortical connections as well. Studies have also shown that layer 5 neurons project to non-specific thalamic nuclei (Sherman and Guillery, 2011; Thomson and Lamy, 2007; Van Horn and Sherman, 2004), caudate (Fisher et al., 1984; Hedreen and DeLong, 1991; Jones et al., 1977; McGeorge and Faull, 1989; Rosell and Gimenez-Amaya, 1999; Saint-Cyr et al., 1990), superior colliculus (Fuentes-Santamaria et al., 2009; Manger et al., 2010; Meredith and Clemo, 1989; Stein et al., 1983) and pons (Albus and Donate-Oliver, 1977; Perez-Samartin et al., 1995), while layer 6 neurons project to claustrum (Zhang and Deschenes, 1997; 1998), thalamus (Sherman and Guillery, 2011; Thomson and Lamy, 2007; Van Horn and Sherman, 2004) and the reticular nucleus of the thalamus (Zhang and Deschenes, 1998). All the listed regions were anterogradely labeled by PPr injections in the present study and it is presumed that the laminar-based origins of these projections are similar to those described (above) for other sensory cortical regions.
Because there is a differential laminar distribution of multisensory properties in the PPr laminae, it is also expected that the different output projections will carry different multisensory properties. Specifically, since layers 2–3 and 5 of the PPr were dominated by multisensory neurons, it would be expected that many of these neurons would project multisensory information to their cortical, caudate, thalamic, superior colliculus, and pontine targets. Consistent with this notion, the caudate (Markus et al., 2008; Nagy et al., 2006), the lateral posterior and pulvinar thalamic nuclei (Avanzini et al., 1980), the superior colliculus (Meredith and Stein, 1986) and the pons (Amassian and Devito, 1954; Leergaard et al., 2000) are known to exhibit multisensory properties. On the other hand, because layer 6 neurons are predominantly unisensory, their projections are likely to carry unisensory signals to the claustrum (Remedios et al., 2010), and reticular thalamic (FitzGibbon, 2000; Jones, 2007; Zikopoulos and Barbas, 2007) targets which themselves exhibit multiple, distinct unisensory representations. Thus, the segregation of multisensory and unisensory properties in PPr apparently has a functional role in maintaining separate/parallel lines of information processing, as summarized in Figure 14. Further support for the parallel processing of multisensory and unisensory signals within the PPr circuit comes from the recent demonstration of significantly different response features between these two types of neurons (Foxworthy et al., 2012).
Laminar organization of multisensory integration
A unique feature of multisensory neurons is their potential to integrate responses to combinations of stimuli from different sensory modalities. Electrophysiological techniques have been used to observe multisensory integration in a variety of cortical association areas from a number of species (Allman et al., 2008; 2009; Allman and Meredith, 2007; Avillac et al., 2007; Barraclough et al., 2005; Brett-Green et al., 2003; Breveglieri et al., 2008; Carriere et al., 2007; Clemo et al., 2007; Dehner et al., 2004; Meredith et al., 2006; 2011; Romanski, 2007; Sugihara et al., 2006). The present results indicate that this integrative feature is not homogeneous within a given multisensory cortical area, but instead exhibits laminar-dependent properties. Multisensory neurons in layers 2–3 that integrated responses to combined stimulation more often exhibited response enhancement than response depression. In fact, no examples of response depression were observed for layer 2 neurons. It should be pointed out that the spatial and temporal parameters that can reveal response depression were not manipulated in the present study, so it cannot be expected at this time that all forms of response depression would be minimized in the supragranular layers. On the other hand, proportionally more neurons showing response depression were observed in layers 5 and 6. This suggests that inhibitory neurons (or inhibitory effects) are increasingly recruited as signals pass through the translaminar circuit, although it has also been demonstrated that GABA-A mediated crossmodal inhibition can be evoked from extrinsic cortical sources (Dehner et al., 2004; Keniston et al., 2010; Meredith et al., 2006). On the other hand, although there was a laminar trend (with increasing depth) for increases in the magnitude of multisensory integration, this was not statistically significant in this sample.
Laminar properties of multisensory versus primary sensory cortices
The proportion of multisensory neurons, as well as the share of neurons showing multisensory integration was found to differ by cortical layer in a way that matched the functional and connectional characteristics of the PPr. Coupled with a lack of input from principal thalamic nuclei and a minimal layer 4, these observations indicate that this higher-level multisensory cortex shows unique functional and organizational modifications from the well-known laminar patterns identified for primary sensory cortical areas.
For example, it is well established that the main generators of primary cortical sensory responses are thalamocortical projections derived from the principal thalamic nuclei (dosal lateral geniculate, ventrobasilar, ventral medial geniculate) that preferentially target layer 4 (and lower layer 3). Given the significance the thalamocortical inputs to primary sensory cortices, it is not surprising that layer 4 represents ~21% of the cortical thickness in these areas (see Figure 1C). In contrast, the present study demonstrated that thalamic inputs to the PPr represented only a small fraction (11%) of its total inputs and they arose from the non-specific lateral posterior, pulvinar and ventral anterior thalamic nuclei (see also(Manger et al., 2002)). Moreover, in PPR, layer 4 represents only 8.5% of its thickness. Although the precise termination of thalamocortical inputs within PPr are not yet established, these observations indicate that layer 4 would represent a very small target of a very small projection. However, it is possible that PPr layer 4 neurons could be more tightly packed into the available space than in other cortical regions. Yet, while spiny stellate neurons densely populate (and even sublaminate) layer 4 in primary sensory cortex, their presence in PPr was difficult to demonstrate. Using SMI-32 or Golgi-Cox, layer 4 in PPr was essentially devoid of labeled neurons, and NeuN staining revealed irregularly packed small, spherical neurons that, as such, could not be distinguished from inhibitory interneurons. It also remains to be determined whether the thalamic inputs are sufficient or appropriate to drive sensory responses in PPr. Although the LP-Pulv has been demonstrated to have visual-somatosensory multisensory responses (Avanzini et al., 1980), the functional impact of pulvino-cortical projections remains unknown (Cappe et al., 2011; Sherman and Guillery, 2011; Van Essen, 2005). Furthermore, the ventral anterior nucleus is a motor-related nucleus that has not been demonstrated to have connectivity or responses consistent with a visual-somatosensory/multisensory nature (Jones, 2007) and, thus, seems unlikely to deliver multisensory information to PPr. These observations collectively indicate that PPr does not parallel the primary sensory cortices in terms of thalamic reception or activation.
For multisensory cortex, the primary recipient layers for multiple sensory information appear layers 2–3 (see also Clemo et al., 2007; 2008; Dehner et al., 2004; Meredith et al., 2006; Monteiro et al., 2003), which largely receive projections from other cortical areas. It is of note that a current-source density analysis of the monkey multisensory cortex located in the superior temporal sulcal cortex (STS) described initial current sinks for separate visual, auditory and somatosensory responses to be centered on layer 4 ((and lower layer 3; (Schroeder and Foxe, 2002)). However, these same published figures also show current sinks above and below layer 4 in a pattern that is not consistent with that seen for primary sensory areas. In addition, axons labeled from visual cortex have been described to terminate within layer 4/lower 3 of the STS (Montero, 1980), yet that same study shows in 20 of 21 sections that terminal labeling of visual cortical inputs extended all the way to the pial surface and some patches of terminal label even exhibited a bi-laminar distribution. In the present investigation, correlation of axon terminal projections and current-source density analysis was attempted but was inconclusive because the electrode configuration could not resolve layer 4. These issues indicate that many of the basic organizational principles of multisensory cortex remain to be resolved. Nevertheless, the preponderance of data indicates that the well-known laminar and connectional arrangements of the primary sensory cortices are modified for at least the PPr, and perhaps for multisensory cortex in general.
These data underscore two prominent issues regarding the PPr, and perhaps higher-level multisensory cortex in general. First, layer 4 is proportionally so small that it is difficult to support the notion that it is the primary recipient of driving inputs for the region, especially since thalamic inputs to PPr (comparatively few that they are) are derived from the non-specific nuclei. Second, the overwhelming majority of inputs to the PPr are derived from cortical locations that preferentially target not layer 4, but layers 2–3. This set of observations is supported by connectional studies of other multisensory cortical areas, which also observed preferential cortico-cortical terminations within layers 2–3 (Clemo et al., 2007; 2008; 2011; Dehner et al., 2004; Meredith et al., 2006; Monteiro et al., 2003). Given these features of higher-level multisensory cortex, it is also difficult to interpret projection patterns to this region based on the classical hierarchical schemes described by Felleman and van Essen (1991). In this classification system, feedforward designations are based largely on projections that terminate in and around layer 4, which clearly does not relate to the demonstrated input connectivity patterns for PPr. Alternatively, feedback designations are based on projection patterns that innervate the supragranular and infragranular layers, while largely avoiding layer 4. Such an arrangement also does not match the pattern of inputs observed for PPr, nor is it consistent with the shorter response latencies measured in SIII and PPc. Of the connectional schemes, those designated as `lateral,' which terminate in all cortical laminae, perhaps seem to best match the observed inputs to PPr (despite the predominance of layer 2–3 terminations), but does not correspond well with its longer response latencies. Also, the PPr is the likely homologue of the primate ventral intraparietal area (VIP; Manger et al., 2002; Lewis and van Essen, 2000), and the known cortical inputs to VIP are designated as descending or lateral projections (Felleman and van Essen, 1991) while projections from V3 are depicted as feedforward (Felleman et al., 1997). Given these ambiguities, it is clear that further investigation is needed to evaluate how the input/output patterns of higher-level multisensory cortices might correlate with designations of their hierarchical position.
SUMMARY & CONCLUSIONS
The present study is the first systematic structure-function analysis of the laminar features of not just multisensory neurons, but also of multisensory processing in multisensory cortex. Largely summarized by Figure 14, the data showed that the major sources of inputs to the multisensory PPr are corticocortical that preferentially terminate not in layer 4, but in layers 2–3. This high degree of input overlap in layers 2–3 corresponded with a high proportion of neurons showing functional multisensory convergence in those same layers. Layer 5 displayed the highest share of multisensory neurons, whose apical dendrites extended into layers 2–3 (potentially to receive overlapping extrinsic inputs) while their basilar dendrites were positioned to receive projections from multisensory layers 2–3. On the other hand, layer 6 received the lowest levels of extrinsic inputs and the fewest projections from layers 2–3, and demonstrated the lowest fraction of multisensory neurons. This differential distribution, coupled with the laminar-dependency of cortical output connections, is consistent with the parallel processing of multisensory and unisensory signals within the local PPr circuit. These observations are important not only for the design of computational simulations of multisensory processing, but also for a better understanding of how the brain ultimately merges activity from multiple senses into unified perceptions.
Table 1.
Sources and Dilutions of Antibodies
| Host | Antigen | Manufacturer | Catalog No. | Reference | Dilution |
|---|---|---|---|---|---|
| Mouse | Rat hypothalamus nonphosphorylated neurofilaments | Covance, Princeton, NJ | SMI-32R | Sternberger and Sternberger, 1983 | 1/1500 |
| Mouse | Purified nuclei from mouse brain cells | Millipore, Billerica, MA | MAB377 | Mullen et al., 1992;Luuk et al., 2008 | 1/500 |
OTHER ACKNOWLEDGEMENTS
The authors wish to thank Drs. BL Allman and LP Keniston for their assistance with the initial experiments. Supported by NIH Grant NS064675.
Supported by NIH Grant NS064675.
Footnotes
CONFLICT OF INTEREST STATEMENT: The authors report no conflicts of interest. The authors alone are responsible for the content and writing of the paper.
ROLE OF AUTHORS: All authors had full access to all the data in the study and take responsibility for the integrity of the data and the accuracy of the data analysis. Study concept and design: M. Alex Meredith, W. Alex Foxworthy. Acquisition of data: W. Alex Foxworthy, H. Ruth Clemo, M. Alex Meredith. Analysis and interpretation of the data: W. Alex Foxworthy, H. Ruth Clemo, M. Alex Meredith. Drafting of the manuscript: W. Alex Foxworthy and M. Alex Meredith. Critical revision of the manuscript for important intellectual content: H. Ruth Clemo and M. Alex Meredith. Statistical analysis: W. Alex Foxworthy. Obtained funding: M. Alex Meredith. Study supervision: M. Alex Meredith.
LITERATURE CITED
- Alais D, Newell FN, Mamassian P. Multisensory processing in review: from physiology to behaviour. Seeing Perceiving. 2010;23(1):3–38. doi: 10.1163/187847510X488603. [DOI] [PubMed] [Google Scholar]
- Albus K, Donate-Oliver F. Cells of origin of the occipito-pontine projection in the cat: functional properties and intracortical location. Exp Brain Res. 1977;28(1–2):167–174. doi: 10.1007/BF00237094. [DOI] [PubMed] [Google Scholar]
- Allman BL, Bittencourt-Navarrete RE, Keniston LP, Medina AE, Wang MY, Meredith MA. Do cross-modal projections always result in multisensory integration? Cereb Cortex. 2008;18(9):2066–2076. doi: 10.1093/cercor/bhm230. [DOI] [PMC free article] [PubMed] [Google Scholar]
- Allman BL, Keniston LP, Meredith MA. Not just for bimodal neurons anymore: the contribution of unimodal neurons to cortical multisensory processing. Brain Topogr. 2009;21(3–4):157–167. doi: 10.1007/s10548-009-0088-3. [DOI] [PMC free article] [PubMed] [Google Scholar]
- Allman BL, Meredith MA. Multisensory processing in “unimodal” neurons: cross-modal subthreshold auditory effects in cat extrastriate visual cortex. J Neurophysiol. 2007;98(1):545–549. doi: 10.1152/jn.00173.2007. [DOI] [PubMed] [Google Scholar]
- Amassian VE, Devito RV. Unit activity in reticular formation and nearby structures. J Neurophysiol. 1954;17(6):575–603. doi: 10.1152/jn.1954.17.6.575. [DOI] [PubMed] [Google Scholar]
- Avanzini G, Broggi G, Franceschetti S, Spreafico R. Multisensory convergence and interaction in the pulvinar-lateralis posterior complex of the cat's thalamus. Neurosci Lett. 1980;19(1):27–32. doi: 10.1016/0304-3940(80)90250-5. [DOI] [PubMed] [Google Scholar]
- Avillac M, Ben Hamed S, Duhamel JR. Multisensory integration in the ventral intraparietal area of the macaque monkey. J Neurosci. 2007;27(8):1922–1932. doi: 10.1523/JNEUROSCI.2646-06.2007. [DOI] [PMC free article] [PubMed] [Google Scholar]
- Bajo VM, Nodal FR, Bizley JK, Moore DR, King AJ. The ferret auditory cortex: descending projections to the inferior colliculus. Cereb Cortex. 2007;17(2):475–491. doi: 10.1093/cercor/bhj164. [DOI] [PMC free article] [PubMed] [Google Scholar]
- Bajo VM, Nodal FR, Bizley JK, King AJ. The non-lemniscal auditory cortex in ferrets: convergence of corticotectal inputs in the superior colliculus. Front Neuroanat. 2010;4:18. doi: 10.3389/fnana.2010.00018. [DOI] [PMC free article] [PubMed] [Google Scholar]
- Barraclough NE, Xiao D, Baker CI, Oram MW, Perrett DI. Integration of visual and auditory information by superior temporal sulcus neurons responsive to the sight of actions. J Cogn Neurosci. 2005;17(3):377–391. doi: 10.1162/0898929053279586. [DOI] [PubMed] [Google Scholar]
- Bell AH, Meredith MA, Van Opstal AJ, Munoz DP. Crossmodal integration in the primate superior colliculus underlying the preparation and initiation of saccadic eye movements. J Neurophysiol. 2005;93(6):3659–3673. doi: 10.1152/jn.01214.2004. [DOI] [PubMed] [Google Scholar]
- Benevento LA, Fallon J, Davis BJ, Rezak M. Auditory--visual interaction in single cells in the cortex of the superior temporal sulcus and the orbital frontal cortex of the macaque monkey. Exp Neurol. 1977;57(3):849–872. doi: 10.1016/0014-4886(77)90112-1. [DOI] [PubMed] [Google Scholar]
- Blanke O. Multisensory brain mechanisms of bodily self-consciousness. Nat Rev Neurosci. 2012;13:556–71. doi: 10.1038/nrn3292. [DOI] [PubMed] [Google Scholar]
- Bremmer F, Klam F, Duhamel JR, Ben Hamed S, Graf W. Visual-vestibular interactive responses in the macaque ventral intraparietal area (VIP) Eur J Neurosci. 2002;16:1569–86. doi: 10.1046/j.1460-9568.2002.02206.x. [DOI] [PubMed] [Google Scholar]
- Brett-Green B, Fifkova E, Larue DT, Winer JA, Barth DS. A multisensory zone in rat parietotemporal cortex: intra- and extracellular physiology and thalamocortical connections. J Comp Neurol. 2003;460(2):223–237. doi: 10.1002/cne.10637. [DOI] [PubMed] [Google Scholar]
- Breveglieri R, Galletti C, Monaco S, Fattori P. Visual, somatosensory, and bimodal activities in the macaque parietal area PEc. Cereb Cortex. 2008;18(4):806–816. doi: 10.1093/cercor/bhm127. [DOI] [PubMed] [Google Scholar]
- Briggs F, Callaway EM. Laminar patterns of local excitatory input to layer 5 neurons in macaque primary visual cortex. Cereb Cortex. 2005;15(5):479–88. doi: 10.1093/cercor/bhh154. [DOI] [PMC free article] [PubMed] [Google Scholar]
- Bruce C, Desimone R, Gross CG. Visual properties of neurons in a polysensory area in superior temporal sulcus of the macaque. J Neurophysiol. 1981;46(2):369–384. doi: 10.1152/jn.1981.46.2.369. [DOI] [PubMed] [Google Scholar]
- Bucci DJ. Posterior parietal cortex: an interface between attention and learning? Neurobiol Learn Mem. 2009;91(2):114–120. doi: 10.1016/j.nlm.2008.07.004. [DOI] [PMC free article] [PubMed] [Google Scholar]
- Calton JL, Taube JS. Where am I and how will I get there from here? A role for posterior parietal cortex in the integration of spatial information and route planning. Neurobiol Learn Mem. 2009;91(2):186–196. doi: 10.1016/j.nlm.2008.09.015. [DOI] [PMC free article] [PubMed] [Google Scholar]
- Campbell MJ, Morrison JH. Monoclonal antibody to neurofilament protein (SMI-32) labels a subpopulation of pyramidal neurons in the human and monkey neocortex. J Comp Neurol. 1989;282(2):191–205. doi: 10.1002/cne.902820204. [DOI] [PubMed] [Google Scholar]
- Cappe C, Rouiller EM, Barone P. Cortical and Thalamic Pathways for Multisensory and Sensorimotor Interplay. In: Murray MM, Wallace MT, editors. The Neural Bases of Multisensory Processes. CRC Press; Boca Raton, Fl.: 2011. pp. 15–30. [PubMed] [Google Scholar]
- Carmichael ST, Price JL. Architectonic subdivision of the orbital and medial prefrontal cortex in the macaque monkey. J Comp Neurol. 1994;346(3):366–402. doi: 10.1002/cne.903460305. [DOI] [PubMed] [Google Scholar]
- Carriere BN, Royal DW, Perrault TJ, Morrison SP, Vaughan JW, Stein BE, Wallace MT. Visual deprivation alters the development of cortical multisensory integration. J Neurophysiol. 2007;98(5):2858–2867. doi: 10.1152/jn.00587.2007. [DOI] [PubMed] [Google Scholar]
- Clemo HR, Allman BL, Donlan MA, Meredith MA. Sensory and multisensory representations within the cat rostral suprasylvian cortex. J Comp Neurol. 2007;503(1):110–127. doi: 10.1002/cne.21378. [DOI] [PubMed] [Google Scholar]
- Clemo HR, Keniston LP, Meredith MA. Structural Basis of Multisensory Processing: Convergence. In: Murray MM, Wallace MT, editors. The Neural Bases of Multisensory Processes. CRC Press; Boca Raton, Fl: 2011. pp. 3–14. [PubMed] [Google Scholar]
- Clemo HR, Meredith MA. Dendritic spine density in multisensory versus primary sensory cortex. Synapse. 2012;66(8):714–24. doi: 10.1002/syn.21560. [DOI] [PubMed] [Google Scholar]
- Clemo HR, Sharma GK, Allman BL, Meredith MA. Auditory projections to extrastriate visual cortex: connectional basis for multisensory processing in `unimodal' visual neurons. Exp Brain Res. 2008;191(1):37–47. doi: 10.1007/s00221-008-1493-7. [DOI] [PMC free article] [PubMed] [Google Scholar]
- Cohen YE. Multimodal activity in the parietal cortex. Hear Res. 2009;258:100–5. doi: 10.1016/j.heares.2009.01.011. [DOI] [PMC free article] [PubMed] [Google Scholar]
- Dahl CD, Logothetis NK, Kayser C. Spatial organization of multisensory responses in temporal association cortex. J Neurosci. 2009;29(38):11924–11932. doi: 10.1523/JNEUROSCI.3437-09.2009. [DOI] [PMC free article] [PubMed] [Google Scholar]
- Dehner LR, Keniston LP, Clemo HR, Meredith MA. Cross-modal circuitry between auditory and somatosensory areas of the cat anterior ectosylvian sulcal cortex: a `new' inhibitory form of multisensory convergence. Cereb Cortex. 2004;14(4):387–403. doi: 10.1093/cercor/bhg135. [DOI] [PubMed] [Google Scholar]
- Del Rio MR, DeFelipe J. A study of SMI 32-stained pyramidal cells, parvalbumin-immunoreactive chandelier cells, and presumptive thalamocortical axons in the human temporal neocortex. J Comp Neurol. 1994;342(3):389–408. doi: 10.1002/cne.903420307. [DOI] [PubMed] [Google Scholar]
- Douglas RJ, Martin KA. Neuronal circuits of the neocortex. Annu Rev Neurosci. 2004;27:419–451. doi: 10.1146/annurev.neuro.27.070203.144152. [DOI] [PubMed] [Google Scholar]
- Duhamel JR, Colby CL, Goldberg ME. Ventral intraparietal area of the macaque: congruent visual and somatic response properties. J Neurophysiol. 1998;79(1):126–136. doi: 10.1152/jn.1998.79.1.126. [DOI] [PubMed] [Google Scholar]
- Felleman DJ, Burkhalter A, Van Essen DC. Cortical connections of areas V3 and Vp of macaque monkey extrastriate visual cortex. J Comp Neuro. 1997;379:21–47. doi: 10.1002/(sici)1096-9861(19970303)379:1<21::aid-cne3>3.0.co;2-k. [DOI] [PubMed] [Google Scholar]
- Felleman DJ, Van Essen DC. Distributed hierarchical processing in the primate cerebral cortex. Cereb Cortex. 1991;1(1):1–47. doi: 10.1093/cercor/1.1.1-a. [DOI] [PubMed] [Google Scholar]
- Fisher RS, Shiota C, Levine MS, Hull CD, Buchwald NA. Interhemispheric organization of corticocaudate projections in the cat: a retrograde double-labelling study. Neurosci Lett. 1984;48(3):369–373. doi: 10.1016/0304-3940(84)90066-1. [DOI] [PubMed] [Google Scholar]
- FitzGibbon T. Cortical projections from the suprasylvian gyrus to the reticular thalamic nucleus in the cat. Neuroscience. 2000;97(4):643–655. doi: 10.1016/s0306-4522(00)00048-8. [DOI] [PubMed] [Google Scholar]
- Fogassi L, Gallese V, Fadiga L, Luppino G, Matelli M, Rizzolatti G. Coding of peripersonal space in inferior premotor cortex (area F4) J Neurophysiol. 1996;76(1):141–157. doi: 10.1152/jn.1996.76.1.141. [DOI] [PubMed] [Google Scholar]
- Foxworthy WA, Allman BA, Keniston LP, Meredith MA. Multisensory and unisensory neurons in ferret parietal cortex exhibit distinct functional properties. Eur J Neurosci. 2012 doi: 10.1111/ejn.12085. doi:10.1111/ejn.12085. [DOI] [PMC free article] [PubMed] [Google Scholar]
- Foxworthy WA, Meredith MA. An examination of somatosensory area SIII in ferret cortex. Somatosens Mot Res. 2011;28(1–2):1–10. doi: 10.3109/08990220.2010.548465. [DOI] [PMC free article] [PubMed] [Google Scholar]
- Fuentes-Santamaria V, Alvarado JC, McHaffie JG, Stein BE. Axon morphologies and convergence patterns of projections from different sensory-specific cortices of the anterior ectosylvian sulcus onto multisensory neurons in the cat superior colliculus. Cereb Cortex. 2009;19(12):2902–2915. doi: 10.1093/cercor/bhp060. [DOI] [PMC free article] [PubMed] [Google Scholar]
- Goldstein ME, Sternberger LA, Sternberger NH. Varying degrees of phosphorylation determine microheterogeneity of the heavy neurofilament polypeptide (Nf-H) J Neuroimmunol. 1987;14(2):135–148. doi: 10.1016/0165-5728(87)90048-8. [DOI] [PubMed] [Google Scholar]
- Graziano MS, Reiss LA, Gross CG. A neuronal representation of the location of nearby sounds. Nature. 1999;397(6718):428–430. doi: 10.1038/17115. [DOI] [PubMed] [Google Scholar]
- Hedreen JC, DeLong MR. Organization of striatopallidal, striatonigral, and nigrostriatal projections in the macaque. J Comp Neurol. 1991;304(4):569–595. doi: 10.1002/cne.903040406. [DOI] [PubMed] [Google Scholar]
- Hikosaka K, Iwai E, Saito H, Tanaka K. Polysensory properties of neurons in the anterior bank of the caudal superior temporal sulcus of the macaque monkey. J Neurophysiol. 1988;60(5):1615–1637. doi: 10.1152/jn.1988.60.5.1615. [DOI] [PubMed] [Google Scholar]
- Hof PR, Bogaert TE, Rosenthal RE, Fiskum G. Distribution of neuronal populations containing neurofilament protein and calcium-binding proteins in the canine neocortex: regional analysis and cell typology. J Chem Neuroanat. 1996;11(2):81–89. doi: 10.1016/0891-0618(96)00126-3. [DOI] [PubMed] [Google Scholar]
- Homman-Ludiye J, Manger PR, Bourne JA. Immunohistochemical parcellation of the ferret (Mustela putorius) visual cortex reveals substantial homology with the cat (Felis catus) J Comp Neurol. 2010;518(21):4439–4462. doi: 10.1002/cne.22465. [DOI] [PubMed] [Google Scholar]
- Hooks BM, Hires SA, Zhang YX, Huber D, Petreanu L, Svoboda K, Shepherd GM. Laminar analysis of excitatory local circuits in vibrissal motor and sensory cortical areas. PLoS Biol. 2011;9(1):e1000572. doi: 10.1371/journal.pbio.1000572. [DOI] [PMC free article] [PubMed] [Google Scholar]
- Innocenti GM, Manger PR, Masiello I, Colin I, Tettoni L. Architecture and callosal connections of visual areas 17, 18, 19 and 21 in the ferret (Mustela putorius) Cereb Cortex. 2002;12(4):411–422. doi: 10.1093/cercor/12.4.411. [DOI] [PubMed] [Google Scholar]
- Jiang H, Lepore F, Ptito M, Guillemot JP. Sensory interactions in the anterior ectosylvian cortex of cats. Exp Brain Res. 1994;101(3):385–396. doi: 10.1007/BF00227332. [DOI] [PubMed] [Google Scholar]
- Jones EG. The Thalamus. Cambridge University Press; Cambridge: 2007. The Ventral Nuclei; pp. 705–874. [Google Scholar]
- Jones EG, Coulter JD, Burton H, Porter R. Cells of origin and terminal distribution of corticostriatal fibers arising in the sensory-motor cortex of monkeys. J Comp Neurol. 1977;173(1):53–80. doi: 10.1002/cne.901730105. [DOI] [PubMed] [Google Scholar]
- Kaas J. The Evolution of Sensory and Motor Systems in Primates. In: Kaas J, editor. Evolutionary Neuroscience. Academic Press; 2009. pp. 847–865. [Google Scholar]
- Kaas JH, Gharbawie OA, Stepniewska I. The organization and evolution of dorsal stream multisensory motor pathways in primates. Front Neuroanat. 2011;5:34. doi: 10.3389/fnana.2011.00034. [DOI] [PMC free article] [PubMed] [Google Scholar]
- Kaneko T, Caria MA, Asanuma H. Information processing within the motor cortex. II. Intracortical connections between neurons receiving somatosensory cortical input and motor output neurons of the cortex. J Comp Neurol. 1994;345(2):172–184. doi: 10.1002/cne.903450203. [DOI] [PubMed] [Google Scholar]
- Keniston LP, Allman BL, Meredith MA, Clemo HR. Somatosensory and multisensory properties of the medial bank of the ferret rostral suprasylvian sulcus. Exp Brain Res. 2009;196(2):239–251. doi: 10.1007/s00221-009-1843-0. [DOI] [PMC free article] [PubMed] [Google Scholar]
- Keniston LP, Henderson SC, Meredith MA. Neuroanatomical identification of crossmodal auditory inputs to interneurons in somatosensory cortex. Exp Brain Res. 2010;202(3):725–731. doi: 10.1007/s00221-010-2163-0. [DOI] [PMC free article] [PubMed] [Google Scholar]
- Leclerc SS, Rice FL, Dykes RW, Pourmoghadam K, Gomez CM. Electrophysiological examination of the representation of the face in the suprasylvian gyrus of the ferret: a correlative study with cytoarchitecture. Somatosens Mot Res. 1993;10(2):133–159. doi: 10.3109/08990229309028829. [DOI] [PubMed] [Google Scholar]
- Leergaard TB, Lyngstad KA, Thompson JH, Taeymans S, Vos BP, De Schutter E, Bower JM, Bjaalie JG. Rat somatosensory cerebropontocerebellar pathways: spatial relationships of the somatotopic map of the primary somatosensory cortex are preserved in a three-dimensional clustered pontine map. J Comp Neurol. 2000;422(2):246–266. doi: 10.1002/(sici)1096-9861(20000626)422:2<246::aid-cne7>3.0.co;2-r. [DOI] [PubMed] [Google Scholar]
- Lewis JW, Van Essen DC. Corticocortical connections of visual, sensorimotor, and multimodal processing areas in the parietal lobe of the macaque monkey. J Comp Neurol. 2000;428(1):112–137. doi: 10.1002/1096-9861(20001204)428:1<112::aid-cne8>3.0.co;2-9. [DOI] [PubMed] [Google Scholar]
- Lim HK, Keniston LP, Shin JH, Allman BL, Meredith MA, Cios KJ. Connectional parameters determine multisensory processing in a spiking network model of multisensory convergence. Exp Brain Res. 2011;213(2–3):329–339. doi: 10.1007/s00221-011-2671-6. [DOI] [PubMed] [Google Scholar]
- Luuk H, Koks S, Plaas M, Hannibal J, Rehfeld JF, Vasar E. Distribution of Wfs1 protein in the central nervous system of the mouse and its relation to clinical symptoms of the Wolfram syndrome. J Comp Neurol. 2008;509(6):642–660. doi: 10.1002/cne.21777. [DOI] [PubMed] [Google Scholar]
- Manger PR, Engler G, Moll CK, Engel AK. Location, architecture, and retinotopy of the anteromedial lateral suprasylvian visual area (AMLS) of the ferret (Mustela putorius) Vis Neurosci. 2008;25(1):27–37. doi: 10.1017/S0952523808080036. [DOI] [PubMed] [Google Scholar]
- Manger PR, Masiello I, Innocenti GM. Areal organization of the posterior parietal cortex of the ferret (Mustela putorius) Cereb Cortex. 2002;12(12):1280–1297. doi: 10.1093/cercor/12.12.1280. [DOI] [PubMed] [Google Scholar]
- Manger PR, Nakamura H, Valentiniene S, Innocenti GM. Visual areas in the lateral temporal cortex of the ferret (Mustela putorius) Cereb Cortex. 2004;14(6):676–689. doi: 10.1093/cercor/bhh028. [DOI] [PubMed] [Google Scholar]
- Manger PR, Restrepo CE, Innocenti GM. The superior colliculus of the ferret: cortical afferents and efferent connections to dorsal thalamus. Brain Res. 2010;1353:74–85. doi: 10.1016/j.brainres.2010.07.085. [DOI] [PubMed] [Google Scholar]
- Markus Z, Eordegh G, Paroczy Z, Benedek G, Nagy A. Modality distribution of sensory neurons in the feline caudate nucleus and the substantia nigra. Acta Biol Hung. 2008;59(3):269–279. doi: 10.1556/ABiol.59.2008.3.1. [DOI] [PubMed] [Google Scholar]
- Matsuzaki R, Kyuhou S, Matsuura-Nakao K, Gemba H. Thalamo-cortical projections to the posterior parietal cortex in the monkey. Neurosci Lett. 2004;355(1–2):113–116. doi: 10.1016/j.neulet.2003.10.066. [DOI] [PubMed] [Google Scholar]
- McGeorge AJ, Faull RL. The organization of the projection from the cerebral cortex to the striatum in the rat. Neuroscience. 1989;29(3):503–537. doi: 10.1016/0306-4522(89)90128-0. [DOI] [PubMed] [Google Scholar]
- McLaughlin DF, Sonty RV, Juliano SL. Organization of the forepaw representation in ferret somatosensory cortex. Somatosens Mot Res. 1998;15(4):253–268. doi: 10.1080/08990229870673. [DOI] [PubMed] [Google Scholar]
- Menzel RR, Barth DS. Multisensory and secondary somatosensory cortex in the rat. Cereb Cortex. 2005;15(11):1690–6. doi: 10.1093/cercor/bhi045. [DOI] [PubMed] [Google Scholar]
- Meredith MA, Allman BL, Keniston LP, Clemo HR. Are Bimodal Neurons the Same throughout the Brain? In: Murray MM, Wallace MT, editors. The Neural Bases of Multisensory Processes. CRC Press; Boca Raton, FL: 2011. pp. 51–64. [Google Scholar]
- Meredith MA, Cios KJ, McQuiston AR, Lim HK, Keniston LP, Clemo HR. Neuroanatomical identification of multisensory convergence on higher-level cortical neurons. In: Stein BE, editor. The New Handbook of Multisensory Processing. MIT Press; Cambridge MA: 2012. pp. 81–94. [Google Scholar]
- Meredith MA, Clemo HR. Auditory cortical projection from the anterior ectosylvian sulcus (Field AES) to the superior colliculus in the cat: an anatomical and electrophysiological study. J Comp Neurol. 1989;289(4):687–707. doi: 10.1002/cne.902890412. [DOI] [PubMed] [Google Scholar]
- Meredith MA, Keniston LR, Dehner LR, Clemo HR. Crossmodal projections from somatosensory area SIV to the auditory field of the anterior ectosylvian sulcus (FAES) in Cat: further evidence for subthreshold forms of multisensory processing. Exp Brain Res. 2006;172(4):472–484. doi: 10.1007/s00221-006-0356-3. [DOI] [PubMed] [Google Scholar]
- Meredith MA, Stein BE. Visual, auditory, and somatosensory convergence on cells in superior colliculus results in multisensory integration. J Neurophysiol. 1986;56(3):640–662. doi: 10.1152/jn.1986.56.3.640. [DOI] [PubMed] [Google Scholar]
- Monteiro GA, Clemo HR, Meredith MA. Anterior ectosylvian cortical projections to the rostral suprasylvian multisensory zone in cat. Neuroreport. 2003;14(17):2139–2145. doi: 10.1097/00001756-200312020-00002. [DOI] [PubMed] [Google Scholar]
- Montero VM. Patterns of connections from the striate cortex to cortical visual areas in superior temporal sulcus of macaque and middle temporal gyrus of owl monkey. J Comp Neurol. 1980;189(1):45–59. doi: 10.1002/cne.901890104. [DOI] [PubMed] [Google Scholar]
- Mullen RJ, Buck CR, Smith AM. NeuN, a neuronal specific nuclear protein in vertebrates. Development. 1992;116(1):201–211. doi: 10.1242/dev.116.1.201. [DOI] [PubMed] [Google Scholar]
- Nagy A, Eordegh G, Paroczy Z, Markus Z, Benedek G. Multisensory integration in the basal ganglia. Eur J Neurosci. 2006;24(3):917–924. doi: 10.1111/j.1460-9568.2006.04942.x. [DOI] [PubMed] [Google Scholar]
- Nitz D. Parietal cortex, navigation, and the construction of arbitrary reference frames for spatial information. Neurobiol Learn Mem. 2009;91(2):179–185. doi: 10.1016/j.nlm.2008.08.007. [DOI] [PubMed] [Google Scholar]
- Perez-Samartin AL, Martinez-Millan L, Donate-Oliver F. Morphology of visual cortical neurons projecting to the pons. A study with intracellular injection of lucifer yellow in the cat. Arch Ital Biol. 1995;133(1):17–30. [PubMed] [Google Scholar]
- Reep RL, Corwin JV. Posterior parietal cortex as part of a neural network for directed attention in rats. Neurobiol Learn Mem. 2009;91(2):104–113. doi: 10.1016/j.nlm.2008.08.010. [DOI] [PubMed] [Google Scholar]
- Remedios R, Logothetis NK, Kayser C. Unimodal responses prevail within the multisensory claustrum. J Neurosci. 2010;30(39):12902–12907. doi: 10.1523/JNEUROSCI.2937-10.2010. [DOI] [PMC free article] [PubMed] [Google Scholar]
- Rice FL, Gomez CM, Leclerc SS, Dykes RW, Moon JS, Pourmoghadam K. Cytoarchitecture of the ferret suprasylvian gyrus correlated with areas containing multiunit responses elicited by stimulation of the face. Somatosens Mot Res. 1993;10(2):161–188. doi: 10.3109/08990229309028830. [DOI] [PubMed] [Google Scholar]
- Rockland KS, Andresen J, Cowie RJ, Robinson DL. Single axon analysis of pulvinocortical connections to several visual areas in the macaque. J Comp Neurol. 1999;406(2):221–250. doi: 10.1002/(sici)1096-9861(19990405)406:2<221::aid-cne7>3.0.co;2-k. [DOI] [PubMed] [Google Scholar]
- Roda JM, Reinoso-Suarez F. Topographical organization of the thalamic projections to the cortex of the anterior ectosylvian sulcus in the cat. Exp Brain Res. 1983;49(1):131–139. doi: 10.1007/BF00235548. [DOI] [PubMed] [Google Scholar]
- Romanski LM. Representation and integration of auditory and visual stimuli in the primate ventral lateral prefrontal cortex. Cereb Cortex. 2007;17(Suppl 1):i61–69. doi: 10.1093/cercor/bhm099. [DOI] [PMC free article] [PubMed] [Google Scholar]
- Romanski LM, Giguere M, Bates JF, Goldman-Rakic PS. Topographic organization of medial pulvinar connections with the prefrontal cortex in the rhesus monkey. J Comp Neurol. 1997;379(3):313–332. [PubMed] [Google Scholar]
- Rosell A, Gimenez-Amaya JM. Anatomical re-evaluation of the corticostriatal projections to the caudate nucleus: a retrograde labeling study in the cat. Neurosci Res. 1999;34(4):257–269. doi: 10.1016/s0168-0102(99)00060-7. [DOI] [PubMed] [Google Scholar]
- Russ BE, Kim AM, Abrahamsen KL, Kiringoda R, Cohen YE. Responses of neurons in the lateral intraparietal area to central visual cues. Exp Brain Res. 2006;174(4):712–727. doi: 10.1007/s00221-006-0514-7. [DOI] [PubMed] [Google Scholar]
- Saint-Cyr JA, Ungerleider LG, Desimone R. Organization of visual cortical inputs to the striatum and subsequent outputs to the pallido-nigral complex in the monkey. J Comp Neurol. 1990;298(2):129–156. doi: 10.1002/cne.902980202. [DOI] [PubMed] [Google Scholar]
- Schlack A, Sterbing-D'Angelo SJ, Hartung K, Hoffmann KP, Bremmer F. Multisensory space representations in the macaque ventral intraparietal area. J Neurosci. 2005;25(18):4616–4625. doi: 10.1523/JNEUROSCI.0455-05.2005. [DOI] [PMC free article] [PubMed] [Google Scholar]
- Schroeder CE, Foxe JJ. The timing and laminar profile of converging inputs to multisensory areas of the macaque neocortex. Brain Res Cogn Brain Res. 2002;14(1):187–198. doi: 10.1016/s0926-6410(02)00073-3. [DOI] [PubMed] [Google Scholar]
- Sherman SM, Guillery RW. Distinct functions for direct and transthalamic corticocortical connections. J Neurophysiol. 2011;106(3):1068–1077. doi: 10.1152/jn.00429.2011. [DOI] [PubMed] [Google Scholar]
- Stein BE, Meredith MA. The merging of the senses. MIT Press; Cambridge, Mass: 1993. p. xv.p. 211. [Google Scholar]
- Stein BE, Spencer RF, Edwards SB. Corticotectal and corticothalamic efferent projections of SIV somatosensory cortex in cat. J Neurophysiol. 1983;50(4):896–909. doi: 10.1152/jn.1983.50.4.896. [DOI] [PubMed] [Google Scholar]
- Sternberger LA. Immunocytochemistry. Wiley; New York: 1986. p. xiii.p. 524. [Google Scholar]
- Sternberger LA, Sternberger NH. Monoclonal antibodies distinguish phosphorylated and nonphosphorylated forms of neurofilaments in situ. Proc Natl Acad Sci U S A. 1983;80(19):6126–6130. doi: 10.1073/pnas.80.19.6126. [DOI] [PMC free article] [PubMed] [Google Scholar]
- Stuart G, Spruston N, Hausser M. Dendrites. Oxford University Press; USA: 2007. [Google Scholar]
- Sugihara T, Diltz MD, Averbeck BB, Romanski LM. Integration of auditory and visual communication information in the primate ventrolateral prefrontal cortex. J Neurosci. 2006;26(43):11138–11147. doi: 10.1523/JNEUROSCI.3550-06.2006. [DOI] [PMC free article] [PubMed] [Google Scholar]
- Takahashi T. The organization of the lateral thalamus of the hooded rat. J Comp Neurol. 1985;231(3):281–309. doi: 10.1002/cne.902310302. [DOI] [PubMed] [Google Scholar]
- Thomson AM, Lamy C. Functional maps of neocortical local circuitry. Front Neurosci. 2007;1(1):19–42. doi: 10.3389/neuro.01.1.1.002.2007. [DOI] [PMC free article] [PubMed] [Google Scholar]
- van der Gucht E, Vandesande F, Arckens L. Neurofilament protein: a selective marker for the architectonic parcellation of the visual cortex in adult cat brain. J Comp Neurol. 2001;441(4):345–368. doi: 10.1002/cne.1416. [DOI] [PubMed] [Google Scholar]
- Van Essen DC. Corticocortical and thalamocortical information flow in the primate visual system. Prog Brain Res. 2005;149:173–185. doi: 10.1016/S0079-6123(05)49013-5. [DOI] [PubMed] [Google Scholar]
- Van Horn SC, Sherman SM. Differences in projection patterns between large and small corticothalamic terminals. J Comp Neurol. 2004;475(3):406–415. doi: 10.1002/cne.20187. [DOI] [PubMed] [Google Scholar]
- Wallace MT, Meredith MA, Stein BE. Integration of multiple sensory modalities in cat cortex. Exp Brain Res. 1992;91(3):484–488. doi: 10.1007/BF00227844. [DOI] [PubMed] [Google Scholar]
- Wallace MT, Ramachandran R, Stein BE. A revised view of sensory cortical parcellation. Proc Natl Acad Sci U S A. 2004;101(7):2167–2172. doi: 10.1073/pnas.0305697101. [DOI] [PMC free article] [PubMed] [Google Scholar]
- Weiler N, Wood L, Yu J, Solla SA, Shepherd GM. Top-down laminar organization of the excitatory network in motor cortex. Nat Neurosci. 2008;11(3):360–6. doi: 10.1038/nn2049. [DOI] [PMC free article] [PubMed] [Google Scholar]
- Yaka R, Notkin N, Yinon U, Wollberg Z. Visual, auditory and bimodal activity in the banks of the lateral suprasylvian sulcus in the cat. Neurosci Behav Physiol. 2002;32(1):103–8. doi: 10.1023/a:1012912828595. [DOI] [PubMed] [Google Scholar]
- Yamamoto T, Samejima A, Oka H. Morphological features of layer V pyramidal neurons in the cat parietal cortex: an intracellular HRP study. J Comp Neurol. 1987;265(3):380–90. doi: 10.1002/cne.902650307. [DOI] [PubMed] [Google Scholar]
- Yeterian EH, Pandya DN. Thalamic connections of the cortex of the superior temporal sulcus in the rhesus monkey. J Comp Neurol. 1989;282(1):80–97. doi: 10.1002/cne.902820107. [DOI] [PubMed] [Google Scholar]
- Zarrinpar A, Callaway EM. Local connections to specific types of layer 6 neurons in the rat visual cortex. J Neurophysiol. 2006;95(3):1751–61. doi: 10.1152/jn.00974.2005. [DOI] [PubMed] [Google Scholar]
- Zeki S, Shipp S. The functional logic of cortical connections. Nature. 1988;335(6188):311–317. doi: 10.1038/335311a0. [DOI] [PubMed] [Google Scholar]
- Zhang ZW, Deschenes M. Intracortical axonal projections of lamina VI cells of the primary somatosensory cortex in the rat: a single-cell labeling study. J Neurosci. 1997;17(16):6365–6379. doi: 10.1523/JNEUROSCI.17-16-06365.1997. [DOI] [PMC free article] [PubMed] [Google Scholar]
- Zhang ZW, Deschenes M. Projections to layer VI of the posteromedial barrel field in the rat: a reappraisal of the role of corticothalamic pathways. Cereb Cortex. 1998;8(5):428–436. doi: 10.1093/cercor/8.5.428. [DOI] [PubMed] [Google Scholar]
- Zikopoulos B, Barbas H. Circuits for multisensory integration and attentional modulation through the prefrontal cortex and the thalamic reticular nucleus in primates. Rev Neurosci. 2007;18(6):417–438. doi: 10.1515/revneuro.2007.18.6.417. [DOI] [PMC free article] [PubMed] [Google Scholar]