

Abstract
Objective
The pathophysiology of the most common joint disease, osteoarthritis (OA), remains poorly understood. Since synovial fluid (SF) bathes joint cartilage and synovium, we reasoned that a comparative analysis of its protein constituents in health and OA could identify pathways involved in joint damage. A proteomic analysis of knee SF from OA patients and control subjects was performed and compared to microarray expression data from cartilage and synovium.
Methods
Age-matched knee SF samples from control subjects, and patients with early- and late-stage OA (n=10 per group) were compared using two-dimensional differential gel electrophoresis (2D-DIGE) and mass spectrometry (MS). A MS with multiplexed peptide selected reaction monitoring (SRM) assay was used to confirm differential expression of a subset of proteins in an independent OA patient cohort. Proteomic results were analyzed by Ingenuity pathway analysis and compared to published synovial tissue and cartilage mRNA profiles.
Results
66 proteins were differentially present in healthy and OA SF. Three major pathways were identified among these proteins: the acute phase response, and the complement and coagulation pathways. Differential expression of 5 proteins was confirmed by SRM assay. A focused analysis of transcripts corresponding to the differentially present proteins indicates that both synovial and cartilage tissues may contribute to the OA SF proteome.
Conclusion
Proteins involved in the acute phase response, complement and coagulation pathways are differentially regulated in SF of OA patients suggesting they contribute to joint damage. Validation of these pathways and their utility as biomarkers or therapeutic targets in OA is warranted.
INTRODUCTION
The pathophysiology of osteoarthritis (OA), the most common joint disease and a significant cause of disability in the elderly, remains poorly understood. Development of this disease is multifactorial, with local mechanical factors, such as malalignment and internal derangements, and systemic factors, including genetics and obesity, each contributing to loss of joint integrity (1). Although OA is characterized by progressive loss of cartilage within the joint, substantial changes occur in the synovium and subchondral bone. However, the relative contribution of these tissues to disease pathogenesis is unresolved. Our poor understanding of the pathways that drive joint damage in OA is a major impediment to the development of disease modifying agents.
Advances in the sensitivity and throughput of MS-based proteomic techniques have made their application as a discovery method in complex biologic fluids feasible. Proteomic approaches have the advantage over nucleic acid expression profiling in that their interpretation is not limited by a possible disconnect between gene and protein expression levels. As such, this technology has emerged as a powerful method to identify proteins involved in disease etiology and pathogenesis, as well as potential biomarkers (2, 3).
To date, proteomic studies in OA using cartilage, chondrocytes, synovial fibroblasts, and bone marrow mesenchymal stem cells have provided novel insights into joint pathophysiology (4–7). While these studies were informative, an inherent limitation of these tissue- and lineage-based analyses is their inability to fully represent the physiology of the intact joint. Since SF bathes all the intrinsic structures of diarthrodial joints, an analysis of its constituents offers a unique opportunity to study the entire diseased OA joint.
In a pilot study employing a relatively insensitive liquid chromatography with tandem MS (LC-MS/MS) method, we analyzed SF proteins in healthy individuals and OA subjects and identified 18 differentially expressed proteins (8). In the current study, a more sensitive method based on gel electrophoresis and MS was used to quantitatively probe deeper into the SF proteome of OA. A subset of these dysregulated proteins was confirmed in OA SF using a MS assay that detects representative peptides from these proteins. Finally, a comparison of our proteomics results with mRNA expression profiling of joint tissues suggests some of these proteins are derived from synovium or cartilage.
PATIENTS AND METHODS
Human subjects and samples
For the 2D-DIGE experiments, patients ranged in age from 45–65. SF from patients with late OA (LOA, n=10, 4 male and 6 female) was procured at time of total knee arthroplasty. Early OA (EOA, n=10, 3 male and 7 female) subjects were patients undergoing surgery for knee pain due to MRI-documented meniscal tear who had mild cartilage degeneration visualized at surgery. SF was obtained at the time of arthroscopy. Control subjects (n=10, 6 male and 4 female) were asymptomatic individuals without radiographic OA paid to undergo arthrocentesis and were age and gender matched to the EOA cohort. Exclusion criteria included inflammatory arthritis, steroid injection within 6 weeks, blood dyscrasias and active malignancy. All patients and volunteers gave informed consent, and the University Hospital Medical Ethics Committee at Case Western University approved the study.
For the SRM assays, SF was from healthy individuals (n=13) with no symptoms of knee OA; patients with <1 year of symptoms and EOA (n=16), as assessed by the presence of arthroscopically visible cartilage lesions or by radiographic imaging; and patients with LOA (n=119) undergoing total knee replacement. Samples for this cohort were obtained under protocols approved by Partners Healthcare IRB.
Synovial tissue biopsies for mRNA analysis were obtained from patients with early and late knee OA recruited at the Hospital for Special Surgery (HSS) as described previously(9). Briefly, patients with advanced knee OA (LOA, n=9) meeting ACR criteria undergoing total knee replacement surgery were recruited. LOA patients were required to have pre-operative K-L score ≥ 2 and intra-operative evidence of full-thickness chondral loss. Patients with early knee OA (EOA, n=10) were undergoing arthroscopic procedures for degenerative meniscal tears, with documented cartilage fibrillation or fissuring by intra-operative inspection but no full-thickness cartilage loss and K-L score ≤ 2. Biopsies for mRNA isolation were obtained from the suprapatellar pouch. Details of the transcriptional profiling was previously described (10). The Institutional Review Board at the Hospital for Special Surgery approved the study and informed consent was obtained from all patients.
The cartilage samples used for gene expression profiling were obtained with Institutional Review Board approval and described previously (11). RNA extracts were obtained directly from cartilage samples from 13 normal individuals and 12 late-stage OA using a freezer/mill.
Two-dimensional difference in-gel electrophoresis (2D DIGE)
SF preparation. SF samples were flash frozen in liquid nitrogen after the addition of protease inhibitors (Roche Diagnostics, Germany) and stored at −80°C. Prior to 2D-DIGE SF was thawed on ice, centrifuged at 400 x g at 4°C to remove blood cells, treated with bovine hyaluronidase (Sigma, St. Louis, Missouri) and depleted of abundant proteins with an Agilent High Capacity Multiple Affinity Removal Spin Cartridge Human 6 (Agilent Technologies, Santa Clara, California). This cartridge depletes albumin, IgG, IgA, transferrin, haptoglobin, and antitrypsin and eliminates 85–90% of protein. Gel Electrophoresis. Two experiments were conducted following the design described in Supplementary Table 1. The quenched Cy3- and Cy5-labeled samples were combined and mixed with an aliquot of Cy2-labeled standard specific to each set. The remaining protocol for gel electrophoresis and gel visualization is as previously described (12). Image Analysis. A representative gel image used for analysis is shown in Supplementary Figure 1. To compare protein spots across the six gels and nine gels (set 1 and set 2, Supplementary Table 1), DeCyder Software V6.5 2 (GE Healthcare) was used for image analysis. Images consisting of four biological replicates from group 1 and six biological replicates from group 2 were loaded into the DIA (Differential in-gel analysis) algorithm within the DeCyder software and intra-gel spot detection and quantification was performed. The entire set of protein spots were matched with the Biological variation analysis module (BVA). The standardized volume ratio for each standard image from the different gels is set to the value 1.0 in order to compare ratios between matched protein spots in the different gels (groups). Student’s t-test (p < 0.05) was used for statistical analyses. In addition, the results related to control and diseased samples were compared and statistically evaluated by one-way analysis of variance (ANOVA) with the DeCyder BVA module, applying the false discovery rate (FDR) mode to minimize false-positives. Protein spots with statistically significant variation (p ≤ 0.05), showing a difference in volume of >1.0 fold above and <1.0 below, were selected as differentially present. For spots meeting these requirements, a pick list was generated, transferred to the automated Ettan spot picker and gel plugs were excised and recovered into 96-well plate for in-gel digestion and MS analysis. In gel digestion and protein identification. Recovered gel plugs were digested with trypsin (Promega) and analyzed by MS as described (12, 13). The tandem mass spectra were annotated and peak list DTA files were generated using MASCOT. The peak lists were compared to Swiss Prot database, 2010 (human) (20278 sequences) using MASCOT search engine. Criteria for protein identification. Scaffold (version Scaffold_3_00_08, Proteome Software Inc., Portland, OR) was used to validate MS/MS based peptide and protein identifications. X! Tandem and Mascot were set up to search a subset of the uniprot_sprot_5_2010. Peptide identifications were accepted if they could be established at greater than 95.0% probability as specified by the Peptide Prophet algorithm (14). Protein identifications were accepted if they could be established at greater than 99.0% probability and contained at least 1 unique identified peptides. Protein probabilities were assigned by the Protein Prophet algorithm (15). Proteins that contained similar peptides and could not be differentiated based on MS/MS analysis alone were grouped to satisfy the principles of parsimony. Spots containing keratin species (as determined by molecular weight and peptide identification) were removed from further consideration. 84 spots from set 1 and 44 from set 2 were removed based on this analysis. Expression values of each protein spot were represented as the fold change. The data were transferred into R-Bioconductor, and a heat map was generated using ‘gplots’ package (16).
Network Analysis
The list of regulated proteins identified by 2D-DIGE/MS was analyzed by pathway analysis using the network-building tool, Ingenuity Pathway Analysis (Ingenuity Systems, www.ingenuity.com). The analysis identified the biological functions and/or diseases most significant within the dataset.
SRM assays
SRM assays were developed on a TSQ Vantage triple quadrupole mass spectrometer, (Thermo Fisher Scientific) as previously described (17–19). Each sample was digested and analyzed three times in the SRM assay to total three technical replicates. One-way ANOVA was performed with p<0.05 considered significant. Bonferroni post-test was used to evaluate differences between groups.
Microarray data collection
Published microarray expression data for OA patients and normal controls used in this study included OA synovial tissue from HSS (GSE32317) (10), normal synovial tissue from the public Gene Expression Omnibus GSE12021 (20) and a cartilage dataset (11). See cited references for details regarding RNA extraction.
mRNA Expression Level Analysis and clustering
Primary expression level data files (.cel files) from these studies were merged and normalized using the robust multiarray averaging (RMA) method in MATLAB™ (The MathWorks, Inc.). Thirty-one patient samples and 22 controls from the 2 tissue types were included in this study. Genes of interest identified from the proteomic analysis were mapped to their probes and heatmaps of an unsupervised hierarchical clustering analysis were generated using MATLAB™ (21).
RESULTS
2D DIGE Analysis of SF proteins
SF from 10 control subjects, 10 subjects with EOA and 10 subjects with LOA were subjected to 2D DIGE-MS analysis. In this technique, samples are labeled with spectrally different fluorescent dyes (Cy3 or Cy5) prior to electrophoresis in combination with an internal standard, which allows for intra- and inter-gel matching between samples (22, 23). Samples were batched into 2 experimental sets (Supplementary Table 1). On average, more than 2200 individual spots per SF gel image were detected and matched across subjects. Data filtering was performed using volume ratio change of >1.0 fold (either increased or decreased) and a p-value < 0.05. From these initial spots, 199 spots in set 1 and 138 spots in set 2 satisfied these criteria and were picked for protein identification. If the same protein was identified in different spots across the 2D gel, suggesting post-translational modifications, these replicates were omitted and the protein was reported only once. Using fold change from the fluorescent images as a representation of relative protein abundance, protein spots were compared for changes between healthy and LOA. A total of 43 and 42 proteins were differentially present across sets 1 and 2, respectively (Tables 1, 2 and full data set in Supplementary Tables 2, 3). To develop a larger protein list for further analysis, we combined these 2 datasets, noting that 19 proteins were observed in both sets (annotated with # in Table 2 and Supplementary Table 4) and the fold change was similar, except for annexin A2 and apolipoprotein A-I, which were upregulated in set 1 and downregulated in set 2. Combining the data from these 2 experiments produces a final list of 66 spots that are differentially present between healthy and LOA subjects (Supplementary Table 4). A subset of these proteins in the complement pathway was previously reported in Wang et al (10) though this previous publication did not report quantitative differences between healthy and OA SF.
Table 1.
Differentially expressed proteins between LOA and healthy in set 1
| Accession No. | Spot | Protein Description | Gene Name | Fold Change |
|---|---|---|---|---|
| P43652 | 676 | Afamin | AFM | 1.76 |
| P01009 | 787 | Alpha-1-antitrypsin | SERPINA1 | 1.39 |
| P04217 | 822 | Alpha-1B-glycoprotein | A1BG | 1.72 |
| P01023 | 215 | Alpha-2-macroglobulin | A2M | 2.89 |
| P07355 | 1055 | Annexin A2 | ANXA2 | 2.34 |
| P01008 | 1019 | Antithrombin-III | SERPINC1 | 1.18 |
| P02647 | 2285 | Apolipoprotein A-I | APOA1 | 2.23 |
| O75882 | 189 | Attractin | ATRN | 2.15 |
| P02749 | 1126 | Beta-2-glycoprotein 1 | APOH | 1.82 |
| P04003 | 803 | C4b-binding protein alpha chain | C4BPA | 1.46 |
| P22792 | 597 | Carboxypeptidase N subunit 2 | CPN2 | 2.14 |
| Q9NQ79 | 727 | Cartilage acidic protein 1 | CRTAC1 | 3.12 |
| P00450 | 361 | Ceruloplasmin | CP | 2.54 |
| P02746 | 2158 | Complement C1q subcomponent subunit B | C1QB | 1.34 |
| P00736 | 616 | Complement C1r subcomponent | C1R | 2.71 |
| P09871 | 654 | Complement C1s subcomponent | C1S | 2.31 |
| P01024 | 470 | Complement C3 | C3 | 2.1 |
| P13671 | 421 | Complement component C6 | C6 | 1.91 |
| P10643 | 584 | Complement component C7 | C7 | 2.23 |
| P02748 | 887 | Complement component C9 | C9 | 2.17 |
| P00751 | 588 | Complement factor B | CFB | 2.07 |
| P08603 | 276 | Complement factor H | CFH | 1.62 |
| P05156 | 1214 | Complement factor I | CFI | 2.05 |
| P02675 | 1158 | Fibrinogen beta chain | FGB | 3.48 |
| P02679 | 721 | Fibrinogen gamma chain | FGG | 4.83 |
| P02751 | 85 | Fibronectin | FN1 | 4.07 |
| P06396 | 665 | Gelsolin | GSN | −1.71 |
| P02790 | 959 | Hemopexin | HPX | 1.81 |
| P05546 | 760 | Heparin cofactor 2 | SERPIND1 | 3.55 |
| P19827 | 752 | Inter-alpha-trypsin inhibitor heavy chain H1 | ITIH1 | 4.01 |
| Q14624 | 457 | Inter-alpha-trypsin inhibitor heavy chain H4 | ITIH4 | 2.03 |
| P01042 | 966 | Kininogen-1 | KNG1 | 1.76 |
| P51884 | 652 | Lumican | LUM | 2.5 |
| Q96PD5 | 802 | N-acetylmuramoyl-L-alanine amidase | PGLYRP2 | 1.26 |
| P05155 | 663 | Plasma protease C1 inhibitor | SERPING1 | 2.04 |
| Q15113 | 1326 | Procollagen C-endopeptidase enhancer 1 | PCOLCE | 1.67 |
| P00734 | 679 | Prothrombin | F2 | 3.93 |
| P52566 | 2609 | Rho GDP-dissociation inhibitor 2 | ARHGDIB | −1.62 |
| P02768 | 937 | Serum albumin | ALB | 1.52 |
| P27169 | 1242 | Serum paraoxonase/arylesterase 1 | PON1 | 2.76 |
| P05452 | 2364 | Tetranectin | CLEC3B | −1.51 |
| P37837 | 1646 | Transaldolase | TALDO1 | −1.94 |
| P02774 | 1187 | Vitamin D-binding protein | GC | 1.81 |
Table 2.
Differentially expressed proteins between LOA and healthy in set 2
| Accession No. | Spot | Protein Description | Gene Name | Fold Change |
|---|---|---|---|---|
| P60709 | 1563 | Actin, cytoplasmic 1 | ACTB | −1.45 |
| P43652 | 766 | Afamin# | AFM | 2.26 |
| P01011 | 1218 | Alpha-1-antichymotrypsin | SERPINA3 | −1.4 |
| P04217 | 846 | Alpha-1B-glycoprotein# | A1BG | 1.54 |
| P01023 | 210 | Alpha-2-macroglobulin# | A2M | 2.63 |
| P07355 | 1778 | Annexin A2# | ANXA2 | −1.39 |
| P09525 | 1868 | Annexin A4 | ANXA4 | −1.36 |
| P01008 | 1105 | Antithrombin-III# | SERPINC1 | 1.5 |
| P02647 | 1915 | Apolipoprotein A-I# | APOA1 | −1.39 |
| P06727 | 1472 | Apolipoprotein A-IV | APOA4 | 1.58 |
| P05090 | 1938 | Apolipoprotein D | APOD | −1.43 |
| Q9NQ79 | 765 | Cartilage acidic protein 1# | CRTAC1 | 2.04 |
| P00450 | 396 | Ceruloplasmin# | CP | 1.78 |
| P10909 | 1719 | Clusterin | CLU | 1.62 |
| P02747 | 2090 | Complement C1q subcomponent subunit C | C1QC | −1.49 |
| P09871 | 712 | Complement C1s subcomponent# | C1S | 2.34 |
| P01024 | 825 | Complement C3# | C3 | 1.79 |
| P0C0L4 | 937 | Complement C4-A | C4A | 1.46 |
| P02748 | 973 | Complement component C9# | C9 | 2.22 |
| P08603 | 305 | Complement factor H# | CFH | 1.62 |
| Q03591 | 1611 | Complement factor H-related protein 1 | CFHR1 | −1.46 |
| P02679 | 849 | Fibrinogen gamma chain# | FGG | 7.05 |
| P02751 | 44 | Fibronectin# | FN1 | 1.44 |
| P06396 | 764 | Gelsolin# | GSN | −1.93 |
| P22352 | 2146 | Glutathione peroxidase 3 | GPX3 | −1.27 |
| P02790 | 1414 | Hemopexin# | HPX | 1.7 |
| P01871 | 864 | Ig mu chain C region | IGHM | 3.45 |
| P35858 | 776 | Insulin-like growth factor-binding protein complex acid labile subunit | IGFALS | 2.38 |
| P19827 | 856 | Inter-alpha-trypsin inhibitor heavy chain H1# | ITIH1 | 4.98 |
| Q14624 | 394 | Inter-alpha-trypsin inhibitor heavy chain H4# | ITIH4 | 1.85 |
| P01042 | 983 | Kininogen-1# | KNG1 | 2.12 |
| P24666 | 2208 | Low molecular weight phosphotyrosine protein phosphatase | ACP1 | −1.73 |
| P15586 | 840 | N-acetylglucosamine-6-sulfatase | GNS | 2.41 |
| P30086 | 1503 | Phosphatidylethanolamine-binding protein 1 | PEBP1 | 1.58 |
| P80108 | 385 | Phosphatidylinositol-glycan-specific phospholipase D | GPLD1 | 1.87 |
| Q8IV08 | 1338 | Phospholipase D3 | PLD3 | −1.4 |
| P36955 | 1346 | Pigment epithelium-derived factor | SERPINF1 | 1.23 |
| P03952 | 805 | Plasma kallikrein | KLKB1 | 1.26 |
| P02760 | 1867 | Protein AMBP | AMBP | 1.92 |
| Q15493 | 1737 | Regucalcin | RGN | −1.56 |
| Q13228 | 1297 | Selenium-binding protein 1 | SELENBP1 | 1.44 |
| P04004 | 818 | Vitronectin | VTN | 1.22 |
denotes those proteins that were also present in set 1
To determine whether the proteomic signatures of EOA and LOA were overlapping or unique, expression of the differentially regulated proteins from our primary analysis (Tables 1 and 2) was compared between these samples relative to healthy controls. This has been graphically represented with heat maps for the EOA and LOA vs. healthy, plotted side by side for each protein identified in sets 1 and 2 (Figure 1A and B, respectively). In set 1, there was 100% concordance between expression of proteins differentially regulated in LOA and EOA compared to healthy. In set 2, the concordance was also strong with only 3 proteins (C9, protein AMBP and apolipoprotein A-IV) showing discordant expression. These data suggest that the proteomic signature of OA is firmly established in EOA patients.
Figure 1.
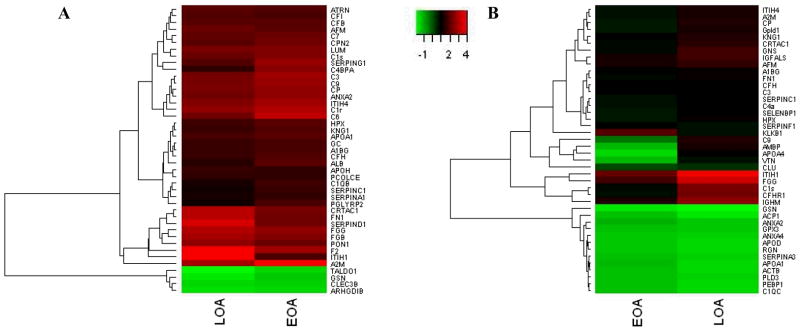
Heat map representation of differentially expressed proteins across the patient subsets (LOA and EOA) from the two experimental sets. Proteins are listed by their respective gene names. E and L represent fold changes of EOA and LOA patient subsets compared to healthy in (A) set 1 and (B) set 2.
Pathway analysis of SF proteins
An unbiased bioinformatics approach using the Ingenuity pathway analysis tool was employed to identify deregulated functional pathways in the OA SF proteome. Proteins with fold changes of at least ±1.2 were taken as significant for pathway analysis. We focused the pathway analysis on LOA vs. healthy, as the highest number of differentially present proteins was contained within this group. The top 5 molecular and cellular functions were antigen presentation, cell-to-cell signaling and interaction, lipid metabolism, molecular transport, and small molecule biochemistry (Table 3), similar to functional classifications identified in smaller OA proteomic studies (5, 24). The canonical pathways associated with our proteins were acute phase response signaling, the complement and coagulation systems. The individual canonical pathways and their statistical analyses are depicted in Supplementary Figure 2 and Table 3.
Table 3.
Details of Ingenuity pathway analysis of top molecular and cellular functions and top canonical pathways.
| Ingenuity Pathway Analysis | p-value | # Proteins or Ratio |
|---|---|---|
| Molecular and Cellular Functions | ||
| Antigen presentation | 2.21E-09 - 1.68E-02 | 16 |
| Cell-to-cell signaling and interaction | 1.08E-08 - 2.51E-02 | 17 |
| Lipid metabolism | 3.95E-07 - 2.33E-02 | 16 |
| Molecular transport | 3.95E-07 - 2.09E-02 | 19 |
| Small molecule biochemistry | 3.95E-07 - 2.33E-02 | 23 |
| Top Canonical Pathways | ||
| Acute Phase Response Signaling | 4.38E-33 | 25/172 |
| Complement System | 1.17E-23 | 13/33 |
| Coagulation System | 1.52E-14 | 9/35 |
| Intrinsic Prothrombin Activation Pathway | 1.22E-09 | 6/29 |
| Extrinsic Prothrombin Activation Pathway | 5.05E-07 | 4/16 |
Validation of protein targets by quantitative selected reaction monitoring (SRM) assays
To validate differences in protein expression between healthy and OA SFs identified by 2D-DIGE, we developed specific mass spectrometry assays using SRM. This technique measures peptides representative of proteins of interest generated by proteolysis of biologic samples. Levels of target peptides are quantified using otherwise chemically identical peptide standards synthesized with heavy isotopes (25). Reactions were developed for 10 peptides representative of 5 proteins with increased expression in the SF of OA patients by 2D-DIGE: afamin, clusterin, insulin-like growth factor-binding protein complex acid labile subunit (IGFALS), lumican and pigment epithelium-derived factor. Concordant with the 2D-DIGE results, in an independent cohort of SF samples from 13 healthy, 16 EOA and 119 LOA subjects, all 10 peptides showed a significant increase in EOA and LOA (Figure 2 and Supplementary Figure 3).
Figure 2.

Validation of differentially expressed proteins in OA SF by SRM. Relative concentration of the indicated peptides in healthy, EOA and LOA SFs representative of (A) afamin, (B) clusterin, (C) insulin-like growth factor-binding protein complex acid labile subunit, (D) lumican, and (E) pigment epithelium-derived factor. p<0.001 for all peptides.
Cartilage and synovial tissue gene expression profiling
SF components may originate from multiple joint tissues, including cartilage and synovium. To gain insight into the relative contribution of the two tissues to the OA proteome, expression datasets from normal and OA synovial tissue and cartilage were probed for mRNAs corresponding to the SF proteins. Probes for the mRNAs encoding 64 of the 66 SF proteins were assessed in each microarray dataset and unsupervised hierarchical clustering analysis was performed to identify global expression patterns in health versus disease. Specifically, the synovial tissue contribution to the OA SF proteome was assessed using Affymetrix mRNA expression datasets for healthy synovium that were publically available merged with expression datasets of EOA and LOA synovium as described in patients and methods (9, 10). OA and control synovial tissue clustered separately, with EOA and LOA also clustering (Figure 3a). Comparing differential expression from the transcriptome analysis in synovium to the proteomic expression in SF, a few interesting trends were noticed. Gelsolin (GSN) and many complement proteins showed concordant expression in both synovium and SF, suggesting the synovium may be the primary source of these proteins in the SF. Of the 14 complement pathway hits from the Ingenuity pathway analysis of the synovial fluid proteome, 11 showed concordant expression in synovial tissue (C1R, C1QB, C1S, C3, C4A, C7, C9, CFB, CFH, CFHR1, CFI). For the other Ingenuity pathways (coagulation and acute phase), less than one third of the proteins were concordant in synovial tissue. Other proteins such as lumican (LUM), plasma protease C1 inhibitor (SERPING1) and apolipoprotein A1 (APOA1) were discordant, suggesting they may not be derived from a synovial source.
Figure 3.

Examination of synovial or cartilage tissue expression of mRNA transcripts encoding proteins differentially present in LOA vs. healthy SF. Unsupervised cluster analysis of mRNA from either (A) synovium or (B) cartilage encoding for proteins differentially expressed in LOA SF. Disease status for individual samples is listed at the bottom of each panel.
In parallel studies, the contribution of cartilage tissue to the proteins expressed in SF was investigated using a microarray dataset from cartilage specimens from healthy and OA subjects (11). Similar to the synovial analysis, unsupervised clustering analyses differentiated healthy versus OA cartilage tissue (Figure 3b). Comparing differential expression of transcripts in cartilage to proteomic expression in SF, we noted concordant upregulation of the extracellular matrix proteins cartilage acidic protein (CRTAC1) and lumican (LUM). We also noted that transaldolase (TALDO1) and glutathione peroxidase 3 (GPX3) were downregulated in OA cartilage and OA SF. Comparisons of the Ingenuity pathways to the cartilage microarray data was less clear than in synovium. Only 5 of the 14 complement pathway targets showed concordant expression in cartilage tissue. For the coagulation system, only 2 of the 9 factors were concordant in SF and cartilage tissue.
Furthermore, we formally compared the differentially expressed transcripts in the microarrays to the 66 proteins identified in the SF proteome. Using a cut off of fold change > ±2 and p<0.05, cartilage had 17 of the 66 transcripts differentially expressed and synovium had 15 of the 66. We focused on the transcripts that had differential expression in cartilage and synovium concordant with our proteome, as these may be the most biologically relevant. In cartilage, 10 transcripts were concordant: ATRN, C1S, CFI, CRTAC1, FN1, GNS, GPX3, LUM, PCOLCE and SERPINF1. In synovium, 11 transcripts were concordant: ATRN, C1R, C7, CFB, CFI, CP, CRTAC1, FN1, GSN, ITIH4 and PCOLCE. Several of these are members of the complement and acute phase response pathways. While it is challenging to directly compare transcript and protein levels, due to regulation of mRNA translation and post-translational protein modifications, our analysis suggests that synovium and cartilage contribute to the differential regulation of proteins in OA SF.
DISCUSSION
In this study, we performed 2D-DIGE and MS analysis to identify differentially present proteins in SF from OA subjects compared to age-matched controls. We hypothesized that an examination of protein expression in the fluid that bathes joint structures would provide insight into potential pathogenic mechanisms of this prevalent condition. Among these differentially present proteins three dominant pathways were identified: the acute phase response, and the complement and coagulation pathways.
The acute phase response signature may be a reaction to tissue injury in the damaged joint. While it is appreciated that OA is associated with prior joint trauma, some have assumed that the ensuing joint damage results from aberrant mechanical loading (26). However, other studies have shown synovial inflammation to be present after trauma, as well as later in the course of OA (27, 28). In particular, acute phase reactants such as C-reactive protein and IL-6 are elevated in OA patients undergoing surgery (29) and proinflammatory cytokines and chemokines have been identified in synovial tissues in both early and late OA (30, 31). When tissues are damaged, the body attempts to heal the architectural disruption by initiating a remodeling and reconstruction program. Since this acute phase response pattern was present to a similar degree in EOA and LOA, our data suggest that the chronic progressive articular damage of OA occurs through an ongoing inflammatory response associated with unresolved tissue injury. This observation is congruent with previous work identifying wound physiology and associated inflammation in OA (reviewed in (32) ) and supports therapeutic approaches which interrupt tissue injury pathways.
Our proteomic analyses also identified upregulation of complement proteins in OA SF, extending our initial description of OA SF proteome, wherein several members of the complement pathway emerged (8). Supporting a functional role for complement in OA pathogenesis, Wang et al recently showed that mice lacking complement factor 5 and components of the membrane attack complex were protected from experimental OA. Thus, the presence of elevated levels of complement pathway proteins in OA may reflect an important pathophysiologic aspect of the disease. Furthermore, the concordant expression of complement components in SF and their corresponding mRNAs in synovium, suggests these factors are made, at least in part, by the joint lining.
The final pathway our analysis identified as deregulated in OA SF was the coagulation cascade. While fibrin deposition in joint tissues is common in inflammatory arthritis (33–35), its involvement in OA is less appreciated. One proteomic study comparing SF to plasma showed fibrinogen degradation products in OA SF, but not plasma (36). Likewise, another analysis demonstrated that the balance between fibrin activation and fibrinolysis is perturbed in OA, with increased fibrin deposition and degradation products in SF (33, 37). A recent study showed plasma proteins, including fibrinogen, were present in SF, and the authors hypothesized this was either from plasma exudation or production by synovial tissues (38). Our data provides evidence that some components of the coagulation pathway may be produced locally. As there is overlap between the proteins in the coagulation and the acute response pathways, this observation may reflect OA wound physiology discussed above. How the coagulation pathway contributes to joint damage, inflammation and pain in OA awaits definition.
Our findings should be put in perspective with other proteomic analyses of OA SF. Yamagiwa et al. used 2D-PAGE to compare OA SF from 4 subjects and found 18 proteins with >5 fold change in spot intensity, two of which were likely haptoglobin α2 chains (39). Kamphorst et al. identified 40 proteins by nanoscale LC-MS in 1 OA compared to 1 healthy subject and found most of the proteins were either structural proteins, or related to the coagulation cascade and immune response (40). While these general categories are similar our study, there is less than 25% identity with our protein list. In our previous study, we identified 18 proteins differentially expressed in OA compared to control SFs, some of which were replicated in this study, such as fibrinogen, beta-2 glycoprotein I, complement component 3, vitamin D binding protein and protein AMBP (8). The use of an affinity depletion column to remove high abundance serum proteins was one difference between the current study and our prior one and may have increased our sensitivity. Finally, Mateos et al. recently used LC-MALDI TOF/TOF to analyze the proteome of pooled OA and RA SF and found 136 different proteins, with 17 more abundant in OA (41). Eight of these 17 proteins were differentially expressed in our experiment (tetranectin, inter-alpha-trypsin inhibitor heavy chain H1, gelsolin, plasma protease C1 inhibitor, cartilage acidic protein 1, fibronectin, pigment epithelium-derived factor, alpha-1B-glycoprotein), validating our approach and providing more evidence for these proteins in the pathogenesis of OA.
Differential expression of a subset of the OA SF proteome was validated in an independent cohort using a complementary MS technique, SRM, to provide precise quantification and additional specificity. While protein quantification in biologic fluids has been dominated by immunoassays, SRM assays which quantify surrogate target peptides are increasingly being applied in research and clinical settings (42). SRM-based assays are typically robust and selective, even in complex matrices, and can be multiplexed to measure dozens of peptides simultaneously. Such assays could be used to quantify peptide biomarkers for disease diagnosis and prognosis, (25, 43, 44).
One of our goals was to determine the likely tissue source(s) of the differentially expressed proteins. As discussed above, our analyses suggest that the synovium and cartilage are important sources of some of the differentially regulated proteins in OA. Some of the transcripts were not clearly differentially regulated in the tissue microarrays we tested, so they may be derived from bone, plasma or cells infiltrating the joint (38). This may be the case for the coagulation pathway proteins, as there was low concordance between the microarray and proteomic data for this pathway. However, inherent technical limitations make it difficult to draw any conclusions from poor correlations between mRNA and protein levels. First, the microarray data may not have been sufficiently sensitive to detect differential expression of some of the mRNAs. Second, the relationship between mRNA and protein levels is affected by complex regulatory mechanisms that cannot be captured by the techniques used in this study. Indeed, others have shown a weak correlation between mRNA and protein abundance (45). Another factor that limits our power to draw conclusions from our data is that some of the transcriptional and protein changes in the joint may reflect processes occurring more globally in the patient. For example, Pan et al found elevations in lumican in pancreatic cancer and chronic pancreatitis, suggesting that other diseases may affect lumican levels(46). Another study showed pigment epithelium-derived factor correlates with high sensitivity CRP levels in normal subjects(47). These studies suggest that tissues besides synovium and cartilage, as well as inflammation, could explain the protein variation in our study.
Limitations of the sensitivity of our study include the stringent definition of differential protein abundance and the elimination of any spot in the 2D-DIGE analysis with keratin contamination. Though we likely we missed proteins using this approach, it probably enhanced our specificity. In addition, our sample size of 30 subjects, though larger than any previous similar study, was still rather small but had the advantage of containing well-characterized subjects and age matched controls. Lastly, we cannot exclude the possibility that some of the controls had occult OA but none met ACR classification for knee OA (48).
In summary, to our knowledge the current study has identified the largest number of differentially expressed proteins in OA SF compared to healthy. Analysis of these expression profiles uncovers signals from functional pathways not widely appreciated in OA pathophysiology. Validation of the differential expression of proteins identified in our study in larger cohorts is mandated, as are functional studies to dissect the roles of these pathways in OA pathogenesis. Finally, assessment of potential biomarkers and therapeutic targets for drug development within the OA proteome identified here is warranted.
Supplementary Material
Acknowledgments
The authors wish to acknowledge Elizabeth Yohannes, Case Proteomic Center and Vinay Vishwanath, Universität für Bodenkultur Wien, Austria for their advice on interpreting the 2D DIGE data. We also thank Alejandra Garces, of Thermo Fisher Scientific BRIMS Center, for performing and analyzing the SRM assays of synovial fluid.
This work was supported by following grants:
NIH T32 AR007530-26 (SYR) ; NIH R01-AG022021 (MBG); R21-AR054887 (MBG) ; Hospital for Special Surgery Frankenthaler Fellowship in Restorative Mobility (CRS); NIH K08AR057859 (CRS); NIH K08AR054859 (AOA); Burroughs Wellcome Fund Career Award (AOA)
Footnotes
Disclosures
DML has equity in Synostics, Inc and is currently employed by Novartis Pharma AG. BK, AG, DS, and ML are employees at the Biomarkers Research Initiatives in Mass Spectrometry Center, ThermoFisher Scientific. RG has a patent on protein profiles in OA.
References
- 1.Hunter DJ, Felson DT. Osteoarthritis. BMJ. 2006;332(7542):639–42. doi: 10.1136/bmj.332.7542.639. [DOI] [PMC free article] [PubMed] [Google Scholar]
- 2.Addona TA, Shi X, Keshishian H, Mani DR, Burgess M, Gillette MA, et al. A pipeline that integrates the discovery and verification of plasma protein biomarkers reveals candidate markers for cardiovascular disease. Nat Biotechnol. 2011;29(7):635–43. doi: 10.1038/nbt.1899. [DOI] [PMC free article] [PubMed] [Google Scholar]
- 3.Kulasingam V, Diamandis EP. Strategies for discovering novel cancer biomarkers through utilization of emerging technologies. Nat Clin Pract Oncol. 2008;5(10):588–99. doi: 10.1038/ncponc1187. [DOI] [PubMed] [Google Scholar]
- 4.De Ceuninck F, Berenbaum F. Proteomics: addressing the challenges of osteoarthritis. Drug Discov Today. 2009;14(13–14):661–7. doi: 10.1016/j.drudis.2009.05.006. [DOI] [PubMed] [Google Scholar]
- 5.Rollin R, Marco F, Camafeita E, Calvo E, Lopez-Duran L, Jover JA, et al. Differential proteome of bone marrow mesenchymal stem cells from osteoarthritis patients. Osteoarthritis Cartilage. 2008;16(8):929–35. doi: 10.1016/j.joca.2007.12.006. [DOI] [PubMed] [Google Scholar]
- 6.Bo GP, Zhou LN, He WF, Luo GX, Jia XF, Gan CJ, et al. Analyses of differential proteome of human synovial fibroblasts obtained from arthritis. Clin Rheumatol. 2009;28(2):191–9. doi: 10.1007/s10067-008-1013-y. [DOI] [PubMed] [Google Scholar]
- 7.Ruiz-Romero C, Blanco FJ. Proteomics role in the search for improved diagnosis, prognosis and treatment of osteoarthritis. Osteoarthritis Cartilage. 2010;18(4):500–9. doi: 10.1016/j.joca.2009.11.012. [DOI] [PubMed] [Google Scholar]
- 8.Gobezie R, Kho A, Krastins B, Sarracino DA, Thornhill TS, Chase M, et al. High abundance synovial fluid proteome: distinct profiles in health and osteoarthritis. Arthritis Res Ther. 2007;9(2):R36. doi: 10.1186/ar2172. [DOI] [PMC free article] [PubMed] [Google Scholar]
- 9.Scanzello CR, Umoh E, Pessler F, Diaz-Torne C, Miles T, Dicarlo E, et al. Local cytokine profiles in knee osteoarthritis: elevated synovial fluid interleukin-15 differentiates early from end-stage disease. Osteoarthritis Cartilage. 2009;17(8):1040–8. doi: 10.1016/j.joca.2009.02.011. [DOI] [PubMed] [Google Scholar]
- 10.Wang Q, Rozelle AL, Lepus CM, Scanzello CR, Song JJ, Larsen DM, et al. Identification of a central role for complement in osteoarthritis. Nat Med. 2011;17(12):1674–9. doi: 10.1038/nm.2543. [DOI] [PMC free article] [PubMed] [Google Scholar]
- 11.Ijiri K, Zerbini LF, Peng H, Otu HH, Tsuchimochi K, Otero M, et al. Differential expression of GADD45beta in normal and osteoarthritic cartilage: potential role in homeostasis of articular chondrocytes. Arthritis Rheum. 2008;58(7):2075–87. doi: 10.1002/art.23504. [DOI] [PMC free article] [PubMed] [Google Scholar]
- 12.Yohannes E, Chang J, Christ GJ, Davies KP, Chance MR. Proteomics analysis identifies molecular targets related to diabetes mellitus-associated bladder dysfunction. Mol Cell Proteomics. 2008;7(7):1270–85. doi: 10.1074/mcp.M700563-MCP200. [DOI] [PMC free article] [PubMed] [Google Scholar]
- 13.Shevchenko A, Wilm M, Vorm O, Mann M. Mass spectrometric sequencing of proteins silver-stained polyacrylamide gels. Anal Chem. 1996;68(5):850–8. doi: 10.1021/ac950914h. [DOI] [PubMed] [Google Scholar]
- 14.Keller A, Nesvizhskii AI, Kolker E, Aebersold R. Empirical statistical model to estimate the accuracy of peptide identifications made by MS/MS and database search. Anal Chem. 2002;74(20):5383–92. doi: 10.1021/ac025747h. [DOI] [PubMed] [Google Scholar]
- 15.Nesvizhskii AI, Keller A, Kolker E, Aebersold R. A statistical model for identifying proteins by tandem mass spectrometry. Anal Chem. 2003;75(17):4646–58. doi: 10.1021/ac0341261. [DOI] [PubMed] [Google Scholar]
- 16.Warnes GR. gplots: Various R programming tools for plotting data. 2011 [Google Scholar]
- 17.Prakash A, Rezai T, Krastins B, Sarracino D, Athanas M, Russo P, et al. Platform for Establishing Interlaboratory Reproducibility of Selected Reaction Monitoring-Based Mass Spectrometry Peptide Assays. J Proteome Res. 2010 doi: 10.1021/pr100821m. [DOI] [PubMed] [Google Scholar]
- 18.Lopez MF, Kuppusamy R, Sarracino DA, Prakash A, Athanas M, Krastins B, et al. Mass spectrometric discovery and selective reaction monitoring (SRM) of putative protein biomarker candidates in first trimester Trisomy 21 maternal serum. J Proteome Res. 2011;10(1):133–42. doi: 10.1021/pr100153j. [DOI] [PubMed] [Google Scholar]
- 19.Lopez MF, Sarracino DA, Prakash A, Athanas M, Krastins B, Rezai T, et al. Discrimination of ischemic and hemorrhagic strokes using a multiplexed, mass spec-based assay for serum apolipoproteins coupled to multi-marker ROC algorithm. Proteomics Clin Appl. 2012 doi: 10.1002/prca.201100041. [DOI] [PMC free article] [PubMed] [Google Scholar]
- 20.Huber R, Hummert C, Gausmann U, Pohlers D, Koczan D, Guthke R, et al. Identification of intra-group, inter-individual, and gene-specific variances in mRNA expression profiles in the rheumatoid arthritis synovial membrane. Arthritis Res Ther. 2008;10(4):R98. doi: 10.1186/ar2485. [DOI] [PMC free article] [PubMed] [Google Scholar]
- 21.Eisen MB, Spellman PT, Brown PO, Botstein D. Cluster analysis and display of genome-wide expression patterns. Proc Natl Acad Sci U S A. 1998;95(25):14863–8. doi: 10.1073/pnas.95.25.14863. [DOI] [PMC free article] [PubMed] [Google Scholar]
- 22.Marouga R, David S, Hawkins E. The development of the DIGE system: 2D fluorescence difference gel analysis technology. Anal Bioanal Chem. 2005;382(3):669–78. doi: 10.1007/s00216-005-3126-3. [DOI] [PubMed] [Google Scholar]
- 23.Tonge R, Shaw J, Middleton B, Rowlinson R, Rayner S, Young J, et al. Validation and development of fluorescence two-dimensional differential gel electrophoresis proteomics technology. Proteomics. 2001;1(3):377–96. doi: 10.1002/1615-9861(200103)1:3<377::AID-PROT377>3.0.CO;2-6. [DOI] [PubMed] [Google Scholar]
- 24.Wu J, Liu W, Bemis A, Wang E, Qiu Y, Morris EA, et al. Comparative proteomic characterization of articular cartilage tissue from normal donors and patients with osteoarthritis. Arthritis Rheum. 2007;56(11):3675–84. doi: 10.1002/art.22876. [DOI] [PubMed] [Google Scholar]
- 25.Lange V, Picotti P, Domon B, Aebersold R. Selected reaction monitoring for quantitative proteomics: a tutorial. Mol Syst Biol. 2008;4:222. doi: 10.1038/msb.2008.61. [DOI] [PMC free article] [PubMed] [Google Scholar]
- 26.Lohmander LS, Englund PM, Dahl LL, Roos EM. The long-term consequence of anterior cruciate ligament and meniscus injuries: osteoarthritis. Am J Sports Med. 2007;35(10):1756–69. doi: 10.1177/0363546507307396. [DOI] [PubMed] [Google Scholar]
- 27.Pelletier JP, Martel-Pelletier J, Abramson SB. Osteoarthritis, an inflammatory disease: potential implication for the selection of new therapeutic targets. Arthritis Rheum. 2001;44(6):1237–47. doi: 10.1002/1529-0131(200106)44:6<1237::AID-ART214>3.0.CO;2-F. [DOI] [PubMed] [Google Scholar]
- 28.Sellam J, Berenbaum F. The role of synovitis in pathophysiology and clinical symptoms of osteoarthritis. Nat Rev Rheumatol. 2010;6(11):625–35. doi: 10.1038/nrrheum.2010.159. [DOI] [PubMed] [Google Scholar]
- 29.Pearle AD, Scanzello CR, George S, Mandl LA, DiCarlo EF, Peterson M, et al. Elevated high-sensitivity C-reactive protein levels are associated with local inflammatory findings in patients with osteoarthritis. Osteoarthritis Cartilage. 2007;15(5):516–23. doi: 10.1016/j.joca.2006.10.010. [DOI] [PubMed] [Google Scholar]
- 30.Smith MD, Triantafillou S, Parker A, Youssef PP, Coleman M. Synovial membrane inflammation and cytokine production in patients with early osteoarthritis. J Rheumatol. 1997;24(2):365–71. [PubMed] [Google Scholar]
- 31.Scanzello CR, McKeon B, Swaim BH, DiCarlo E, Asomugha EU, Kanda V, et al. Synovial inflammation in patients undergoing arthroscopic meniscectomy: molecular characterization and relationship to symptoms. Arthritis Rheum. 2011;63(2):391–400. doi: 10.1002/art.30137. [DOI] [PMC free article] [PubMed] [Google Scholar]
- 32.Scanzello CR, Plaas A, Crow MK. Innate immune system activation in osteoarthritis: is osteoarthritis a chronic wound? Curr Opin Rheumatol. 2008;20(5):565–72. doi: 10.1097/BOR.0b013e32830aba34. [DOI] [PubMed] [Google Scholar]
- 33.So AK, Varisco PA, Kemkes-Matthes B, Herkenne-Morard C, Chobaz-Peclat V, Gerster JC, et al. Arthritis is linked to local and systemic activation of coagulation and fibrinolysis pathways. J Thromb Haemost. 2003;1(12):2510–5. doi: 10.1111/j.1538-7836.2003.00462.x. [DOI] [PubMed] [Google Scholar]
- 34.Sanchez-Pernaute O, Largo R, Calvo E, Alvarez-Soria MA, Egido J, Herrero-Beaumont G. A fibrin based model for rheumatoid synovitis. Ann Rheum Dis. 2003;62(12):1135–8. doi: 10.1136/ard.2003.011767. [DOI] [PMC free article] [PubMed] [Google Scholar]
- 35.Busso N, Hamilton JA. Extravascular coagulation and the plasminogen activator/plasmin system in rheumatoid arthritis. Arthritis Rheum. 2002;46(9):2268–79. doi: 10.1002/art.10498. [DOI] [PubMed] [Google Scholar]
- 36.Sinz A, Bantscheff M, Mikkat S, Ringel B, Drynda S, Kekow J, et al. Mass spectrometric proteome analyses of synovial fluids and plasmas from patients suffering from rheumatoid arthritis and comparison to reactive arthritis or osteoarthritis. Electrophoresis. 2002;23(19):3445–56. doi: 10.1002/1522-2683(200210)23:19<3445::AID-ELPS3445>3.0.CO;2-J. [DOI] [PubMed] [Google Scholar]
- 37.Kummer JA, Abbink JJ, de Boer JP, Roem D, Nieuwenhuys EJ, Kamp AM, et al. Analysis of intraarticular fibrinolytic pathways in patients with inflammatory and noninflammatory joint diseases. Arthritis Rheum. 1992;35(8):884–93. doi: 10.1002/art.1780350806. [DOI] [PubMed] [Google Scholar]
- 38.Sohn DH, Sokolove J, Sharpe O, Erhart JC, Chandra PE, Lahey LJ, et al. Plasma proteins present in osteoarthritic synovial fluid can stimulate cytokine production via Toll-like receptor 4. Arthritis Res Ther. 2012;14(1):R7. doi: 10.1186/ar3555. [DOI] [PMC free article] [PubMed] [Google Scholar]
- 39.Yamagiwa H, Sarkar G, Charlesworth MC, McCormick DJ, Bolander ME. Two-dimensional gel electrophoresis of synovial fluid: method for detecting candidate protein markers for osteoarthritis. J Orthop Sci. 2003;8(4):482–90. doi: 10.1007/s00776-003-0657-3. [DOI] [PubMed] [Google Scholar]
- 40.Kamphorst JJ, van der Heijden R, DeGroot J, Lafeber FP, Reijmers TH, van El B, et al. Profiling of endogenous peptides in human synovial fluid by NanoLC-MS: method validation and peptide identification. J Proteome Res. 2007;6(11):4388–96. doi: 10.1021/pr0704534. [DOI] [PubMed] [Google Scholar]
- 41.Mateos J, Lourido L, Fernandez-Puente P, Calamia V, Fernandez-Lopez C, Oreiro N, et al. Differential protein profiling of synovial fluid from rheumatoid arthritis and osteoarthritis patients using LC-MALDI TOF/TOF. J Proteomics. 2012 doi: 10.1016/j.jprot.2011.12.042. [DOI] [PubMed] [Google Scholar]
- 42.Pan S, Aebersold R, Chen R, Rush J, Goodlett DR, McIntosh MW, et al. Mass spectrometry based targeted protein quantification: methods and applications. J Proteome Res. 2009;8(2):787–97. doi: 10.1021/pr800538n. [DOI] [PMC free article] [PubMed] [Google Scholar]
- 43.Anderson L, Hunter CL. Quantitative mass spectrometric multiple reaction monitoring assays for major plasma proteins. Mol Cell Proteomics. 2006;5(4):573–88. doi: 10.1074/mcp.M500331-MCP200. [DOI] [PubMed] [Google Scholar]
- 44.Addona TA, Abbatiello SE, Schilling B, Skates SJ, Mani DR, Bunk DM, et al. Multi-site assessment of the precision and reproducibility of multiple reaction monitoring-based measurements of proteins in plasma. Nat Biotechnol. 2009;27(7):633–41. doi: 10.1038/nbt.1546. [DOI] [PMC free article] [PubMed] [Google Scholar]
- 45.Greenbaum D, Colangelo C, Williams K, Gerstein M. Comparing protein abundance and mRNA expression levels on a genomic scale. Genome Biol. 2003;4(9):117. doi: 10.1186/gb-2003-4-9-117. [DOI] [PMC free article] [PubMed] [Google Scholar]
- 46.Pan S, Chen R, Brand RE, Hawley S, Tamura Y, Gafken PR, et al. Multiplex targeted proteomic assay for biomarker detection in plasma: a pancreatic cancer biomarker case study. J Proteome Res. 2012;11(3):1937–48. doi: 10.1021/pr201117w. [DOI] [PMC free article] [PubMed] [Google Scholar]
- 47.Umei H, Yamagishi SI, Imaizumi T. Positive association of serum levels of pigment epithelium-derived factor with high-sensitivity C-reactive protein in apparently healthy unmedicated subjects. J Int Med Res. 2010;38(2):443–8. doi: 10.1177/147323001003800207. [DOI] [PubMed] [Google Scholar]
- 48.Altman R, Asch E, Bloch D, Bole G, Borenstein D, Brandt K, et al. Development of criteria for the classification and reporting of osteoarthritis. Classification of osteoarthritis of the knee. Diagnostic and Therapeutic Criteria Committee of the American Rheumatism Association. Arthritis Rheum. 1986;29(8):1039–49. doi: 10.1002/art.1780290816. [DOI] [PubMed] [Google Scholar]
Associated Data
This section collects any data citations, data availability statements, or supplementary materials included in this article.