Figure 3.
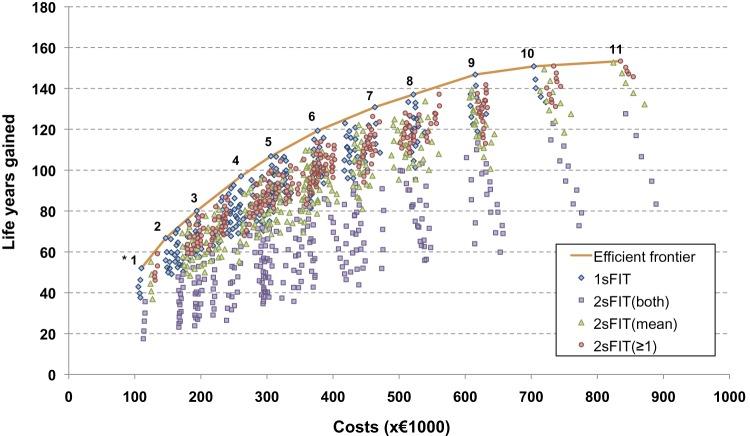
Costs and life years gained (LYG) compared with no screening per 1000 individuals in 2005 (start of the programme), for one-sample and two-sample faecal immunochemical test (FIT) screening at different cut-off values. The data represent all simulated screening strategies, which include various sampling strategies, cut-off levels, screening age ranges and intervals. *The numbers of the strategies on the efficient frontier correspond to the cost-efficient strategies presented in table 3. 1sFIT, one-sample FIT; 2sFIT (both), two-sample FIT, referral to colonoscopy restricted to subjects with both samples positive; 2sFIT(mean), two-sample FIT, referral to colonoscopy restricted to subjects for whom the mean of both samples is positive; 2sFIT(≥1), two-sample FIT, referral to colonoscopy of all subjects with at least one sample positive. The most efficient strategies, ie, those strategies that for a given amount of costs yield the largest number of life-years saved, are connected by the efficient frontier. Strategies with the least intensive screening schedule (ie, small age range, and long screening interval) are located at the bottom left of the graph, whereas strategies with the most intensive screening schedule (ie, large age range and short screening interval) are located at the top right of the graph. The screening interventions were modelled from the year 2005, all individuals were invited for screening until they reached the end age for that particular screening strategy, and healthcare costs for each individual were calculated until death. Costs and LYG were discounted at an annual rate of 3%.

