

Abstract
Cell isolation via antibody-targeted magnetic beads is a powerful tool for research and clinical applications, most recently for isolating circulating tumor cells (CTCs). Nonetheless fundamental features of the cell-bead interface are still unknown. Here we apply a clinically-relevant antibody against the cancer target HER2 (ERBB2) for magnetic cell isolation. We investigate how many target proteins per cell are sufficient for a cell to be isolated. To understand the importance of primary antibody affinity, we compared a series of point mutants with known affinities and show that even starting with sub-nanomolar affinity, improving antibody affinity improved cell isolation. To test the importance of the connection between the primary antibody and the magnetic bead, we compared bridging the antibody to the beads with Protein L, secondary antibody or streptavidin: the high stability streptavidin-biotin linkage improved sensitivity by an order of magnitude. Cytoskeletal polymerization did not have a major effect on cell isolation, but isolation was inhibited by cholesterol depletion and enhanced by cholesterol loading of cells. Analyzing a panel of human cancer cell-lines spanning a wide range of expression showed that the standard approach could only isolate the highest expressing cells. However, our optimization of cholesterol level, primary antibody affinity, and antibody-bead linkage allowed efficient and specific isolation of cells expressing low levels of HER2 or EpCAM. These insights should guide future approaches to cell isolation, either magnetically or using other means, and extend the range of cellular antigens and biomarkers that can be targeted for isolation in cancer research and diagnosis.
Keywords: CTC, metastasis, metastatic, MACS, tumor stem cell
Introduction
The ability to isolate specific cells from complex samples has been central to many areas of human biology, including immunology and stem cell biology (1). Cell isolation was previously done principally in the flow cytometer, but magnetic separation has steadily grown in importance as a result of its high throughput, ease, low cost and reduced shear stress on the cells (2). Cells are typically coated with an antibody to a specific cellular protein and linked via a secondary reagent to a magnetic bead. Application of a magnetic field then allows cells bound to the magnetic bead to be enriched or depleted from the sample, with enrichment up to 10,000-fold and sorting from 1011 cells (1).
Magnetic sorting has also been applied in the clinic for assisted reproduction (3), enriching hematopoietic stem cells for bone marrow transplant (4), and isolating cells for cancer immunotherapy (5). However, cell sorting has gained most attention recently because of the renaissance in our understanding of circulating tumor cells (CTCs) in the bloodstream (6). CTCs can be present well before establishment of metastasis and even at the premalignant stage (7). Isolating CTCs provides a powerful new approach for tumor diagnosis, for monitoring and tailoring therapy, and for understanding the evolution and signaling of tumors (6). The immunomagnetic isolation method CellSearch has gained FDA approval for isolation of CTCs in breast, colorectal and prostate cancer (6). Once cells have been isolated, the CTCs may then be analyzed with a battery of microscopic, proteomic and genetic methods to understand their origin and behavior (6;8).
The role of the buffer and temperature for enrichment of CTCs has been carefully analyzed (9) but, despite the importance and widespread use of magnetic isolation, many other fundamental questions have still not been clearly answered. In particular, what is the minimum number of copies of a target antigen that need to be present on a cell to allow magnetic isolation? Some proteins are present at high numbers per cell, e.g. ~47,000 CD4 molecules on a helper T cell (10), but receptors for growth factors and cytokines are functionally important at <100 copies per cell (11). These low abundance molecules are within the reach of detection by Western blot and may just allow cell isolation by FACS, but are out of the range of magnetic isolation. Reducing the dependence of cell recovery on antigen expression level has been identified as major challenge for the field (12).
In this paper we used an antibody to HER2 to address key issues in cell separation. HER2 (also known as ErbB2 or Neu) is a tyrosine kinase which forms heterodimers with Epidermal Growth Factor Receptor (EGFR), HER3 or HER4 to promote cell division and is frequently overexpressed in cancer (13). Targeting of HER2 with the humanized antibody trastuzumab (marketed as Herceptin) has improved survival in metastatic breast cancer, and is also used for diagnosis (13). HER2 levels in CTCs have prognostic importance (14). CTCs are most commonly isolated using antibodies against Epithelial Cell Adhesion Molecule (EpCAM) and we also test cell isolation based on EpCAM. However, EpCAM may be down-regulated on CTCs, particularly on the circulating tumor stem cell subset which is important in metastatic development (15), and so understanding of antigen detection limits is especially important (16;17).
We use magnetic sorting on human cancer cell-lines to quantitate how much anti-HER2 antibody must bind to enable cancer cell isolation and the importance for cell isolation of primary antibody affinity, antibody linkage to the bead, and factors affecting the target cell. We then harness this understanding to investigate improving the magnetic isolation of cells expressing low levels of HER2 or EpCAM.
Materials and Methods
Culture of cell-lines
MDA-MB-231, MDA-MB-453 and MDA-MB-468 were from ATCC, where cell-lines are validated using short tandem repeat profiling. A431, BT474 and MCF-7 were from Cancer Research UK, Lincoln’s Inn Fields (CR-UK), validated using short tandem repeat profiling. LBL 721.221 is a human B lymphoblastoid cell-line, a kind gift of Tim Elliott (University of Southampton), verified by bright-field microscopy and flow cytometry testing for CD45 and EpCAM expression.
All cells were thereafter passaged for fewer than 6 months. Cell-lines were grown in DMEM with 10% fetal calf serum (FCS), 50 U/ml penicillin and 50 μg/ml streptomycin. Insulin (Sigma) was added to BT474 cells at 5 μg/ml.
Antibody constructs
hu4D5 Fragment antigen-binding (Fab) was expressed with acceptor peptide (AP) tags for enzymatic biotinylation at the C-termini of the light and heavy chains, to generate Fab0.35 (Fabs named after their Kd in nM) (18). Cloning of anti-HER2 Fabs with varying affinity, expression and biotinylation, along with anti-EpCAM IgG, are described in Supplementary Methods.
Immunomagnetic isolation
BT474 cells were resuspended at 2.5 × 10⁶ cells/ml in DMEM with 1% FCS, 50 U/ml penicillin, and 50 μg/ml streptomycin (D1). 100 μl of cells were used for each condition. For the titration assays, the indicated Fab was added to the cells in triplicate and incubated at 25°C for 10 min. Cells were then spun and resuspended in 0.5 ml D1 and added to 25 μl Dynabeads® Biotin Binder (2.8 μm diameter superparamagnetic polystyrene beads coupled to recombinant streptavidin, 4 × 10⁸ beads/ml, Life Technologies) that had previously been washed twice with PBS and once with D1. After incubation in a 1.5 ml microcentrifuge tube at 25°C for 30 min with end-over-end rotation (Stuart Equipment), 100 μl of the cell-bead mixture was pipetted out for counting. The tube with the remaining cells was placed on a magnet (MagRack 6, GE Healthcare) and the unbound cells after 2 min were pipetted out, for counting of flowthrough cells. The cells bound to the magnetic beads were washed once with 100 μl D1 and resuspended in 100 μl D1. Cells in the bead-cell mixture and recovered cells were counted on a Coulter Counter (Casy® Model TT, Innovatis) using a 150 μm measuring capillary, 400 μl sample volume, 200× dilution factor and evaluation cursor of 7.5-50 μm. % Recovery was calculated as a 100×(number of cells recovered/ cells in the original cell-bead mixture).
For testing different linkages to the anti-HER2 primary antibody, 25 μl Dynabeads® Biotin Binder were coated with 3 μg biotinylated goat anti-human kappa chain (Thermo Scientific) or 3 μg biotinylated Protein L (Thermo Scientific) in 10 μL PBS for 10 min at 25°C before washing twice with PBS and once with D1. The beads were then added to 250,000 BT474 cells treated with varying concentrations of unbiotinylated Fab0.11 in triplicate. After incubation in a 1.5 ml microcentrifuge tube at 25°C for 30 min with end-over-end rotation, the cells were processed in the same way as described above.
Flow cytometry
To quantitate the number of Fab bound per cell at different concentrations, BT474 cells were harvested by trypsinizing and washed once in D1 before resuspending in D1 at 2.5 × 10⁶ cells/ml. 50 μl per condition was incubated with 0 – 10 μg/ml monobiotinylated Fab0.35 (for Table 1) or monobiotinylated Fab0.11 (for Supplementary Fig. 2) in D1 for 10 min at 25°C. Cells were then resuspended in 50 μl PBS with 1% BSA, 0.1% NaN3 (FACS-A). 50 μL of 0.5 μM monovalent streptavidin conjugated to AlexaFluor488 (mSA-488) in FACS-A was added and incubated for 15 min on ice. After washing twice with 100 μl FACS-A, cells were resuspended in 0.4 ml FACS-A on ice and analyzed on a FACScalibur flow cytometer with CellQuest Pro version 5.2.1 (Becton Dickinson). Quantitation was performed with Quantum AlexaFluor488 beads (details in Supporting Methods).
Table 1.
Relationship between antibody concentration and number of antibodies bound per cell. The number of anti-HER2 Fab binding sites per cell as Fab0.35 was titrated from 0 to 10 μg/ml was determined from flow cytometry on BT474, by calibration with beads bearing known numbers of AlexaFluor488 per particle.
|
[Fab0.35]
(μg/ml) |
10 | 1 | 0.1 | 0.01 | 0.001 | 0 |
|
Fab bound
per cell (mean ± 1 s.d., n = 3) |
710,000 ± 14,000 |
284,000 ± 9,100 |
26,500 ± 2,660 |
3,810 ± 136 |
330 ± 220 |
0 |
To quantitate the number of Fab binding to the different cell-types, cells were washed once in D1 before resuspending in D1 at 2.5 × 10⁶ cells/ml. Cells in 50 μl were incubated with 10 μg/ml monobiotinylated Fab0.35 in D1 for 10 min at 25°C. Excess Fab was removed by centrifugation. Cells were labeled with mSA-488 as above.
Spiking and recovery from blood
Cells from culture were harvested by trypsinizing, washed once with PBS with 1% FCS (PBS-1) and resuspended at 106 cells/ml in PBS-1. Carboxyfluorescein succinimidyl ester (CFSE, Life Technologies) was used to label cells according to the manufacturer’s protocol. 100,000 CFSE-labeled cells were spiked in triplicate into 1 ml of rabbit blood (in Alsever’s Solution, TCS Biosciences). Red blood cells were removed by incubating the whole-blood sample with lysis buffer (154 mM NH4Cl, 10 mM KHCO3, 0.1 mM EDTA pH 7.2) at a ratio of 25 ml lysis buffer per 1 ml blood, and incubating at room temperature for 5 min. Cells were spun down and washed once with 1 ml D1. Cells were resuspended in 100 μl D1 and processed as described above for the enhanced or standard beading conditions. The recovered cells were counted and imaged for CFSE on a hemocytometer under the DeltaVision microscope.
Recovery from human blood was performed in the same way, except 250,000 CFSE-labeled cells were spiked in duplicate into 1 ml human blood from a healthy donor. The protocol and the use of a human blood sample were approved by the University of Oxford Central University Research Ethics Committee (CUREC). After immunoisolation, cells were washed with PBS and then fixed in 100 μl PBS with 3% formaldehyde for 10 min at 25°C. Cells were washed with PBS and labeled with 100 μL/sample of 1:20 goat anti-human CD45-PE (Life Technology) for 10 min at 25°C. Excess antibody was removed by placing samples on a magnet. The cells were washed twice with PBS and resuspended in 30 μl PBS before imaging.
As a control for CD45 staining, human blood was incubated with lysis buffer and washed as above, but was then left on ice instead of beading. Exactly as for the spiked samples, cells were fixed, stained with CD-45-PE, and imaged.
Microscopy
BT474 cells on a glass coverslip were washed once with 0.5 ml PBS containing 5 mM MgCl2 (PBS-Mg). Cells were treated with 100 μl 50 μg/ml of the Fab of the indicated affinity in PBS-Mg with 1% BSA for 10 min at 4°C. After washing the cells thrice with 0.4 ml PBS-Mg, core streptavidin-AlexaFluor488 at 27 nM in PBS-Mg with 1% BSA was added for 10 min at 4°C. Cells were washed thrice with PBS-Mg and imaged live by fluorescent microscopy. For pre-blocking HER2, cells were incubated with 100 μl 10 μg/ml Herceptin (a kind gift from Genentech, dialyzed into PBS) in PBS-Mg with 1% BSA for 10 min at 4°C, and washed thrice with PBS-Mg before adding the Fab.
Results
Antibody beading strategy
Our approach was based on the Fab hu4D5, which binds with high affinity (Kd 0.35 nM) (18) to the extracellular domain of HER2 (19). AP tags were genetically fused to the C-terminus of the light and heavy chains to give Fab0.35 (Fig. 1A). Incubation with biotin ligase allowed site-specific biotinylation of each AP tag, to give the biotinylated Fab fragment, termed Fab0.35 (Fig. 1A). This biotinylation enabled subsequent binding by streptavidin, one of the strongest non-covalent interactions in nature (Kd 4 × 10⁻¹⁴ M, off-rate at 37 °C ~ 4 hr), with an on-rate nearly at the diffusion limit (~107 M−1s−1) (20). For magnetic isolation, cells were incubated with antibody and then streptavidin-coated magnetic particles (2.8 μm diameter Dynabeads) at a ratio of 40 beads per cell were added. Applying a magnetic field attracted cells bound to beads, so cells without beads could be washed away and the bead-bound cells were isolated (Fig. 1B).
Figure 1.

Dependence of cell isolation on antibody concentration. A, Cartoon of isolation approach. The juxtamembrane extracellular region of HER2 is bound by humanized anti-HER2 4D5 Fab (cartoon based on PDB 1N8Z), bearing AP tags at the C-terminus of each chain for site-specific biotinylation to target streptavidin-magnetic beads. B, Brightfield microscopy of BT474 cells during isolation procedure. Left panel: Initial incubation of cells with streptavidin-magnetic beads after addition of 0.1 μg/ml Fab0.35. Center panel: flowthrough of cells not attracted to the magnet. Right panel: cells recovered after magnetic separation. Scale-bar: 20 μm. C, Dependence of cell recovery on Fab concentration. BT474 were incubated with the indicated concentration of Fab0.35, before magnetic isolation and quantification of recovered cells, with 100% representing the number of input cells (mean of triplicate ± 1 s.d.). D, Flow cytometry from BT474 stained with the indicated concentration of monobiotinylated Fab0.35, before detection with monovalent streptavidin (mSA-488).
Thousands of antibody molecules per cell were required to enable efficient isolation
BT474 is a human breast cancer cell-line which expresses high levels of HER2. We used BT474 incubated with different levels of anti-HER2 as a surrogate for cells bearing different levels of HER2, so that the experiments could be performed with only one variable (Fab concentration), rather than the many variables present if different cell-types were compared, e.g. cell size, plasma membrane roughness, membrane fluidity, and surface glycosylation.
When Fab0.35 was added at saturating concentrations (≥ 1 μg/ml), 70-80% of BT474 cells were isolated (Fig. 1C). As a negative control, with no Fab added, there was almost no recovery of cells (Fig. 1C), indicating low non-specific binding of the streptavidin-magnetic particles. There was a sharp drop in cell recovery between 0.1 and 0.01 μg/ml Fab (Fig. 1C), consistent with the necessity for a minimum number of surface antigens to enable cells to be isolated by magnetic separation.
To understand this limit, we generated Fab0.35 with biotinylation only on the heavy chain (Fa0.35b-HAPb, Supplementary Fig. 1). This approach enabled a 1:1 ratio of Fab to the monovalent streptavidin (21) detection reagent (mSA-488) and so avoided underestimating Fab numbers through multivalency of core streptavidin or bivalent secondary antibodies. We titrated Fab0.35-HAPb on BT474 and added excess mSA-488, before analysis by flow cytometry (Fig. 1D). By calibrating with microspheres containing known numbers of dye molecules, we quantitated the number of Fab bound per cell after labeling with Fab at different concentrations (Table 1) (22). Comparing these Fab levels to the efficiency of cell isolation shows that 26,500 receptors were required for efficient (> 50%) recovery (Fig. 1C and Table 1). Cells expressing fewer than 4,000 receptors had a low probability (~10%) of being isolated (Fig. 1C and Table 1).
Immunomagnetic isolation was highly dependent on antibody affinity
Beading efficiency has previously been compared using different antibodies (23) but independent antibodies can have many variables apart from binding affinity, including the location on the target antigen where the antibody binds and the antibody isotype. It is rare to find a system where binding strength is the only major change in a series of antibodies. This system exists for hu4D5, where single-residue point mutants have been characterized for affinity, off-rate and on-rate (18;24) (Fig. 2A) and the affinity ranges over two orders of magnitude.
Figure 2.

Dependence of cell isolation on antibody affinity. A, Fab mutants tested spanning a range of affinities. Crystal structure of the HER2 extracellular domain bound to hu4D5 Fab from PDB 1N8Z. The inset shows the binding interface, with residues subject to mutation in spacefill. B, SDS-PAGE of each Fab variant (named after its Kd in nM) without reducing agent, stained with Coomassie. C, Testing biotinylation of both chains of each Fab variant, by SDS-PAGE with reducing agent and Coomassie staining. Heavy and light chains were uniformly shifted by addition of streptavidin. D, Testing the function of Fab variants by microscopy. BT474 were incubated with the indicated Fab variants or with a “No Fab” control, and labeled with streptavidin-AlexaFluor488 before fluorescent microscopy. Streptavidin staining is shown on top and the brightfield image below. Scale-bar: 30 μm. In the bottom two panels, as negative control for non-specific binding, cells were pre-blocked with anti-HER2 IgG. E, BT474 were labeled with the indicated concentrations of each Fab variant and cell recovery after magnetic isolation is shown (mean of triplicate ± 1 s.d.).
These mutants were named according to their Kd in nM (e.g. the original is Fab0.35). Protein concentration and uniformity were confirmed by SDS-PAGE (Fig. 2B). We confirmed that the antibodies were completely biotinylated using a gel-shift with streptavidin (Fig. 2C).
Fluorescence microscopy confirmed that the mutations did not cause binding to sites other than HER2: the different Fabs all bound to cells expressing HER2, but cell labeling was abolished if HER2 was pre-blocked with anti-HER2 IgG (Fig. 2D). Affinities from 0.11 nM to 2.7 nM gave strong cell staining but staining with 55 nM affinity antibody was weakly detected (Fig. 2D).
We then compared the affinity series for immunomagnetic sorting on BT474. Again we used varying antibody concentration as a well-controlled proxy for cells expressing different numbers of target antigens. With 55 nM affinity, only at the highest antibody concentration of 10 μg/ml was it possible to isolate cells (Fig. 2E). Increasing the original Fab affinity of 0.35 nM to 0.11 nM had a major effect, allowing substantial recovery at 0.01 μg/ml antibody concentration (Fig. 2E, P <0.001, n=3, two-tailed unpaired t-test). Thus even though Fab0.35 has an unusually high monovalent binding affinity among antibodies (25), engineered by molecular modeling (26), an improvement in affinity had a major effect on immunomagnetic isolation. The improved isolation was not a result of more Fab0.11 binding to the cells, since similar numbers of Fab0.11 and Fab0.35 bound to cells at each concentration, comparing Table 1 with Supplementary Fig. 2B.
Recovery closely depended on how primary antibody was linked to the magnetic particle
It was important to determine whether the stability of the linkage between the primary antibody and the magnetic particle was also important for immunomagnetic isolation. We compared three different types of linkages between the cell and the magnetic bead (Fig 3A). In each case we kept the same affinity primary antibody and the same streptavidin magnetic beads. For the first condition, we tested direct biotin-streptavidin linkage: cells were labeled with biotinylated Fab0.11 followed by streptavidin-coated magnetic particles. We then tested secondary antibody recognition of the primary antibody on cells, as is widely used: we labeled cells with non-biotinylated Fab0.11, followed by biotinylated anti-human secondary antibody coated onto streptavidin-beads (Fig. 3A). For the third condition, we used biotinylated Protein L to bind to non-biotinylated Fab0.11 (Fig. 3A). Protein L is an immunoglobulin-binding protein, which binds well to humanized Fabs, unlike the better known Protein A and Protein G (27).
Figure 3.

The importance of linkage between the primary antibody and the magnetic particle for cell recovery. A, Schematic of different linkages tested: direct biotin-streptavidin linkage with biotinylated Fab (left panel), biotinylated secondary antibody binding non-biotinylated Fab (center panel), or biotinylated Protein L binding non-biotinylated Fab (right panel), in each case linked to the same streptavidin-magnetic particles. B, Efficiency of cell isolation using different linkages. BT474 were labeled with indicated concentrations of Fab0.11 and cell recoveries using the different linkages to the magnetic particle are shown (mean of triplicate ± 1 s.d.).
Direct biotin-streptavidin linkage showed the best profile of cell recovery, even at saturating antibody concentrations (Fig. 3B). Compared to direct linkage, at 0.1 μg/ml Fab, cell recovery was ~20% less with secondary antibody (Fig. 3B, P < 0.05, n = 3, unpaired t-test). Compared to secondary antibody linkage, at 0.1 μg/ml Fab, the recovery was ~40% less with Protein L linkage (Fig. 3B, P < 0.001, n = 3, unpaired t-test). >40% recovery required 1 μg/ml Fab for Protein L, 0.1 μg/ml Fab for secondary antibody, and 0.01 μg/ml for direct biotin-streptavidin linkage (Fig. 3B). Thus the nature of the linkage between the magnetic bead and the primary antibody had a dramatic effect on recovery of cells which had low levels of antibody bound.
We also established whether it was important that the Fab had two biotins attached. Sensitivity of isolation was broadly similar for Fabs with one or two biotins, but Fabs with two biotin tags gave enhanced isolation at low antibody concentrations (Supplementary Fig. 3B, P < 0.001, n = 3, unpaired t-test at conc = 0.01 μg/ml). Comparing Fab0.35 with two enzymatically-attached biotin tags or multiple chemically-attached biotin tags showed comparable sensitivity in BT474 isolation (Supplementary Fig. 4).
Cellular parameters determining immunomagnetic recovery
Whether a cell binds to the magnetic bead depends on the number of antibodies present on the cell (Table 1 and Fig. 1C) but it is likely that other factors have an important role: the initial weak interaction between the bead and the cell will be consolidated as new receptors diffuse to this interface. We used 0.01 μg/ml Fab0.11, which only achieved partial recovery of BT474 (Fig. 2E), such that small changes in the cell-bead interaction could have a big effect on cell recovery.
According to the picket-fence model, actin forms a network below the plasma membrane regulating surface protein dynamics, (28). We attempted to disrupt this network using cytochalasin D: this drug increased recovery but its effects were not statistically significant (Fig. 4A, P = 0.06, n = 3, unpaired t-test). We also examined the effect of microtubule depolymerization but this did not change cell isolation (Fig. 4B, P = 0.4, n = 3, unpaired t-test)
Figure 4.
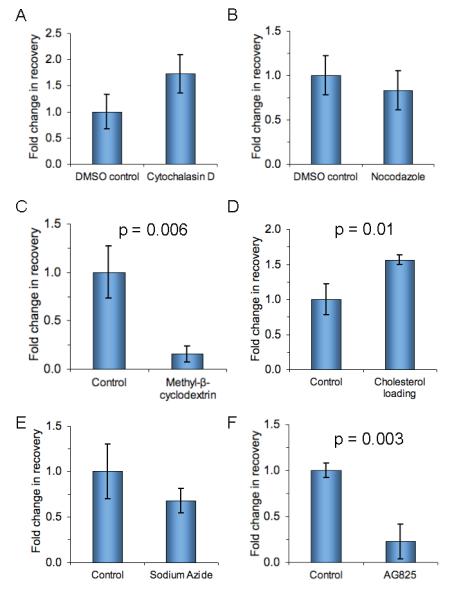
Effect of modulating the target cell on efficiency of cell isolation. BT474 were incubated with 0.01 μg/ml Fab0.11 and isolated with streptavidin-magnetic beads. The fold-change in recovery is calculated by normalizing to the recovery of control cells with no inhibitor (mean of triplicate ± 1 s.d.). A, cytochalasin D to inhibit polymerization of actin. B, nocodazole to inhibit polymerization of microtubules. C, methyl-β-cyclodextrin to deplete cholesterol. D, loading cells with cholesterol. E, sodium azide to inhibit metabolic activity. F, AG825 to inhibit HER2 kinase.
Cholesterol is an important regulator of membrane fluidity, from its effect upon lipid ordering, direct interaction with surface proteins, and through formation of membrane nanodomains or lipid rafts (29). We used methyl-β-cyclodextrin to deplete cholesterol from the plasma membrane and saw a dramatic decline in cell recovery (Fig. 4C, P < 0.01, n = 3, unpaired t-test). Since we were keen to enhance cell isolation, we tested the converse and indeed loading cells with cholesterol for 1 hr (by adding cholesterol bound to a water-soluble chelator) improved isolation by more than 50% (Fig. 4D, P < 0.05, n = 3, unpaired t-test). We tested whether this modulation of cholesterol changed how much Fab0.11 bound to cells by flow cytometry (Supplementary Fig. 5) and observed a 17% decrease (P < 0.001, n = 3, unpaired t-test) with methyl-β-cyclodextrin and a 9% increase in staining with cholesterol loading (P < 0.001, n = 3, unpaired t-test).
Trafficking of HER2 to and from the plasma membrane could also be important and so we tested the effect of inhibiting cell metabolic activity, briefly adding sodium azide but consistent with maintaining high cell viability. Sodium azide did not significantly change recovery (Fig. 4E, P =0.2, n = 3, unpaired t-test). We also evaluated a small-molecule inhibitor of HER2 tyrosine kinase, the tyrphostin AG825 (30), and found a dramatic decrease in recovery (Fig. 4F, P < 0.01, n = 3, unpaired t-test), indicating that HER2 kinase activity affects beading efficiency.
Strong bead-antibody linkage and cholesterol loading also enhanced recovery with low affinity primary antibody
To test whether these effects were restricted to the highest affinity antibodies, we also evaluated their impact using a moderate binding antibody. BT474 cells were labeled with 0.1 μg/ml Fab1.4 (Kd 1.4 nM), where secondary antibody linkage without cholesterol loading gave moderate recovery (Supplementary Fig. 6). Using direct linkage improved recovery (P <0.05, n = 2, unpaired t-test) and cholesterol loading gave a further enhancement in recovery (P <0.05, n = 2, unpaired t-test, Supplementary Fig. 6). These results indicate that optimizing how the primary antibody was coupled to the bead and loading cells with cholesterol should be beneficial for cell capture using moderate affinity antibodies, not just the highest affinity antibodies.
Optimization of recovery of low expressing cells
We assembled a panel of five human cancer cell-lines, spanning a few orders of magnitude of HER2 expression. This panel enabled us to evaluate the immunomagnetic separation protocol for different cell-types and to establish how antigen expression level across cell-lines correlated with isolation efficiency.
A representative comparison of the cell-lines’ relative HER2 levels was determined by flow cytometry after staining with Fab0.35 and then mSA-488 (Fig. 5A). This comparison showed a wide range in expression, although note that cell autofluorescence (indicated from the no primary control) was also variable (Fig. 5A). HER2 expression is very high in BT474, moderate in MDA-MB-453, and low in MCF-7 and A431. HER2 expression was not detectable in MDA-MB-468, as found previously (31). Using calibration beads, we determined the absolute number of anti-HER2 antibody binding sites on each cell-type (Table 2).
Figure 5.

Testing optimized isolation on cells with varying antigen levels. A, Evaluating HER2 expression of a panel of human cancer cell-lines by flow cytometry. Cells were stained with or without 10 μg/ml monobiotinylated Fab0.35, followed by mSA-488. B, Comparing isolation of cell-line panel using an enhanced or standard protocol. For the standard conditions, cells were incubated with 1 μg/ml non-biotinylated Fab0.35, followed by streptavidin-magnetic particles coated with biotinylated secondary antibody. For the enhanced conditions, cells were loaded with cholesterol, incubated with 1 μg/ml biotinylated Fab0.11, followed by direct linkage to the magnetic bead via streptavidin. Recovery is shown as the mean from triplicate measurements ± 1 s.d. C, Recovery of cancer cell-lines from rabbit blood using the standard or enhanced conditions. Cancer cell-lines of varying expression levels were spiked into rabbit blood, to mimic CTC isolation, and then isolated following the approaches in B (mean from triplicate measurements ± 1 s.d.). D, Testing optimized isolation with human blood. Cells with low (MCF-7 and A431) or no (MDA-MB-468) expression of HER2 were labeled with CFSE and doped into human blood. Red blood cells were lysed and recovery after magnetic beading was determined (mean from duplicate measurements ± 1 s.d.). For the standard conditions, cells were incubated with 10 μg/ml non-biotinylated Fab0.35, followed by streptavidin-magnetic particles coated with biotinylated secondary antibody. For the enhanced conditions, cells were loaded with cholesterol, incubated with 10 μg/ml biotinylated Fab0.11, followed by direct linkage to the magnetic bead via streptavidin. E, Microscopy of cells recovered from beading of human blood samples. MCF-7 (top row) and A431 (middle row), labeled with CFSE, were doped into blood and beaded using enhanced conditions. Recovered cells were analyzed by fluorescent microscopy, showing CFSE (left column), anti-CD45-PE staining (center column), and an overlay (right column) of CFSE (green), anti-CD45-PE (red) and brightfield (grayscale) images. Whole human blood (bottom row), following hypotonic lysis and without magnetic separation, was stained with anti-CD45-PE, as a positive control for CD45 staining. Scale-bar 50 μm.
Table 2.
Level of antibody binding to cell-line panel. Anti-HER2 binding sites per cell were determined by flow cytometry, with calibration against beads containing known numbers of AlexaFluor488.
| Cell-type | BT474 | MDA-MB- 453 |
MCF-7 | A431 | MDA-MB- 468 |
|---|---|---|---|---|---|
|
Fab bound
per cell (mean ± 1 s.d., n = 3) |
735,000 ± 17,000 |
112,000 ± 1,900 |
15,300 ± 160 |
12,300 ± 36 |
19 ± 27 |
Using this cell panel, we tested whether the factors we had established as important for efficient cell isolation using the high expressing BT474 would allow us to efficiently isolate tumor types not well isolated by existing approaches. For the standard conditions we used an antibody with high but not optimized affinity, Fab0.35, and secondary antibody linkage to the streptavidin-magnetic beads (Fig. 3A). For the enhanced conditions we applied the higher affinity Fab0.11, direct biotin-streptavidin linkage to the streptavidin-magnetic particles, and cholesterol loading.
Using a high antibody concentration, for high HER2-expressing BT474, both protocols gave equivalent recovery (Fig. 5B). For the MDA-MB-453 cell-line with ~7-fold lower expression than BT474, the optimized conditions gave ~20% improved recovery (Fig. 5B, P < 0.01, n = 3, unpaired t-test). The impact of the enhanced conditions increased as the HER2-expression level decreased, doubling the recovery of MCF-7 cells (Fig. 5B, P < 0.001, n = 3, unpaired t-test) and giving ~8-fold better recovery for A431 cells (Fig. 5B, P < 0.001, n = 3, unpaired t-test). There was minimal recovery of MDA-MB-468 with either protocol (Fig. 5B).
To dissect how much of this effect on recovery of different expressing cell-lines depended on cholesterol loading, connection to the primary antibody, or highest affinity primary antibody, we changed these parameters one at a time. Loading with cholesterol only enhanced recovery of A431 (P < 0.05, n = 3, Supplementary Fig. 7A). Similarly, going from Fab0.35 to Fab0.11 only enhanced recovery of A431 ( P < 0.01, n = 2, unpaired t-test, Supplementary Fig. 7B). Changing from secondary antibody linkage to direct linkage enhanced recovery of both MCF-7 (P < 0.05, n = 2, unpaired t-test) and A431 (P < 0.01, n = 2, unpaired t-test, Supplementary Fig. 7C). Therefore, all three enhancements we made to the beading procedure were beneficial for recovery of low expressing cells.
Cholesterol loading and direct linkage enhanced capture via EpCAM
CTC isolation is most frequently performed based on EpCAM expression and EpCAM levels vary in different cancer cells (6;15). To establish whether the insights on HER2 also applied to EpCAM, we tested cells with widely different EpCAM expression. A431 expressed high levels of EpCAM, whereas expression in the human breast cancer cell-line MDA-MB-231 was low based on flow cytometry (Supplementary Fig. 8A). The B cell-line 721.221 was used as a negative control with no detectable EpCAM expression (Supplementary Fig. 8A). Combining direct linkage with cholesterol loading more than doubled capture of MDA-MB-231, as well as enhancing recovery of A431 to a lesser extent (Supplementary Fig. 8B). There was minimal recovery of non-expressing 721.221 or of A431/MDA-MB-231 in the absence of primary antibody under any condition (Supplementary Fig. 8B).
Recovery of cells from blood with the enhanced immunomagnetic approach
We further tested the efficiency of the beading protocols by spiking the different cancer cell-types into rabbit blood and then trying to selectively isolate the cell-lines. The cancer cells were labeled with CFSE before spiking. After lysis of red blood cells, we carried out immunomagnetic isolation of cells based on HER2 using either standard or enhanced conditions.
Although standard and enhanced conditions isolated >70% of BT474 cells, the standard conditions gave minimal isolation of MCF-7 or A431 (Fig. 5C). However, MCF-7 and A431 were recovered efficiently from rabbit blood under enhanced conditions (Fig. 5C). This increase (MCF-7 P < 0.0001, A431 P < 0.001, n = 3, unpaired t-test) was not due to non-specific binding of beads, as no cells were recovered under enhanced conditions in the absence of Fab0.11 (Supplementary Fig. 9). Nearly every cell recovered under enhanced conditions was CFSE-positive: BT474 98.3 ± 1.6%, n = 3; MCF-7 98.9 ± 1.9%, n = 3; A431 99.2 ± 1.4%, n = 3. Therefore there was minimal binding of beads to endogenous cells in the blood.
We went on to analyze recovery from human blood. Again, recovery of MCF-7 and A431 under standard conditions was poor but both cell-lines were recovered significantly better using enhanced conditions (MCF-7 P < 0.01, A431 P < 0.01, n = 2, unpaired t-test, Fig. 5D). That the counted cells were indeed the indicated cell-lines and not endogenous cells was confirmed by the recovered cells being positive for CFSE and negative for CD45 (a surface marker common to leucocytes) (Fig. 5E).
Discussion
Here we have shown how antigen number, antibody affinity, cholesterol level and bead linkage all contribute to the ability to magnetically isolate cancer cells. To enhance recovery of cancer cells bearing low levels of tumor antigen, these results suggest that one should (i) load the cells in the sample for 1 hr with cholesterol, (ii) seek the highest affinity biotinylated antibody available, and (iii) capture the biotinylated antibody with streptavidin that is covalently bound to the solid-phase, avoiding any intermediary weak link.
Different antibodies have previously been compared for sorting tumor cells, based on EpCAM expression, but the antibody affinity was not established (23). To improve antibody-ligand affinity, there have been enormous efforts to surpass monoclonal and polyclonal antibodies (25), through ex vivo selection by phage display and ribosome display or more recently by introducing artificial reactive groups (32;33). On the other hand, improvements in antibody affinity below a threshold of 10 nM were not beneficial to targeting to tumors, as would be applied for imaging or direct killing (34). Our work here shows that, antibody affinity is central to the ability to isolate low expressing cells, with even a Fab Kd of 0.35 nM not being optimal. On this basis it is important to consider antibody affinity when designing a cell isolation experiment and it will be valuable to investigate the impact of recent antibody engineering approaches on cell isolation (35;36). For the cell to be isolated, the force between the antibodies and their ligand must exceed the shear force between the cell and the magnetic bead in the flow or in the magnetic field (12); for simply delivering a radioisotope or dye to a tumor there is minimal force favoring dissociation, so antibody stability is less crucial. One must also ensure that improvements in affinity of the antibody or immunoglobulin-like domain do not compromise the highly specific binding, efficient expression, or stable folding without oligomerization (18;26;34;36).
Consistent with the importance of primary antibody affinity, we also found that any other weak link in the chain between the target receptor and the bead would impair cell isolation. Different secondary amplification approaches have been compared for cell isolation but the effects were quantified in terms of magnetophoretic cell mobility rather than isolation of low-expressing cells (37;38). We found that having direct high stability linkage from a biotinylated antibody to streptavidin beads gave a major improvement in the isolation of cells bearing few primary antibodies. Here we focused on recombinantly generated antibodies against HER2, because of the possibility of site-specific enzymatic biotinylation and the propitious advantage of an intensively characterized affinity series. Nevertheless regular monoclonal or polyclonal antibodies are generally functional after site-specific chemical biotinylation (39) and we showed that streptavidin-based capture of chemically biotinylated primary antibodies against HER2 or EpCAM was advantageous for cell isolation. Similarly, cDNA from B cells can now rapidly be cloned into recombinant antibodies (40). In future work it may be also interesting to explore antibody-bead interactions with even greater stability than streptavidin (41-43).
We found a clear dependence of antigen number on efficiency of cell isolation. Antibody binding capacity has previously been related to the degree of movement of particle-bound cells in a magnetic field (44). The number of biotinylated molecules on the cell-surface required for binding of streptavidin-coated bead has also been determined using laser-tweezers, but the force applied in this case is different to magnetic sorting and biotin was non-specifically conjugated to surface proteins (45). By titrating in primary antibody we found that ~27,000 anti-HER2 Fab with 0.35 nM Kd allowed for efficient isolation. Many more receptors, >1,600 receptors per μm2 of cell surface, were previously required to isolate B cells using 1 nM Kd anti-CD19 antibody and magnetic beads (46).
We found that modifying cholesterol levels and HER2 signaling had a major effect on cell isolation. Cholesterol levels of cells can be increased rapidly by applying a water-soluble form of cholesterol, as we performed on human blood doped with cancer cells, and so this approach should be applicable to patient samples. It is valuable to compare the cell-bead interface with dynamic cell-cell interfaces, such as the immune synapse. Cell-bead and cell-cell synapses share the importance of initiating and then stabilizing contacts, membrane curvature and stretching, steric crowding inhibiting initial approach, force resistance of protein-protein links, and the role of receptor diffusion in stabilizing initial contacts (47). Single-particle tracking has shown that cholesterol depletion reduces HER2 mobility in the plasma membrane (29) and so would inhibit the recruitment of new HER2 to stabilize an initial cell-bead interaction; loading of cholesterol was shown to enhance receptor diffusion (29), consistent with the improved cell isolation we establish. The reduced cell isolation with the HER2 inhibitor AG825 is surprising and it will be interesting in future work to see how AG825 changes HER2 surface dynamics.
Testing a panel of HER2-expressing lines, we found that with a conventional protocol of standard antibody and secondary antibody binding, high expressing cells were efficiently captured but low expressing cells were not isolated at all. Optimizing primary antibody affinity, bead linkage and loading with cholesterol allowed these low expressing cells to be captured as efficiently as the highest expressing cells. An ideal series of anti-EpCAM antibodies having a uniform binding site but a wide range of affinities was not available, but we showed that optimizing bead linkage and loading with cholesterol similarly enhanced isolation of cells expressing low levels of EpCAM.
Many of the issues analyzed here will also apply to the range of approaches where there is antibody recognition attaching cells to a solid-phase, including microfluidic isolation with antibody-coated pillars, such as on “CTC-chips” (6;48;49) and trapping of CTCs for direct killing within the bloodstream (15;50). Since tumors are heterogeneous in antigen expression levels (16), more efficient cell capture should make the use of existing biomarkers less vulnerable to antigen down-regulation, as well as making possible the use of new lower-expressed biomarkers for specific capture of cancer cells.
Supplementary Material
Acknowledgements
We thank Dr. Michael Fairhead (University of Oxford) for expression of streptavidin variants and Professor Neil Brockdorff (University of Oxford) for his advice.
Grant Support Funding was provided by the Clarendon Fund, the Wellcome Trust and the Medical Research Council.
Financial support: J.J.-Studentship funded by the Clarendon Fund and Keble College Oxford. G.V.-Studentship funded by the Medical Research Council and Merton College Oxford. M.H.- Funded by the Wellcome Trust and Worcester College Oxford.
Footnotes
Potential Conflicts of Interest: None.
Disclosure of Potential Conflicts of Interest: No potential conflicts of interest to disclose.
Authors’ contributions Conception and Design: J. Jain, G. Veggiani and M. Howarth
Development of methodology: J. Jain and G. Veggiani
Acquisition of data: J. Jain and G. Veggiani
Analysis and interpretation of data: J. Jain, G. Veggiani and M. Howarth
Writing, review, and/or revision of the manuscript: J. Jain, G. Veggiani and M. Howarth
Study supervision: M. Howarth
References
- (1).Grutzkau A, Radbruch A. Small but mighty: how the MACS-technology based on nanosized superparamagnetic particles has helped to analyze the immune system within the last 20 years. Cytometry A. 2010 Jul;77(7):643–7. doi: 10.1002/cyto.a.20918. [DOI] [PubMed] [Google Scholar]
- (2).Thiel A, Scheffold A, Radbruch A. Immunomagnetic cell sorting--pushing the limits. Immunotechnology. 1998 Oct;4(2):89–96. doi: 10.1016/s1380-2933(98)00010-4. [DOI] [PubMed] [Google Scholar]
- (3).Said TM, Agarwal A, Zborowski M, Grunewald S, Glander HJ, Paasch U. Utility of magnetic cell separation as a molecular sperm preparation technique. J Androl. 2008 Mar;29(2):134–42. doi: 10.2164/jandrol.107.003632. [DOI] [PMC free article] [PubMed] [Google Scholar]
- (4).Powles R, Mehta J, Kulkarni S, Treleaven J, Millar B, Marsden J, et al. Allogeneic blood and bone-marrow stem-cell transplantation in haematological malignant diseases: a randomised trial. Lancet. 2000 Apr 8;355(9211):1231–7. doi: 10.1016/S0140-6736(00)02090-0. [DOI] [PubMed] [Google Scholar]
- (5).Stift A, Friedl J, Dubsky P, Bachleitner-Hofmann T, Schueller G, Zontsich T, et al. Dendritic cell-based vaccination in solid cancer. J Clin Oncol. 2003 Jan 1;21(1):135–42. doi: 10.1200/JCO.2003.02.135. [DOI] [PubMed] [Google Scholar]
- (6).Yu M, Stott S, Toner M, Maheswaran S, Haber DA. Circulating tumor cells: approaches to isolation and characterization. J Cell Biol. 2011 Feb 7;192(3):373–82. doi: 10.1083/jcb.201010021. [DOI] [PMC free article] [PubMed] [Google Scholar]
- (7).Husemann Y, Geigl JB, Schubert F, Musiani P, Meyer M, Burghart E, et al. Systemic spread is an early step in breast cancer. Cancer Cell. 2008 Jan;13(1):58–68. doi: 10.1016/j.ccr.2007.12.003. [DOI] [PubMed] [Google Scholar]
- (8).Leary RJ, Kinde I, Diehl F, Schmidt K, Clouser C, Duncan C, et al. Development of personalized tumor biomarkers using massively parallel sequencing. Sci Transl Med. 2010 Feb 24;2(20):20ra14. doi: 10.1126/scitranslmed.3000702. [DOI] [PMC free article] [PubMed] [Google Scholar]
- (9).Takao M, Takeda K. Enumeration, characterization, and collection of intact circulating tumor cells by cross contamination-free flow cytometry. Cytometry A. 2011 Feb;79(2):107–17. doi: 10.1002/cyto.a.21014. [DOI] [PubMed] [Google Scholar]
- (10).Bikoue A, Janossy G, Barnett D. Stabilised cellular immuno-fluorescence assay: CD45 expression as a calibration standard for human leukocytes. J Immunol Methods. 2002 Aug 1;266(1-2):19–32. doi: 10.1016/s0022-1759(02)00094-7. [DOI] [PubMed] [Google Scholar]
- (11).Kaplan D, Smith D. Enzymatic amplification staining for flow cytometric analysis of cell surface molecules. Cytometry. 2000 May 1;40(1):81–5. doi: 10.1002/(sici)1097-0320(20000501)40:1<81::aid-cyto11>3.0.co;2-k. [DOI] [PubMed] [Google Scholar]
- (12).Dharmasiri U, Witek MA, Adams AA, Soper SA. Microsystems for the capture of low-abundance cells. Annu Rev Anal Chem. 2010;3:409–31. doi: 10.1146/annurev.anchem.111808.073610. [DOI] [PubMed] [Google Scholar]
- (13).Capala J, Bouchelouche K. Molecular imaging of HER2-positive breast cancer: a step toward an individualized ‘image and treat’ strategy. Curr Opin Oncol. 2010 Nov;22(6):559–66. doi: 10.1097/CCO.0b013e32833f8c3a. [DOI] [PMC free article] [PubMed] [Google Scholar]
- (14).Ignatiadis M, Rothe F, Chaboteaux C, Durbecq V, Rouas G, Criscitiello C, et al. HER2-positive circulating tumor cells in breast cancer. PLoS ONE. 2011;6(1):e15624. doi: 10.1371/journal.pone.0015624. [DOI] [PMC free article] [PubMed] [Google Scholar]
- (15).Faltas B. Cornering metastases: therapeutic targeting of circulating tumor cells and stem cells. Front Oncol. 2012;2:68. doi: 10.3389/fonc.2012.00068. [DOI] [PMC free article] [PubMed] [Google Scholar]
- (16).Braun S, Hepp F, Sommer HL, Pantel K. Tumor-antigen heterogeneity of disseminated breast cancer cells: implications for immunotherapy of minimal residual disease. Int J Cancer. 1999 Feb 19;84(1):1–5. doi: 10.1002/(sici)1097-0215(19990219)84:1<1::aid-ijc1>3.0.co;2-a. [DOI] [PubMed] [Google Scholar]
- (17).Thurm H, Ebel S, Kentenich C, Hemsen A, Riethdorf S, Coith C, et al. Rare expression of epithelial cell adhesion molecule on residual micrometastatic breast cancer cells after adjuvant chemotherapy. Clin Cancer Res. 2003 Jul;9(7):2598–604. [PubMed] [Google Scholar]
- (18).Gerstner RB, Carter P, Lowman HB. Sequence plasticity in the antigen-binding site of a therapeutic anti-HER2 antibody. J Mol Biol. 2002 Aug 30;321(5):851–62. doi: 10.1016/s0022-2836(02)00677-0. [DOI] [PubMed] [Google Scholar]
- (19).Cho HS, Mason K, Ramyar KX, Stanley AM, Gabelli SB, Denney DW, Jr., et al. Structure of the extracellular region of HER2 alone and in complex with the Herceptin Fab. Nature. 2003 Feb 13;421(6924):756–60. doi: 10.1038/nature01392. [DOI] [PubMed] [Google Scholar]
- (20).Green NM. Avidin and streptavidin. Methods Enzymol. 1990;184:51–67. doi: 10.1016/0076-6879(90)84259-j. [DOI] [PubMed] [Google Scholar]
- (21).Howarth M, Chinnapen DJ, Gerrow K, Dorrestein PC, Grandy MR, Kelleher NL, et al. A monovalent streptavidin with a single femtomolar biotin binding site. Nat Methods. 2006 Apr;3(4):267–73. doi: 10.1038/NMETHXXX. [DOI] [PMC free article] [PubMed] [Google Scholar]
- (22).Lenkei R, Gratama JW, Rothe G, Schmitz G, D’hautcourt JL, Arekrans A, et al. Performance of calibration standards for antigen quantitation with flow cytometry. Cytometry. 1998 Oct 1;33(2):188–96. doi: 10.1002/(sici)1097-0320(19981001)33:2<188::aid-cyto13>3.0.co;2-q. [DOI] [PubMed] [Google Scholar]
- (23).Antolovic D, Galindo L, Carstens A, Rahbari N, Buchler MW, Weitz J, et al. Heterogeneous detection of circulating tumor cells in patients with colorectal cancer by immunomagnetic enrichment using different EpCAM-specific antibodies. BMC Biotechnol. 2010;10:35. doi: 10.1186/1472-6750-10-35. [DOI] [PMC free article] [PubMed] [Google Scholar]
- (24).Kelley RF, O’Connell MP. Thermodynamic analysis of an antibody functional epitope. Biochemistry. 1993 Jul 13;32(27):6828–35. doi: 10.1021/bi00078a005. [DOI] [PubMed] [Google Scholar]
- (25).Foote J, Eisen HN. Kinetic and affinity limits on antibodies produced during immune responses. Proc Natl Acad Sci U S A. 1995 Feb 28;92(5):1254–6. doi: 10.1073/pnas.92.5.1254. [DOI] [PMC free article] [PubMed] [Google Scholar]
- (26).Carter P, Presta L, Gorman CM, Ridgway JB, Henner D, Wong WL, et al. Humanization of an anti-p185HER2 antibody for human cancer therapy. Proc Natl Acad Sci U S A. 1992 May 15;89(10):4285–9. doi: 10.1073/pnas.89.10.4285. [DOI] [PMC free article] [PubMed] [Google Scholar]
- (27).Tashiro M, Montelione GT. Structures of bacterial immunoglobulin-binding domains and their complexes with immunoglobulins. Curr Opin Struct Biol. 1995 Aug;5(4):471–81. doi: 10.1016/0959-440x(95)80031-x. [DOI] [PubMed] [Google Scholar]
- (28).Kusumi A, Nakada C, Ritchie K, Murase K, Suzuki K, Murakoshi H, et al. Paradigm shift of the plasma membrane concept from the two-dimensional continuum fluid to the partitioned fluid: high-speed single-molecule tracking of membrane molecules. Annu Rev Biophys Biomol Struct. 2005;34:351–78. doi: 10.1146/annurev.biophys.34.040204.144637. [DOI] [PubMed] [Google Scholar]
- (29).Orr G, Hu D, Ozcelik S, Opresko LK, Wiley HS, Colson SD. Cholesterol dictates the freedom of EGF receptors and HER2 in the plane of the membrane. Biophys J. 2005 Aug;89(2):1362–73. doi: 10.1529/biophysj.104.056192. [DOI] [PMC free article] [PubMed] [Google Scholar]
- (30).Osherov N, Gazit A, Gilon C, Levitzki A. Selective inhibition of the epidermal growth factor and HER2/neu receptors by tyrphostins. J Biol Chem. 1993 May 25;268(15):11134–42. [PubMed] [Google Scholar]
- (31).Kramer-Marek G, Kiesewetter DO, Capala J. Changes in HER2 expression in breast cancer xenografts after therapy can be quantified using PET and (18)F-labeled affibody molecules. J Nucl Med. 2009 Jul;50(7):1131–9. doi: 10.2967/jnumed.108.057695. [DOI] [PMC free article] [PubMed] [Google Scholar]
- (32).Chmura AJ, Orton MS, Meares CF. Antibodies with infinite affinity. Proc Natl Acad Sci U S A. 2001 Jul 17;98(15):8480–4. doi: 10.1073/pnas.151260298. [DOI] [PMC free article] [PubMed] [Google Scholar]
- (33).Holm L, Moody P, Howarth M. Electrophilic affibodies forming covalent bonds to protein targets. J Biol Chem. 2009 Nov 20;284(47):32906–13. doi: 10.1074/jbc.M109.034322. [DOI] [PMC free article] [PubMed] [Google Scholar]
- (34).Wittrup KD, Thurber GM, Schmidt MM, Rhoden JJ. Practical theoretic guidance for the design of tumor-targeting agents. Methods Enzymol. 2012;503:255–68. doi: 10.1016/B978-0-12-396962-0.00010-0. [DOI] [PMC free article] [PubMed] [Google Scholar]
- (35).Myung JH, Gajjar KA, Saric J, Eddington DT, Hong S. Dendrimer-mediated multivalent binding for the enhanced capture of tumor cells. Angew Chem Int Ed Engl. 2011 Dec 2;50(49):11769–72. doi: 10.1002/anie.201105508. [DOI] [PMC free article] [PubMed] [Google Scholar]
- (36).Tamaskovic R, Simon M, Stefan N, Schwill M, Pluckthun A. Designed ankyrin repeat proteins (DARPins) from research to therapy. Methods Enzymol. 2012;503:101–34. doi: 10.1016/B978-0-12-396962-0.00005-7. [DOI] [PubMed] [Google Scholar]
- (37).McCloskey KE, Comella K, Chalmers JJ, Margel S, Zborowski M. Mobility measurements of immunomagnetically labeled cells allow quantitation of secondary antibody binding amplification. Biotechnol Bioeng. 2001 Dec 20;75(6):642–55. doi: 10.1002/bit.10040. [DOI] [PubMed] [Google Scholar]
- (38).Chosy EJ, Nakamura M, Melnik K, Comella K, Lasky LC, Zborowski M, et al. Characterization of antibody binding to three cancer-related antigens using flow cytometry and cell tracking velocimetry. Biotechnol Bioeng. 2003 May 5;82(3):340–51. doi: 10.1002/bit.10581. [DOI] [PubMed] [Google Scholar]
- (39).Cho IH, Paek EH, Lee H, Kang JY, Kim TS, Paek SH. Site-directed biotinylation of antibodies for controlled immobilization on solid surfaces. Anal Biochem. 2007 Jun 1;365(1):14–23. doi: 10.1016/j.ab.2007.02.028. [DOI] [PubMed] [Google Scholar]
- (40).Corti D, Voss J, Gamblin SJ, Codoni G, Macagno A, Jarrossay D, et al. A neutralizing antibody selected from plasma cells that binds to group 1 and group 2 influenza A hemagglutinins. Science. 2011 Aug 12;333(6044):850–6. doi: 10.1126/science.1205669. [DOI] [PubMed] [Google Scholar]
- (41).Chivers CE, Crozat E, Chu C, Moy VT, Sherratt DJ, Howarth M. A streptavidin variant with slower biotin dissociation and increased mechanostability. Nat Methods. 2010 May;7(5):391–3. doi: 10.1038/nmeth.1450. [DOI] [PMC free article] [PubMed] [Google Scholar]
- (42).Zakeri B, Fierer JO, Celik E, Chittock EC, Schwarz-Linek U, Moy VT, et al. Peptide tag forming a rapid covalent bond to a protein, through engineering a bacterial adhesin. Proc Natl Acad Sci U S A. 2012 Feb 24; doi: 10.1073/pnas.1115485109. [DOI] [PMC free article] [PubMed] [Google Scholar]
- (43).Haun JB, Devaraj NK, Hilderbrand SA, Lee H, Weissleder R. Bioorthogonal chemistry amplifies nanoparticle binding and enhances the sensitivity of cell detection. Nat Nanotechnol. 2010 Sep;5(9):660–5. doi: 10.1038/nnano.2010.148. [DOI] [PMC free article] [PubMed] [Google Scholar]
- (44).McCloskey KE, Chalmers JJ, Zborowski M. Magnetophoretic mobilities correlate to antibody binding capacities. Cytometry. 2000 Aug 1;40(4):307–15. doi: 10.1002/1097-0320(20000801)40:4<307::aid-cyto6>3.0.co;2-h. [DOI] [PubMed] [Google Scholar]
- (45).Reichle C, Sparbier K, Muller T, Schnelle T, Walden P, Fuhr G. Combined laser tweezers and dielectric field cage for the analysis of receptor-ligand interactions on single cells. Electrophoresis. 2001 Jan;22(2):272–82. doi: 10.1002/1522-2683(200101)22:2<272::AID-ELPS272>3.0.CO;2-K. [DOI] [PubMed] [Google Scholar]
- (46).Sarda S, Pointu D, Pincet F, Henry N. Specific recognition of macroscopic objects by the cell surface: evidence for a receptor density threshold revealed by micrometric particle binding characteristics. Biophys J. 2004 May;86(5):3291–303. doi: 10.1016/S0006-3495(04)74377-5. [DOI] [PMC free article] [PubMed] [Google Scholar]
- (47).Davis DM. Assembly of the immunological synapse for T cells and NK cells. Trends Immunol. 2002 Jul;23(7):356–63. doi: 10.1016/s1471-4906(02)02243-3. [DOI] [PubMed] [Google Scholar]
- (48).Nagrath S, Sequist LV, Maheswaran S, Bell DW, Irimia D, Ulkus L, et al. Isolation of rare circulating tumour cells in cancer patients by microchip technology. Nature. 2007 Dec 20;450(7173):1235–9. doi: 10.1038/nature06385. [DOI] [PMC free article] [PubMed] [Google Scholar]
- (49).Nora DM, Tsinberg P, Tang Z, Bischoff FZ, Wilson T, Leonard EF. Efficient capture of circulating tumor cells with a novel immunocytochemical microfluidic device. Biomicrofluidics. 2011 Sep;5(3):34119–3411915. doi: 10.1063/1.3623748. [DOI] [PMC free article] [PubMed] [Google Scholar]
- (50).Galanzha EI, Shashkov EV, Kelly T, Kim JW, Yang L, Zharov VP. In vivo magnetic enrichment and multiplex photoacoustic detection of circulating tumour cells. Nat Nanotechnol. 2009 Dec;4(12):855–60. doi: 10.1038/nnano.2009.333. [DOI] [PMC free article] [PubMed] [Google Scholar]
Associated Data
This section collects any data citations, data availability statements, or supplementary materials included in this article.