Abstract
Derivatives of methyl 3-(1-methyl-5-(1-methyl-5-(propylcarbamoyl)-1H-pyrrol-3-ylcarbamoyl)-1H-pyrrol-3-ylamino)-3-oxopropane-1-sulfonate (1), a peptide-based DNA minor groove binding methylating agent, were synthesized and characterized. In all cases the N-terminus was appended with a O-methyl sulfonate ester while the C-terminus group was varied with non-polar and polar sidechains. In addition, the number of pyrrole rings was varied from 2 (dipeptide) to 3 (tripeptide). The ability of the different analogues to efficiently generate N3-methyladenine was demonstrated as was their selectivity for minor groove (N3-methyladenine) vs. major groove (N7-methylguanine) methylation. Induced circular dichroism studies were used to measure the DNA equilibrium binding properties of the stable sulfone analogues; the tripeptide binds with affinity that is > 10-fold higher than the dipeptide. The toxicities of the compounds were evaluated in alkA/tag glycosylase mutant E. coli and in human WT glioma cells and in cells over-expressing and under-expressing N-methylpurine-DNA glycosylase, which excises N3-methyladenine from DNA. The results show that equilibrium binding correlates with the levels of N3-methyladenine produced and cellular toxicity. The toxicity of 1 was inversely related to expression of MPG in both the bacterial and mammalian cell lines. The enhanced toxicity parallels the reduced activation of PARP and diminished rate of formation of aldehyde reactive sites observed in the MPG knockdown cells. It is proposed that unrepaired N3-methyladenine is toxic due to its ability to directly block DNA polymerization.
DNA damaging agents, which affect DNA metabolism, continue to be extensively used in the treatment of cancer.1 While interference with DNA metabolism causes cell death by apoptosis and/or necrosis, some cells survive through error free repair or error prone bypass of the lesion. The latter gives rise to increased mutations associated with higher cancer risk and many of these DNA damaging drugs are listed by the International Agency for Cancer Research as human carcinogens.2 In fact, there is significant incidence of secondary cancers that are directly attributable to the treatment of patients with antineoplastic agents for their primary cancer.3–6 Because DNA remains a chemotherapeutic target for many cancers, it is important to minimize mutagenic side effects. In addition, new agents whose mechanisms of action do not overlap with existing therapies, including those that react with DNA, have potential to overcome tumor resistance to drugs.7–12
We previously developed alkylating agents related to netropsin that equilibrium bind to, and efficiently react with, atoms that line the floor of the minor groove of DNA at A/T rich sequences, specifically the N3-position of adenine.13–17 An O-methyl sulfonate ester was appended to the N-terminus of a N-methylpyrrolecarboxamide-based dipeptide to combine the alkylating activity with DNA equilibrium binding (Figure 1, compound 1).13 The C-terminus of the dipeptide was capped with an n-propyl group, thereby, making the molecules neutral, unlike most natural product minor groove binders, which are cationic. The result is a DNA equilibrium binder with relatively weak affinity for DNA.18 Despite this weak affinity due to the absence of stabilizing electrostatic interactions, the molecule efficiently and selectively reacts both in vitro and in cells to yield N3-methyladenine (3-mA).13–18 Compound 1 is quite cytotoxic as compared to non-equilibrium binding alkylating agents, e.g., methyl methanesulfonate (MMS), and is relatively non-mutagenic.19–22 In vitro data indicated that the toxicity results from the 3-mA lesion efficiently blocking DNA replication and causing cell death.23–26 In fact, the weak mutagenicity of 1 was attributable to the intermediate formation of abasic sites as part of base excision repair (BER) of 3-mA.27
Figure 1.
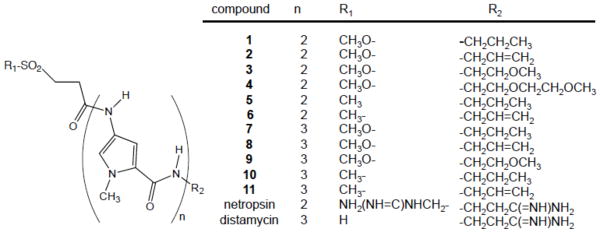
Structures of compounds.
We describe herein the synthesis and characterization of derivatives of dipeptide 1 with different C-termini and with an additional peptide subunit and analyze how these changes affect DNA methylation, affinity binding and toxicity. To further explore the mechanism of toxicity of these compounds that generate 3-mA, we performed studies using cells that are WT for the human methylpurine DNA glycosylase (MPG), cells that over-express MPG (MPG+) and cells where MPG has been knocked down (MPG-). The time course for formation of abasic sites and strand breaks with 5-p-dR termini, PARP activation, PARP inactivation, and caspase-3 and -7 activation were monitored. In addition, microfluidic-assisted replication tract analysis was used to demonstrate that 3-mA directly, or indirectly, causes replication fork arrest in cells. The results provide new insights into the role of different BER intermediates and repair processes in cytotoxicity.
EXPERIMENTAL PROCEDURES
Materials and reagents
E. coli AB1157 (WT) and E. coli GC4803 (AlkA/tag) were obtained from T. O’Connor (City of Hope National Medical Center, Duarte, CA) and L. Samson (Massachusetts Institute of Technology, Cambridge, MA). Human glioblastoma (T98G) cells were obtained from American Type Culture Collection (Manassas, VA). CellTiter 96 AQueous One Solution Reagent was obtained from Promega Corp (Madison, WI). T98G cells over expressing human MPG were developed essentially as described previously by plasmid transfection.28,29 Briefly, 1.5 × 10⁵ cells were seeded into 60 mm dishes and incubated for 24–30 h at 5% CO2 at 37 °C. The human MPG expression plasmid (pCMV-MPG-IRES-Neo) was transfected using FuGene 6 Transfection Reagent (Roche; Indianapolis, IN) according to the manufacturer’s instructions. Stable cell lines were selected in G418 for 2 wk and expression of human MPG protein (nuclear extract) was validated by immunoblot analysis and by activity analysis, as described30,31 The MPG- cells were developed by shRNA-mediated gene knockdown using lentivirus expressing MPG-specific shRNA.32 The shRNA vectors used for stable knockdown cell line development were obtained as glycerol stocks from Sigma-Aldrich and the UPCI Lentiviral core facility (http://www.upci.upmc.edu/vcf/lenti.cfm). Lentiviral particles were generated (in collaboration with the UPCI Lentiviral facility) by co-transfection of 4 plasmids [the shuttle vector plus three packaging plasmids: pMD2.g(VSVG), pVSV-REV and PMDLg/pRRE] into 293-FT cells using FuGene 6 Transfection Reagent (Roche, Indianapolis, IN), as described previously.28 Lentiviral transduction was performed as described earlier.28 Briefly, 6.0 × 10⁴ cells were seeded into a 6-well plate 24 h before transduction. Cells were transduced for 18 h at 32 °C and then cultured for 72 h at 37 °C. Cells were then selected by culturing in growth media with 1.0 μg/mL puromycin, as previously described.32
DNA Damage Quantification kit (abasic site counting) was purchased from Dojindo Molecular Technologies (Rockville, MD). HT Colorimetric PARP Apoptosis Assay Kit was purchased from Trevigen (Gaithersburg, MD). Pierce Cleaved PARP Colorimetric in-cell ELISA kit was purchased from Thermo Scientific (Rockford, IL). DNAzol reagent, all cell culture components, Enzcheck® Caspase-3 Assay kit and Alexa Fluor 488 annexin V/Dead Cell Apoptosis Kit were purchased from Invitrogen (Carlsbad, CA). Chemicals and solvents were purchased from Sigma Aldrich Chemicals (St. Louis, MO). 10%Pd-C was purchased from Strem chemicals. Molecular biology grade buffers, as well as plastic- and glass-ware were obtained from Fisher Scientific (Pittsburgh, PA).
Synthesis of DNA methylating agent 7
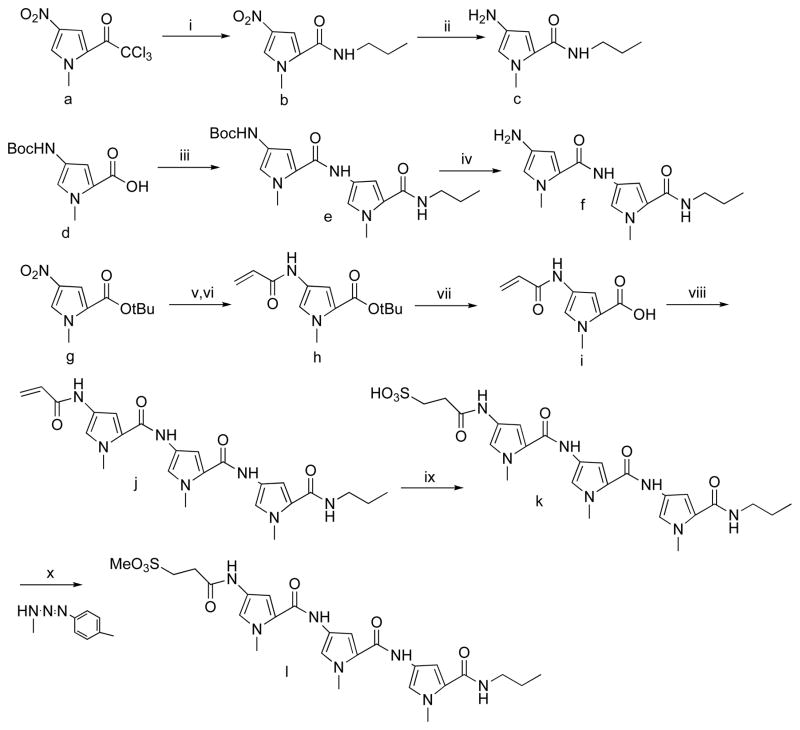
(see Scheme 1 and Supporting Information for synthesis and characterization of all compounds). All 1H NMR spectra were collected on a Bruker instrument operating at 400 MHz and data is reported as ppm.
Scheme 1.
Reagents and conditions: (i) n-PrNH2, EtOAc; (ii) 10% Pd/C, EtOH; (iii) compound c, EDC, HOBT, Et3N, CH2Cl2; (iv) TFA, CH2Cl2; (v) 10% Pd/C, MeOH; (vi) CH2=CHCOCl, DIEA, THF; (vii) 1M TiCl4, CH2Cl2; (viii) compound f, EDC, HOBT, Et3N; (ix) NaHSO3, EtOH/H2O; (x) dioxane, 80 °C.
2,2,2-Trichloro-1-(1-methyl-4-nitro-1H-pyrrol-2-yl)ethanone (a)
was prepared as previously described.33
1-Methyl-4-nitro-N-propyl-1H-pyrrole-2-carboxamide (b)
To a solution of a (3.47 g, 12.78 mmol) in 96 mL of EtOAc was added propylamine (31.95 mmol, 2.6 mL) drop wise at 0 °C. The reaction mixture was stirred for an additional 1 h and the solvent evaporated to give b in 98% yield. 1H NMR (CDCl3): δ 0.98 (t, 3H, J = 7.3), 1.57–1.66 (m, 2H), 3.33–3.38 (m, 2H), 3.99 (s, 3H), 5.97 (s, br, 1H), 7.04 (d, 1H, J = 1.83), 7.55 (d, 1H, J = 1.83).
4-Amino-1-methyl-N-propyl-1H-pyrrole-2-carboxamide (c)
To a solution of b (1g, 4.73 mmol) in EtOH (300 mL) was added 10% Pd/C catalyst (300 mg) and the reaction shaken in a Parr apparatus at 50 psi until disappearance of starting material (based on TLC). The reaction mixture was filtered through a celite pad and solvents evaporated to dryness to give quantitative yields of c. 1H NMR (DMSO-d6) δ 0.84 (t, 3H, J = 7.42), 1.42–1.48 (m, 2H), 3.05–3.09 (m, 2H), 3.66 (s, 3H), 6.16 (d, 1H, J = 1.95), 6.17 (d, 1H, J = 1.95), 7.70 (t, 1H, J = 5.47).
4-((t-Butoxycarbonyl)amino)-1-methyl-1H-pyrrole-2-carboxylic acid (d)
was prepared as previously reported.33
t-Butyl(1-methyl-5-((1-methyl-5-(propylcarbamoyl)-1H-pyrrol-3-yl)carbamoyl)-1H-pyrrol-3-yl)carbamate (e)
To a solution of d (538 mg, 2.24 mmol) and HOBT (454 mg, 3.36 mmol) in anhydrous CH2Cl2 (30 mL) was added Et3N (1.25 mL, 8.96 mmol) and EDC (859 mg, 4.48 mmol). The reaction mixture was stirred at room temperature for 1 h under N2. After 1 h, the reaction mixture was cooled and amine c (609 mg, 3.36 mmol) was added in CH2Cl2 (20 mL) containing Et3N (500 μL). The reaction mixture was stirred under N2 for 18 h and then diluted with CH2Cl2 and washed with H2O. The aqueous layer was extracted with CH2Cl2, dried over Na2SO4 and the solvent evaporated. The residue was purified by silica gel column chromatography to obtain e in 86% yield. 1H NMR (DMSO-d6) δ 0.86 (t, 3H, J = 7.42), 1.45 (s, 9H), 1.46–1.52 (m, 2H), 3.09–3.14 (m, 2H), 3.78 (s, 3H), 3.79 (s, 3H), 6.81 (s, br, 1H), 6.84 (d, 1H, J = 1.56), 6.88 (s, br, 1H), 7.15 (d, 1H, J = 1.95), 7.98 (t, 1H, J = 5.46), 9.09 (s, 1H), 9.80 (s, 1H).
4-Amino-1-methyl-N-(1-methyl-5-(propylcarbamoyl)-1H-pyrrol-3-yl)-1H-pyrrole- 2-carboxamide (f)
To a solution of e (671 mg, 1.66 mmol) in anhydrous CH2Cl2 (8 mL) was added 50% TFA:CH2Cl2 (v/v, 24 mL) at 0 °C such that the final concentration of TFA is approximately 40%. The reaction mixture was stirred at 0 °C until the complete disappearance of starting material (based on TLC). The solvent was evaporated to dryness to give f in quantitative yield. 1 H NMR (DMSO-d6) δ 0.86 (t, 3H, J = 7.42), 1.44–1.539 m, 2H), 3.09–3.15 (m, 2H), 3.80 (s, 3H), 3.89 (s, 3H), 6.84 (d, 1H, J = 1.95), 6.94 (d, 1H, J = 1.95), 7.11 (d, 1H, J = 1.95), 7.18 (d, 1H, J = 1.95), 8.01 (t, 1H, J = 5.46), 9.75 (s, 1H), 9.98 (s, 1H).
t-Butyl 1-methyl-4-nitro-1H-pyrrole-2-carboxylate (g)
was prepared as previously described.34
t-Butyl 4-acrylamido-1-methyl-1H-pyrrole-2-carboxylate (h)
To a solution of g (1.4 g, 6.19 mmol) in MeOH (350 mL) was added 10% Pd/C catalyst (1 g) and the reaction mixture shaken in a Parr apparatus at 55 psi until complete disappearance of starting material (by TLC). The reaction mixture was filtered through a celite pad and solvents evaporated to dryness to afford the amine in quantitative yield (1.06 g, 5.40 mmol), which was dissolved in anhydrous THF (70 mL) and DIEA (2.8 mL, 16.20 mmol). The reaction mixture was cooled to −78 °C and acryloyl chloride (658 μL, 8.10 mmol) was added dropwise. The reaction mixture was maintained at −78 °C until the disappearance of the amine was complete (based on TLC). The THF was concentrated to a minimum volume and diluted with CH2Cl2 and washed with H2O. The aqueous layer was extracted thoroughly with CH2Cl2, dried over Na2SO4 and solvents evaporated to dryness. The residue was purified by silica gel column chromatography to yield h in 76% yield. 1H NMR (DMSO-d6) δ 1.49 (s, 9H), 3.79 (s, 3H), 5.67 (dd, 1H, J = 10.16 and 2.34), 6.16 (dd, 1H J = 17.19, and 2.34), 6.27–6.34 (m, 1H), 6.71 (d, 1H, J = 1.95), 7.34 (d, 1H, J = 1.95), 10.08 (s, br, 1H).
4-Acrylamido-1-methyl-1H-pyrrole-2-carboxylic acid (i)
To a solution of h (1.032 g, 4.12 mmol) in CH2Cl2 (30 mL) was added 1 M TiCl4 solution (10 mL, 10.31 mmol) at 0 °C. The reaction mixture was stirred and slowly allowed to come to room temperature until complete disappearance of starting material. The reaction mixture was diluted with CH2Cl2 and washed with H2O. The aqueous layer was extracted with EtOAc and the organic solvent extracts pooled, dried over Na2SO4 and evaporated to dryness to yield 96% of i. 1H NMR (DMSO-d6) δ 3.81 (s, 3H), 5.67 (dd, 1H, J = 9.77 and 1.96), 6.17 (dd, 1H, J = 17.18 and 1.96), 6.29–6.35 (m, 1H), 6.71 (d, 1H, J = 1.95), 7.38 (d, 1H, J = 1.95), 10.09 (s, br, 1H), 12.22 (s, br, 1H).
4-Acrylamido-1 -methyl-N-(1-methyl-5-((1-methyl-5-(propylcarbamoyl)-1H- pyrrol-3-yl)carbamoyl)-1H-pyrrol-3-yl)-1H-pyrrole-2-carboxamide (j)
To a solution of i (217 mg, 1.12 mmol) and HOBT (225 mg, 1.66 mmol) in anhydrous CH2Cl2 (20 mL) is added Et3N (0.618 mL, 4.44 mmol) and EDC (425 mg, 2.22 mmol). The reaction mixture was stirred at room temperature for 1 h under N2, cooled and amine f (505 mg, 1.66 mmol) added in CH2Cl2 (11 mL) containing Et3N (1 mL). The reaction mixture was stirred under N2 for 18 h and then diluted with CH2Cl2 and washed with H2O. The aqueous layer was extracted thoroughly with CH2Cl2, dried over Na2SO4 and solvents evaporated. The residue was purified by silica gel column chromatography to afford j in 60% yield. 1H NMR (DMSO-d6) δ 0.87 (t, 3H), 1.46–1.52 (m, 2H), 3.10–3.16 (m, 2H), 3.79 (s, 3H), 3.84 (s, 3H), 3.85 (s, 3H), 5.67 (dd, 1H, J = 10.15 and 1.95), 6.19 (dd, 1H, J = 17.19 and 1.95), 6.34–6.41 (m, 1H), 6.86 (d, 1H, J = 1.56), 6.94 (d, 1H, J = 1.56), 7.04 (d, 1H, J = 1.95), 7.18 (d, 1H, J = 1.95), 7.25 (d, 1H, J = 1.95), 7.28 (d, 1H, J = 1.95), 8.0 (t, 1H, J = 5.47), 9.89 (s, 1H), 9.95 (s, 1H), 10.12 (s, 1H).
3-((1-Methyl-5-((1-methyl-5-((1-methyl-5-(propylcarbamoyl)-1H-pyrrol-3-yl)carbamoyl)-1H-pyrrol-3-yl)carbamoyl)-1H-pyrrol-3-yl)amino)-3-oxopropane-1-sulfonic acid (k)
To a solution of j (123 mg, 0.257 mmol) in EtOH/H2O (4:1, 5.6 mL), was added NaHSO3 solution (0.514 mmol, 55 mg in 0.740 mL H2O). The pH of the solution was adjusted to 8 and the reaction mixture refluxed at 90 °C until complete disappearance of starting material (based on TLC). The reaction was cooled to 0 °C and conc HCl was added dropwise so that the pH was between 1 and 2. The solvent was evaporated to dryness to yield a bright yellow solid that was treated with cold 2 N HCl. The mixture was centrifuged (4000 rpm, 10 min) and the supernatant decanted off and the remaining solid was twice washed again with 2 N cold HCl, centrifuged and the supernatant decanted. The remaining solid material was thoroughly dried to give 93% of k. 1H NMR (DMSO-d6) δ 0.87 (t, 3H), 1.44–1.53 (m, 2H), 2.53–2.57 (m, 2H), 2.66–2.70 (m, 2H), 3.09–3.15 (m, 2H), 3.79 (s, 3H), 3.83 (s, 3H), 3.84 (s, 3H), 6.85 (d, 1H, J = 1.56), 6.87 (d, 1H, J = 1.56), 7.03 (d, 1H, J = 1.95), 7.15 (d, 1H, J = 1.56), 7.18 (d, 1H, J = 1.95), 7.24 (d, 1H, J = 1.56), 8.0 (t, 1H, J = 6.48), 9.89 (s, 1H), 9.91 (s, 1H), 9.97 (s,1H).
Methyl 3-(1-methyl-5-(1-methyl-5-(1-methyl-5-(propylcarbamoyl)-1H-pyrrol-3-yl)carbamoyl)-1H-pyrrol-3-yl)carbamoyl)-1H-pyrrol-3-ylamino)-3-oxopropane-1-sulfonate (l)
To a solution of k (129 mg, 0.229 mmol) in dry dioxane (13 mL) was added 3-methyl-1-p-tolyltriaz-1-ene (343 mg, 2.297 mmol). The reaction was heated in an oil bath at 80 °C for ~ 4 h. The dioxane was reduced to minimum volume and the residue loaded onto a Et3N deactivated silica gel column. The product l (49%) was eluted with EtOAc. 1H NMR (DMSO-d6) δ 0.87 (t, 3H), 1.46–1.52 (m, 2H), 2.74 (t, 2H, J = 7.42), 3.10–3.15 (m, 2H), 3.62 (t, 2H, J = 7.42), 3.79 (s, 3H), 3.84 (s, br, 6H), 3.87 (s, 3H), 6.86 (d, 1H, J = 1.57), 6.89 (d, 1H, J = 1.95), 7.03 (d, 1H, J = 1.95), 7.16–7.19 (m, 2H), 7.24 (d, 1H, J = 1.95), 8.0 (t, 1H, J = 5.08), 9.89 (s, 1H), 9.93 (s, 1H), 10.07 (s, 1H). 13C NMR (150 MHz, DMSO-d6) 11.94, 23.08, 29.86, 36.39, 36.60, 36.64, 40.66, 44.50, 57.45, 104.39, 104.55, 105.12, 118.14, 118.67, 118.92, 122.12, 122.53, 122.55, 123.24, 123.33, 123.56, 158.82, 158.91, 161.70, 166.05. HR-MS (ES+H) m/z: calcd for C25H34N7O7S: (576.2240). Found: (576.2261).
DNA equilibrium binding studies
Calf thymus DNA (CT-DNA), poly (deoxyadenylic–thymidylic) acid sodium salt [poly-d(A-T)], netropsin and distamycin were purchased from Sigma-Aldrich, St. Louis, MO. The stock solutions for these polymers were prepared by overnight dialysis at 4 °C against 10 mM sodium phosphate buffer containing 1 mM Na2EDTA and 10 percent EtOH at pH 7. The concentration of stock CT-DNA and poly-d(A-T) solutions were measured on a UV spectrophotometer using their extinction coefficient as ε260 = 6550 M−1 cm−1 and ε260 = 6500 M−1 cm−1 respectively. For all the experimental purposes, the compounds were dissolved in the respective buffers and their concentrations determined spectrophotometrically using the extinction coefficients, ε296 = 21,500 M−1 cm−1 for 5, 6 and netropsin, and ε303 = 34,000 M−1 cm−1 for 10, 11 and distamycin.
Thermal denaturation experiments were carried out on a Cary UV 300 Bio UV-visible Spectrophotometer (Varian Inc., Palo Alto, CA) coupled to a Cary Temperature Controller unit. All the experiments were performed using a 1.4 mL cuvette (1 cm path length). The melting of CT-DNA and poly-d(A-T) were monitored at 260 and 275 nm in the temperature range of 0 – 95 °C at a heating rate of 0.5 °C/min with a data interval of 0.2 °C in the absence and presence of sulfones 5, 6, 10 and 11. The melting temperature (TM) was determined by the analysis of the shape and first-derivative of the melting curves.
The induced circular dichroism (ICD) titration of compounds 5, 6, 10 and 11 with CT-DNA and poly-d(A-T) were performed on a Jasco-815 CD spectrometer (Jasco Corporation, Tokyo, Japan) equipped with Jasco PTC-423S/15 Peltier Temperature Controller system. Two-point calibration of the CD spectrometer was checked using 3.855 mM (1S)-(+)-10-camphorsulphonic acid. The spectra of this solution in a 1 mm cuvette resulted in the ratio, ε191/ε291 = −2.00. All the experiments were done at a constant temperature of 20 °C maintained with the help of Julabo F25-ME refrigerated/heating circulator. The spectrometer was purged for ~ 15 min with N2 before starting the instrument and then ~ 30 min for the light source to attain stability before starting the experiments. The serial dilution approach to ICD described by Garbett et al.35 was used to titrate the sulfone compounds (~ 10 – 50 μM) with CT-DNA or poly-d(A-T) in the concentration range of 1 nM to 1 mM. In this approach, an experiment was started with a solution containing the maximum concentration of the DNA substrate and then serially diluting the solution in the cuvette with a ligand stock solution of the same concentration as in the cuvette to achieve the required concentration range of the DNA substrate, thus titrating the DNA substrate against a constant ligand concentration. A semi-microcuvette with non-transmitting black walls with a 1 cm path length was used for all the experiments. The spectra were scanned from 400 to 220 nm with a data pitch of 0.1 nm, and a scan speed of 100 nm/min with 1 sec response time and 1 nm bandwidth. Each spectrum was buffer subtracted and the final plot taken as an average of three accumulated scans. The binding curve was obtained by plotting the maxima of the induced CD signal of the sulfone compounds as a function of the logarithm of the DNA substrate concentration. The binding constant was calculated by evaluating the slope of the graph using non-linear fit option in Origin/FitAll software as previously described.35
DNA methylation
CT DNA (100 μM, nucleotide), dialyzed overnight against 10 mM sodium cacodylate buffer (pH 7.0) was reacted at room temperature for 24 h with methylating compounds (dissolved in minimal volume of ice-cold 95% EtOH) at final concentrations of 1, 5, 10, and 100 μM in 10 mM sodium cacodylate buffer (pH 7.0) in a total volume of 2 mL (for 1, 5 and 10 μM alkylating agent) or 1 mL (for 100 μM alkylating agent). The DNA was precipitated from the reaction solution with 3 M NaOAc (pH 4.8) and EtOH, and then redissolved in 10 mM sodium cacodylate buffer (pH 7.0) to a total volume of 500 μL and heated for 30 min at 90 °C to release N3- and N7-alkylpurines. The partially apurinic DNA was precipitated at 0 °C by adding 50 μL of cold 0.1 N HCl. The supernatant containing the N-methylpurines was analyzed by HPLC. For measurement of 3-mA, the following conditions were utilized: column, Partisil 10 SCX; temperature, 25 °C; eluent, 175 mM ammonium formate (pH 3.0) containing 30% (v/v) MeOH; flow rate, 1 mL/min; detection, UV at 270 nm. For simultaneous measurement of both 3-mA and 7-methylguanine (7-mG), the following conditions were utilized: Syngeri Fusion-RP column (temperature, 25 °C; eluent, 50 μM ammonium formate (pH 4.0) containing 2% (v/v) isopropanol; flow rate, 1.25 mL/min; detection, UV at 270 and 280 nm). Authentic standards of 3-mA and 7-mG were used for HPLC identification of adducts and to calculate response factors.
E. coli cytotoxicity assays
Cultures of Escherichia coli strains AB1157 (strr, wild type) and GC4803 (alk−/− tag−/− kanr, DNA repair mutant) were started from frozen stocks, in liquid LB media with the corresponding antibiotic. Overnight cultures of the strains were used to seed 10 mL of LB medium and the cells allowed to grow for 2–3 h until they reached the mid-log growth stage (OD600 = 0.5). Cells were harvested from 1 mL aliquots by centrifugation (5000 × g, 5 min), washed with phosphate buffered saline (PBS) and resuspended in 950 μL PBS. Pre-weighed aliquots of compounds were dissolved in 95% EtOH to give a 1 M stock. Dilutions of this stock were used to confirm the concentration of compound in solution by UV absorbance. Depending on observed concentration, the stock solution of alkylating agent was diluted in appropriate volumes of 95% EtOH to obtain working stocks of 40, 80, 120, 160 and 200 μM. 50 μL of each stock solution was added to 950 μL of the previously prepared cell suspension (in 1x PBS) and mixed by vortexing. The cells were treated with the methylating compounds for 1 h at 37 °C. A control set was included in which cells were treated similarly with 5% EtOH in 1x PBS. Post treatment, the cells were harvested by centrifugation, rinsed with 1x PBS, serially diluted (100 – 10−6) in 1x PBS and plated on solid LB media with the appropriate antibiotic. After 16 h, colonies were counted on the plate and cell viability (survival %) was calculated relative to the control set.
T98G Glioma cell cytotoxicity assay
Human glioblastoma cells (T98G) were maintained in growth medium, i.e., Eagle’s Minimum Essential Medium (EMEM) with 10% fetal bovine serum (FBS), 50 μg μL-1 gentamycin, 1x MEM non-essential amino acids and 1 mM sodium pyruvate. To evaluate short term cytotoxicity measuring viable cells, T98G cells maintained in growth medium were harvested by Trypsin-EDTA treatment, resuspended in fresh growth medium at a density of 104 cells mL−1, and 200 μL (2 × 10³ cells) of this suspension was seeded into the wells of a sterile 96-well tissue culture microplate. The cells were allowed to attach and grow for 24 h, and then treated with serial dilutions of the drug for 72 h. After treatment, viable cells were measured using an MTS assay using the CellTiter 96 AQueous kit (Promega) as per manufacturer’s instructions. To assay long-term cytotoxicity, cells were grown until approximately 50–75% confluence before being trypsinized and counted using a CASY counter per the manufacturer’s instructions. Cells were seeded into 96-well plates at a density of 120 cells/well and incubated at 37 °C for 24 h. The cells were treated with 1 and incubated for 9 days at 37 °C. Plates were removed and fluorescence was determined using the CyQuant kit (Invitrogen, #C7026) following the manufacturer’s instructions. Results were the average of two separate experiments and normalized to vehicle treated control cells with error bars representing the standard error of the mean, as previously described.35
Quantification of aldehyde reactive sites (ARS)
T98G cells maintained in growth medium, were harvested by Trypsin-EDTA treatment, resuspended in fresh growth medium at a density of 2.5 × 10⁵ cells/mL, and 2 mL (5 × 10⁵ cells) of this suspension was seeded into the wells of a sterile 6-well tissue culture plate. Cells were allowed to grow for 24 h, treated with the various compounds for different time points and/or at different concentrations. At the end of each treatment, adherent cells were harvested by trypsin-EDTA treatment and pooled with cells in the culture supernatant. Pooled cells in suspension were pelleted by centrifugation, washed with 1x PBS and genomic DNA isolated using the DNAzol reagent (Invitrogen). DNA in solution was quantified by UV absorbance at 260 nm using a Synergy H1 multiwell plate reader (BioTek, Winooski, VT). ARS in purified DNA were then reacted with the biotin-conjugated aldehyde reactive probe, immobilized onto 96-well ELISA plates, and detected using horseradish peroxidase (HRP)-conjugated streptavidin using a colorimetric substrate as per manufacturer’s instructions (Dojindo Molecular Technologies, Rockville, Maryland).
Markers of Apoptosis
T98G cells maintained in growth medium, were harvested by Trypsin-EDTA treatment, resuspended in fresh growth medium and seeded into 96- or 6-well plates as per the assay requirements: (i) to measure PARP activity, 2 × 10⁴ cells were seeded into the wells of a 96 well plate, (ii) to measure PARP cleavage, 104 cells were seeded into the wells of a 96-well plate, and (iii) to measure caspase-3 and -7 activities, 106 cells were seeded into the wells of a 6-well plate. Cells were allowed to grow for 24 h, treated with compounds for different time periods and/or at different concentrations. At the end of each treatment, adherent cells were harvested by trypsin-EDTA treatment and pooled with cells in the supernatant. The PARP activity was determined by measuring the deposition of PAR on immobilized histones using anti-PAR (primary antibody) and horseradish peroxidase (HRP) conjugated secondary antibody (Trevigen Inc., Gaithersburg, MD). PARP cleavage was measured using anti-cleaved PARP (primary antibody) and HRP-conjugated secondary antibody (Thermo Fisher Scientific, Pittsburgh, PA). Intracellular capase-3 and -7 activities were measured using Z-DEVD-AMC (benzyloxycarbonyl-Asp-Glu-Val-Asp-7-amino-4-methylcoumarin), a synthetic fluorogenic substrate of cysteine proteases, such as caspase-3 and -7 (Invitrogen, Carlsbad, CA).
Microfluidic-assisted replication tract analysis
Human glial SF767 tumor cells were incubated with 50 μM iododeoxyuridine (IdU) to label active replication forks.36 After removal of IdU, cells were incubated with 50 μM chlorodeoxyuridine (CldU) in the presence of solvent or 1 (5 or 10 μM). The DNA from the cells was isolated and loaded into microcapiliaries and immunostained with antibodies specific for each of the halogenated pyrimidines. The capillaries were examined under a fluorescent microscope equipped with a digital camera to locate areas with optical density and alignment. Each of the fields selected was photographed twice with different filters to obtain 2 color images. Approximately 50–80 images were taken of 3–4 micro channels for each sample in order to collect 300–400 replication tracks. Track lengths were measured using AxioVision image analysis software. The criteria for collecting image data on a track were DNA density and track alignment; tracks containing 3 labeled segments (e.g., green-red-green) that likely present the merging of forks from adjacent replicons were not included.
RESULTS
Synthesis
The syntheses of the sulfonate ester and sulfone analogues of the di- and tri-peptide minor groove binders with the different C-terminus groups (Figure 1) generally followed previously published procedures13 with modifications that are described in Experimental Procedures and in Supporting Information.
Methylation of DNA
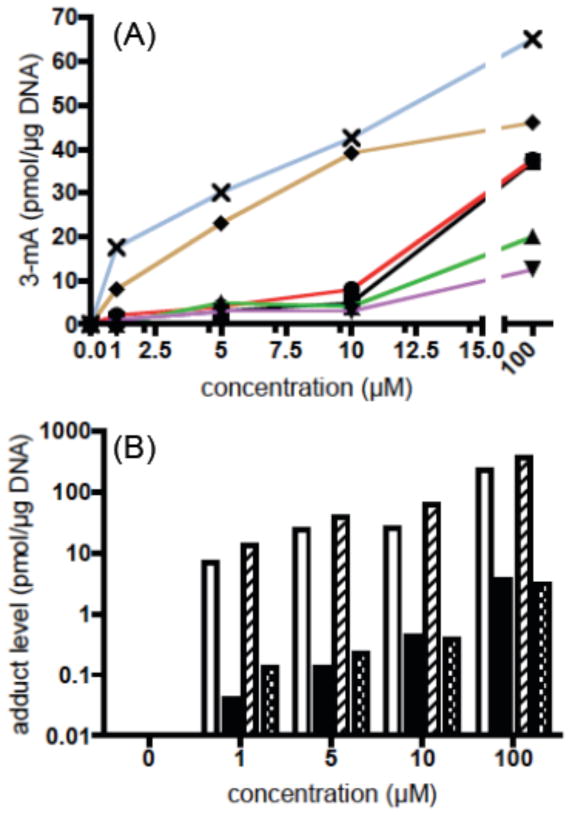
The yields of 3-mA as a result of the incubating different concentrations of compounds 1–4, 7 and 8 with CT-DNA for 24 h at room temperature in pH 7.0 sodium cacodylate buffer are shown in Figure 2A. Among the 2-ring compounds, the methoxyethyl (3) and methoxyethoxyethyl (4) ethers yielded the lowest amount of 3-mA, although the difference between any of the 2-ring compounds was only evident at the highest (100 μM) concentration. It appears that the compounds with more polar C-terminal sidechains have weaker methylating activity than those with the more hydrophobic propyl and allyl groups. The tripeptide propyl (7) and allyl (8) compounds show a clear concentration response with 3-mA adduct being observed even at the 1 μM concentration. Analogue 8 with the allyl terminus was the most active compound.
Figure 2.
(A) Formation of N3-methyladenine (3-mA) from the 24 h incubation of calf thymus DNA (100 μM nucleotide) with compounds 1–4, 7 and 8 at room temperature in 10 mM sodium cacodylate buffer (pH 7.0): 1 (■), 2 (●), 3 (▲), 4 (▼), 7 (◆), 8. (✖) Formation of 3-mA and N7-methylguanine (7-mG) from the incubation of 1 and 7 with calf thymus DNA in 10 mM cacodylate buffer (pH 7.0) at room temperature for 24 h.
The preference of dipetide 1 and tripeptide 7 for minor groove vs. major groove alkylation was assessed by comparing the relative yields of 3-mA and 7-mG (Figure 2B, Table 1). At the 1 and 5 μM concentrations, the ratio averages > 100:1 minor over major groove for both compounds. At the 10 and 100 μM concentration, the 3-mA to 7-mG ratio drops to approximately 60:1 for dipetide 1, but remains > 100:1 for tripeptide 7. Therefore, DNA methylation by the two compounds is essentially restricted to the formation of 3-mA. This contrasts with the 1:10 3-mA to 7-mG ratio observed with MMS and related methylating agents.
Table 1.
Minor (3-mA) and major (7-mG) groove adduct production (pmol/μg DNA) from the reaction of 1 and 7 with CT-DNA.a
| compound concentration | 1 | 7 | 1 | 7 | 1 | 7 | 1 | 7 |
|---|---|---|---|---|---|---|---|---|
| 1 μM | 5 μM | 10 μM | 100 μM | |||||
| 3-mA | 7.15 | 13.11 | 24.36 | 38.04 | 25.55 | 62.08 | 232.14 | 365.27 |
| 7-mA | 0.04 | 0.13 | 0.13 | 0.22 | 0.43 | 0.39 | 3.56 | 3.13 |
| 3-mA/7-mG | 179 | 101 | 187 | 173 | 59 | 159 | 65 | 117 |
Reactions conditions: 24 h incubation of compounds with CT-DNA (100 μM, p) at room temperature in 10 mM sodium phosphate buffer (pH 7.0). Data is based on HPLC analysis with UV detection.
DNA equilibrium binding
Several approaches were used to probe the relationship between DNA methylation by the different minor groove binders and their equilibrium binding to DNA using sulfone derivatives 5, 6, 10, and 11. The sulfonate esters are relatively reactive (t1/2 of ~ 6 h in pH 7 buffer, Supporting Information) and are converted into the sulfonate anion after they transfer their methyl group to a nucleophile. The sulfones are isosteric, neutral and stable in solution. Initial attempts to use isothermal titration calorimetry (ITC) was thwarted due to either limited solubility of the compounds in aqueous buffer system and the low heats liberated upon binding.
UV melting studies
The UV extinction coefficient of DNA as a function of temperature is related to the thermal stability of duplex DNA. The effect of 5, 6, 10 and 11 on the thermal stability of CT-DNA and poly-(dA-dT) was determined by monitoring absorbance at 260 nm and calculating the mid-point melting temperature (TM). Ligands that bind to double stranded DNA generally stabilize the duplex and increase the TM. A summarization of the effect of the four compounds on the thermal stability of CT-DNA and poly-d(A-T) is given in Table 2. The 2-ring compounds 5 and 6 showed a minimal increase in stability with a ΔTM of 0.4 °C for CT-DNA and 1.2 °C for poly-d(A-T). The 3-ring compounds 10 and 11 were more stabilizing: ΔTM of 1.1 °C for 10 and 11 with CT-DNA and 4.1 °C for 10 and 4.7 °C for 11 with poly-d(A-T). In comparison, netropsin and distamycin raise the TM of CT-DNA by 21.1 °C and 17.0 °C, and of poly-d(A-T) by 40.6 °C and 36.9 °C respectively.
Table 2.
Thermodynamic parameters for the equilibrium binding of minor groove binding methylsulfones to calf thymus (CT)-DNA and poly-d(A-T)a
| ΔTM (°C)c | Kb (M−1)d | |||
|---|---|---|---|---|
| Compoundb | CT-DNA | poly-d(A-T) | CT-DNA | poly-d(A-T) |
| 5 | 0.4 | 1.2 | n.d.e | n.d. |
| 6 | 0.4 | 1.2 | n.d. | n.d |
| 10 | 1.1 | 4.1 | 2.9 × 10⁴ | 2.0 × 10⁴ |
| 11 | 1.1 | 4.7 | 3.2 × 10⁴ | 1.8 × 10⁴ |
| netropsin | 21.1 | 40.6 | 2.0 × 10⁵ | 2.4 × 10⁵ |
| distamycin | 17.0 | 36.9 | 2.1 × 10⁵ | 5.1 × 10⁵ |
All analyses performed in 10 mM sodium phosphate buffer (pH 7.0).
See Figure 1 for structures.
Based on first derivative analysis of changes in extinction coefficient at 260 nm for CT-DNA and 275 nm for poly-d(AT) in the absence of compounds.
Binding constants based upon induced circular dichroism experiments (Figure 3).
below the limit of detection (< 104 M−1).
Induced CD studies
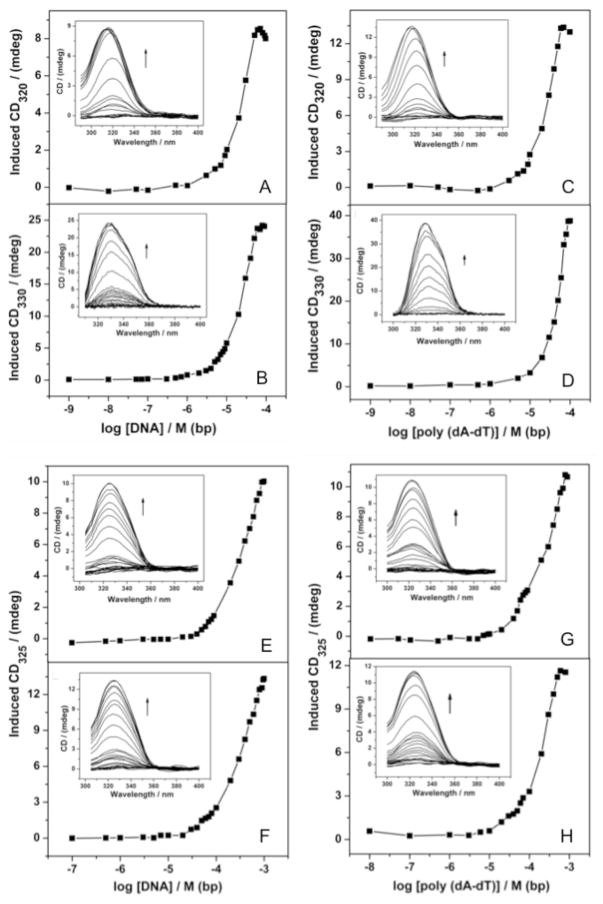
The 2- and 3-ring peptide compounds are achiral and optically inactive. However, upon interaction with DNA, ligands can acquire an induced-CD (ICD) signal through the coupling of electric transition moments of the ligand and the chiral double helix. This induced Cotton effect is distinct from the DNA CD spectrum and directly reflects the ligand-DNA interaction.35 The CD titration of netropsin, distamycin and tripeptides 10 and 11 with CT-DNA and poly-d(A-T) are represented in Figure 3 and the corresponding values for the binding constants are reported in Table 2. In the absence of the minor groove binding compounds, CT-DNA shows a positive band at 278 nm and a negative band at 245.2 nm at a concentration of 148 μM (Supporting Information). Similarly, poly-d(A-T) shows a positive band at 166 nm and a negative band at 246.9 nm at a concentration of 143 μM (Supporting Information). Titration of 10 μM netropsin with CT-DNA and poly-d(A-T) shows an ICD spectrum at 320 nm and gives a binding constant (Kb) of 1.95 × 10⁵ M−1 and 2.44 × 10⁵ M−1, respectively (Table 1, 5 and 6Figure 3A,C). Interaction of 10 μM dipeptides with CT-DNA and poly-d(A-T) in the concentration range of 1 nM to 1 mM did not give rise to any ICD signal (data not shown). Therefore, the binding of the 2-ring compounds to these DNA substrates is too weak to be experimentally determined by any of the methods attempted. Upon interaction with CT-DNA, tripeptides 10 and 11 at 10 μM showed a positive signal at 325 nm (Figure 3E-H). The signal saturated at 1 mM of CT-DNA giving a Kb of 2.88 × 10⁴ M−1 and 3.16 × 10⁴ M−1, respectively for 10 and 11 (Figure 3E,G). For the interaction of the compounds 10 and 11 with poly-d(A-T), the value for the binding constant was found to be 1.95 × 10⁴ and 1.81 × 10⁴ at 325 nm, respectively (Figure 3F,H).
Figure 3.
Titration curve of the ICD spectrum of sulfone derivatives of minor groove binders in 10% EtOH in phosphate buffer (pH 7) at 20 °C. CD of 10 μM minor groove binder in the presence of increasing concentration (1 nM to 0.1 mM, base pairs) of CT DNA and poly-d(A-T): inset the corresponding ICD spectra (arrow indicates the increasing concentration of DNA): (A) netropsin + CT-DNA; (B) distamycin + CT-DNA; (C) netropsin + poly-d(A–T); (D) distamycin + poly-d(A-T); (E) 10 + CT-DNA; (F) 11 + CT-DNA; (G) 10 + poly-d(A-T); (H) 11 + poly-d(A–T). Binding constants (Table 2) calculated using non-linear fit option in Origin software.
To understand the higher binding affinity provided by the extra pyrrolecarboxamide unit in the tripeptides and the effect of not being positively charged, the ICD maxima for the interactions of distamycin (10 μM) with CT-DNA and poly-d(A-T) (Figure 3B,D) were measured and compared to netropsin (Figure 3A,C) and the tripeptides 10 and 11. The Kb for distamycin was calculated to be 2.10 × 10⁵ M−1 and 5.13 × 10⁵ M−1 for CT-DNA and poly-d(A-T), respectively. Therefore, introduction of a single electrostatic interaction on the distamycin tripeptide due to the C-terminal guanidinium group results in approximately a 10-fold increase in binding affinity vs. neutral molecules 7 and 8. The extra cationic amidinium group on the N-terminus of the netropsin dipeptide vs. distamycin, compensates for the one less pyrrolecarboxamide subunit; both compounds have similar affinities for DNA.
Toxicity in E. coli
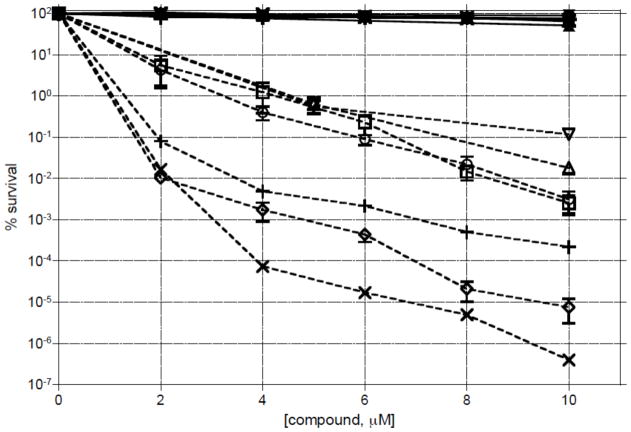
The toxicities of the di- and tri-peptide methylating agents were evaluated in WT E. coli and in an Alka/Tag double mutant (Figure 4). The latter is defective in both of the known bacterial DNA-glycosylases that excise 3-mA. None of the compounds show any toxicity up to 10 μM concentration in WT bacteria. Presumably, efficient BER protects the WT cells from low levels of alkylation damage. In the glycosylase double mutant cell, the toxicity profiles of the 2-ring analogs are quite similar, which correlates with the in vitro formation of 3-mA for the different compounds (Figure 2A). For the tripeptide analogs, the toxicities followed the order of allyl (8) > propyl (7) > methoxyethyl (9). The tripeptides are between 2.5–3.0 orders of magnitude more toxic than the corresponding dipeptide compounds. This also correlates with the in vitro adduct data for 7 and 8 (Figure 2A).
Figure 4.
Toxicity of 1–4, 7 and 8 in wild type AB1157 E. coli (closed/bolded symbols) and GC4803 alkA/tag glycosylase mutant cells (open symbols/non-bolded): dipeptides 1 (■,□), 2 (●,○), 3 (▲,△), 4 (▼, ▽) and tripeptides 7 (◆,◇), 8 (✖, ✕) and 9 (✚,+). Mid-log phase cells were exposed to varying concentrations of the analogues for 1 h, serially diluted and their survival measured on solid LB media.
Toxicity in T98G human glioma cells
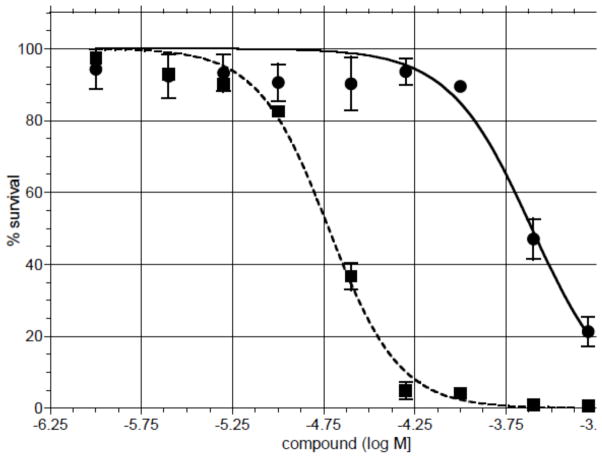
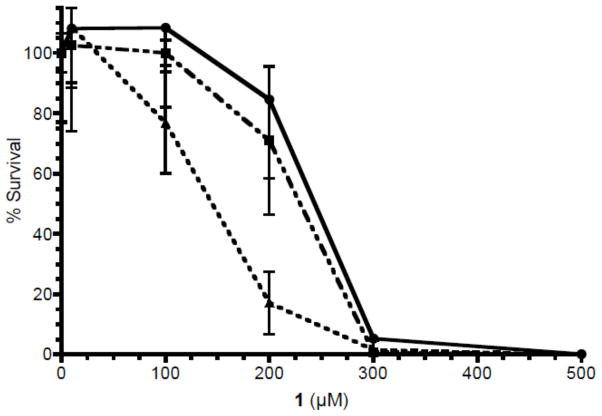
The toxicity of 1 and 7 were compared in WT T98G glioma cells using a short term (72 h) MTS assay (Figure 5). Tripeptide 7 (LD50 19 μM) is > 10-fold more toxic than the dipeptide 1 (LD50 246 μM). Comparative toxicity experiments were performed with 1 in WT T98G cells, and in cells engineered to over-express (MPG+) or under-express (MPG-) the human MPG glycosylase that mediates the excision of 3-mA in BER (Figure 6). In the over-expressing cells, there was a 10-fold increase in MPG mRNA and a very significant increase in protein expression.28 In the MPG knockdown T98G cells, the expression for MPG is <5% of that in the WT cells.32 There was no significant difference in the toxicity of 1 in the WT and MPG+ cells (LD50 ~240 μM). However, the MPG- cells were 60% more sensitive relative to WT or MPG+ cells (LD50 140). The differences in toxicity parallel the activation of PARP and formation of ARS (see below).
Figure 5.
Toxicity in WT T98G cells exposed to varying concentrations of dipeptide 1 (●) and tripeptide 7 (■) after which cell survival was measured by a standard MTS assay. Data was fit using a non-linear (curve-fit) in Prism software.
Figure 6.
Toxicity of 1 in T98G glioma cells: wild type (WT,●) and MPG over-expressing cells (MPG+,■) and MPG knock down cells (MPG-,▲). The cells were exposed to increasing concentrations of 1 and survival was determined by CyQuant assay 9 days after exposure, as described in the Methods section.
Formation of aldehyde reactive sites (ARS)
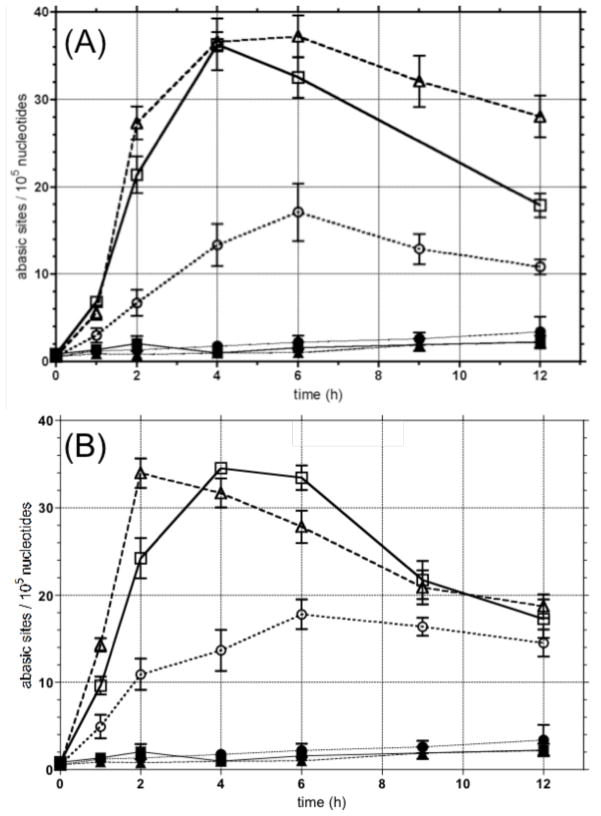
The apparent combined rates of formation and elimination of abasic sites and 5′-p-dR strand breaks were monitored in WT, MPG+ and MPG- T98G cells treated with equitoxic concentrations of 1 (80 μM) and 7 (7 μM). These concentrations were based upon their toxicity in the short-term assay in WT cells (Figure 5). An aldehyde reactive hydrazine probe37–39 that is biotin-conjugated with horseradish peroxidase (HRP)-conjugated streptavidin (Figure 7) was used to label the ring-opened aldehyde form of abasic sites, as well as other aldehyde groups that may be present. The level of aldehyde reactive sites (ARS) should correlate with the formation of the ring-opened form of the 1′-hydroxy-2′-deoxyribose group in abasic sites and 5′-p-dR termini.40 Within the limits of detection, the background levels with just 0.5 % DMSO are the same in all three cell lines. The initial rate of formation (up to 6 h) of ARS from 1 and 7 in WT cells are similar to that in MPG+ cells indicating that glycosylase excision of 3-mA is not limiting in WT cells. Moreover, the total ARS sustained for the time period monitored is virtually the same for both dipeptide 1 and tripeptide 7 at equitoxic concentrations. As anticipated, the MPG- cells respond differently: the rate of formation of ARS is slower and the sustained level of ARS over the 12 h time course never reaches 50% of that observed in the WT and MPG+ cells.
Figure 7.
Time-dependent effect of di- and tri-peptide methylating agents 1 and 7, respectively, on the formation of aldehyde reactive sites (ARS) in WT, MPG over-expressing (MPG+) and MPG deficient (MPG-) T98G cells: (A) WT with DMSO (■), MPG+ with DMSO (▲), MPG- with DMSO (●),WT with 80 μM 1 (□), MPG+ with 80 μM 1 (△), MPG- with 80 μM 1 (○); (B) WT with DMSO (■), MPG+ with DMSO (▲), MPG- with DMSO (●),WT with 7 μM 7 (□), MPG+ with 7 μM 7 (△), MPG- with 7 μM 7 (○).
As mentioned above, compounds 1 and 7 were compared to each other in WT, MPG+ and MPG- T98G cells using equitoxic concentrations in the WT cells. Because the number of WT cells in the cytotoxicity assay was 1 × 10⁴ cells/mL, whereas the ARS assay was done at a concentration of 25 × 104 cells/mL, the toxicity in the latter will be significantly lower due to dilution of the methylating agent in 25-fold more cells. In addition, markers for apoptosis, e.g., caspase-3 and -7, appear elevated only after 12 h and only with the 250 μM concentration, which is the LD50 in the toxicity assay (Figure 5). Therefore, it is unlikely that a significant percentage of ARS are being measured in dead cells.
PARP activation and cleavage
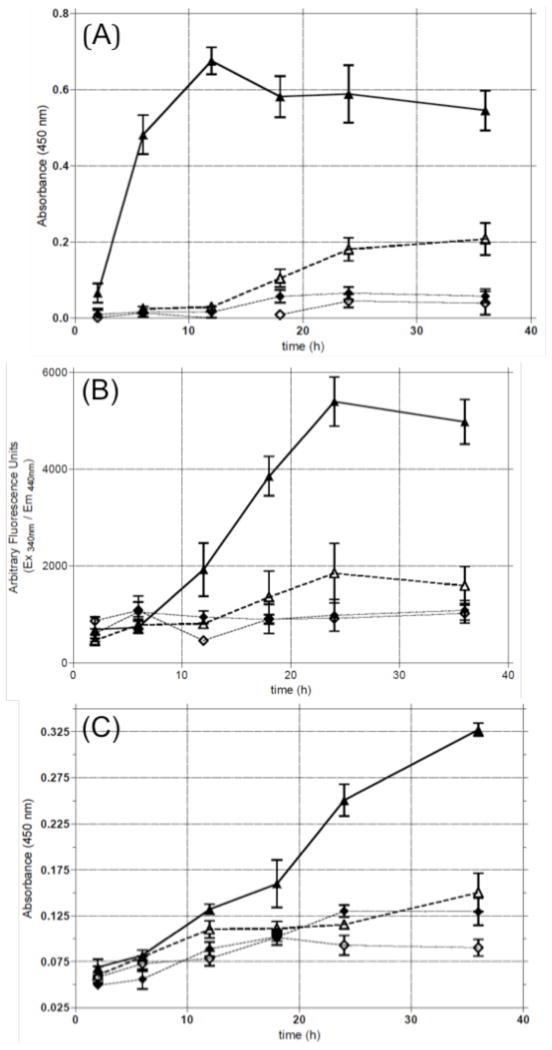
PARP rapidly binds to single-strand breaks, such as the 5′-p-dR termini produced during BER, and synthesizes poly(ADP-ribose) chains.41–43 The time course of PARP activation in repair of 3-mA reflects the stage in BER in which APE-1 produces a strand break 5′ of the abasic site created by MPG, which has no lyase activity. Therefore, the time course for PARP activation should be somewhat delayed relative to ARS formation. Little activation of PARP was observed after treating WT T98G cells with 80 μM 1 (Figure 8A). This concentration corresponds to the LD10 in the short-term toxicity assay (Figure 5A). At 250 μM, which corresponds to the LD50 concentration, PARP activation reached a maximum level at 12 h and remained elevated up to 18 h (Figure 8A).
Figure 8.
Time course for (A) PARP activation; (B) caspase-3 and -7 activation; and (C) cleavage of PARP in T98G WT cells: (◇) untreated; (◆) 0.2% DMSO; (△) 80 μM 1; (▲) 250 μM 1.
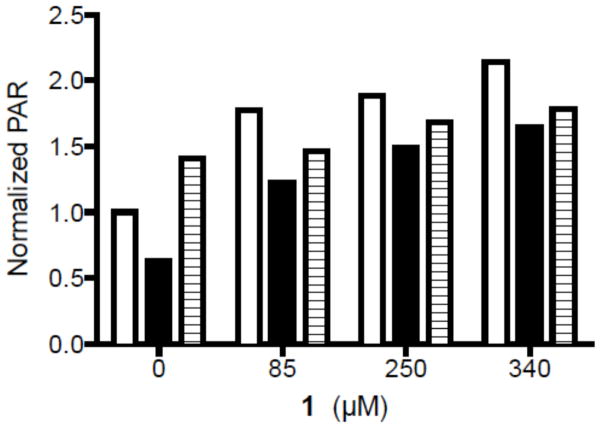
PARP activation by 1 was compared in the three cell lines. In WT and MPG+ cells treated with 1 there was a dose-dependent increase in PAR deposition vs. untreated cells. However, little change was observed in the MPG- knocked down cells treated with 1 (Figure 9). These data are consistent with the anticipated reduced rate of 3-mA lesions being converted into AP sites by MPG (Figure 7) and the subsequent APE1 mediated formation of 5′-dRP termini, which are substrates for PARP.
Figure 9.
Normalized PAR production in T98G glioma cells: wild type (WT, solid) and MPG over-expressing cells (MPG+, open columns) and MPG knockdown cells (MPG-, hatched) as a function of the concentration of 1.
Caspase-3 and -7 activation, which is associated with apoptosis, results in the inactivation of PARP.44–46 Therefore, caspase activity was monitored in the WT cells after treatment with 80 and 250 μM 1 (Figure 8B). Caspase activation, which starts to climb by 12 h and continued to rise through 18 h, was only observed at the 250 μM concentration of 1 indicating that the 80 μM concentration is not toxic under the assay conditions. As predicted, cleavage of PARP was only significant with the concentration of 1 that induces caspase activation (Figure 8C). Little effect was seen at the lower concentration of 1.
Replication tract analysis
There is in vitro evidence that 3-mA, as well as subsequent BER intermediates, can block DNA replication.23–26 To verify that this is the case in cells, a microfluidic-assisted replication tract analysis36 was performed in SF767 glioma cells treated with either 5 or 10 μM of 1. This assay uses antibodies to measure the length of replication tracts before exposure of cells to alkylating agent 1 by monitoring 5-iodo-dU incorporation and after exposure to 1 by monitoring 5-chloro-dU incorporation. If the agent blocks replication, the length of the DNA stained with the 5-chloro-dU antibody will be shortened. The 40 min exposure of the glioma cells to 5 μM 1 reduces clonogenic survival by 35%. The results appear in Figure 10 and show that track length at the 50 percentile was reduced from 7 μm for untreated control cells to 5.7 and 4.0 for the 5 and 10 μM concentrations of 1 (statistical difference with p = 0.001). The data provide evidence that the formation of 3-mA directly, or indirectly through BER intermediates, impedes replication fork progression.
Figure 10.
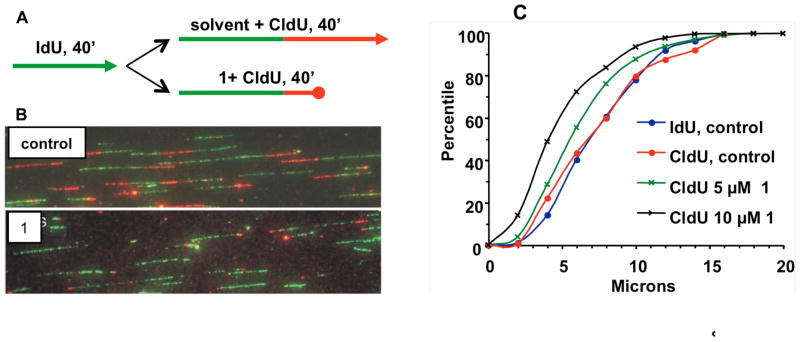
Microfluidic-assisted replication tract analysis (ma-RTA) of A172 glioma cells without and with 40 min exposure to 5 and 10 μM 1: (A) experimental design; (B) images of micro track capillaries; (C) percentile analysis of track length (μm) from B. The Kolmogorov–Smirnov (K–S) test was performed to determine P-values of different cumulative distributions.
DISCUSSION
Relationship Between DNA Methylation and DNA Binding
Methylating agent 1 was developed as a strategy to selectively and efficiently generate 3-mA lesions both in vitro and in vivo.13–18 The approach works quite well but we have sought to improve on the design. Of note is the very weak equilibrium binding for the initially synthesized 2-ring compound. Despite this weak binding,18 the alkylation pattern for 1 is very different from non-equilibrium binding methylating agents, e.g., methyl methanesulfonate (MMS), that predominantly yield the major groove adduct N7-methylguanine (7-mG).47 The in vitro ratio for 3-mA (minor groove) to 7-mG (major groove) is approximately 3-orders of magnitude higher for 1 or 7 vs. MMS. The methylation of DNA by 1 is clearly driven by the dipeptide binding in the minor groove to A/T rich regions and delivering the methyl group from the sulfonate ester.13,16–19 In the current study, efforts to enhance methylating activity by changing the C-terminal group to improve water solubility and/or DNA binding, were not successful. The major improvement came from adding another N-methylpyrrolecarboxamide subunit. In summary, the dipeptides have binding affinities above 1 mM. The extra pyrrole subunit in the tripeptides, which provides an additional H-bond and a VDW contact, and displaces additional minor groove waters, increases the binding by more than 10-fold. It is of interest that despite the higher binding affinity of the tripeptides for DNA and the higher levels of 3-mA that they produce (Figure 2A), the ratio of minor to major groove methylation does not radically differ (Figure 2B). The lack of a strong correlation between the specificity for minor groove methylation and minor groove binding affinity would suggest that the dipeptides preferentially populate the minor groove at A/T sequences, but do not make well organized enthalpic interactions (H-bonds, VDW contacts) required for detection by ICD, isothermal titration calorimetry (ITC) or TM experiments.
Mechanism of Action
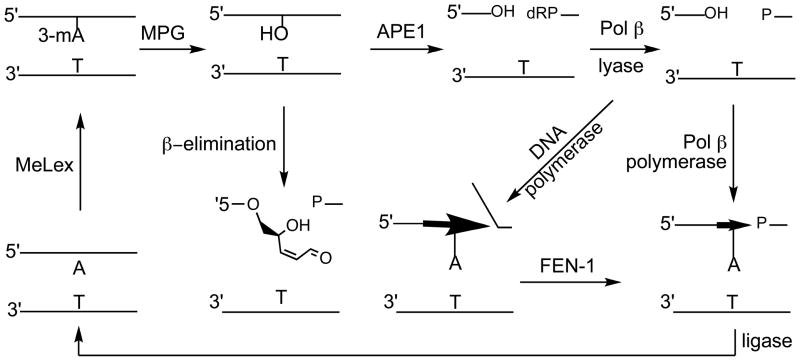
While the toxicity of the alkylating compounds used in the present study is highly associated with the yield of 3-mA, it remains unclear whether this lesion is directly responsible for the biological effects seen in cells. To further explore the mechanism(s) responsible for the toxicity, the compounds were evaluated in WT and alkA/tag glycosylase null E. coli cells. As expected, the WT cells were insensitive relative to the alkA/tag mutant due to efficient BER in the former.18 This implies that the failure to initiate BER leads to persistent toxic 3-mA adducts. We have previously reported that the alkA/tag mutant is more sensitive to dipeptide 1 than cells defective in AP endonuclease activity (apn null cells) suggesting that 3-mA is more deleterious than an abasic site or other downstream BER intermediates.17,18 The toxicity of 1 has been explored in WT S. cerevisiae and in a Mag1 glycosylase mutant (mag1), an AP endonuclease double mutant (apn1apn2) and a BER triple mutant (mag1apn1apn2).20 The apn1apn2 mutant was somewhat more sensitive to the toxicity of 1 than the mag1 cells, while the triple mutant was even more sensitive. A mag1rad14 double mutant yeast turned out surprisingly to be as sensitive to 1 as the mag1apn1apn2 triple mutant, while the rad14 single mutant showed no phenotype. This suggests an important role for nucleotide excision repair at some point in the processing of 3-mA, but only if the initial glycosylase step in BER is blocked (Figure 11).
Figure 11.
Repair of N3-methyladenine (3-mA) by base excision repair.
The story in the human cells is similar to that in E. coli and yeast. The T98G MPG- glioma cells, in which the human MPG protein that excises 3-mA is knocked down by 95%,32 are about 60% more sensitive to the toxicity of 1 vs. WT and MPG+ cells. This inverse correlation between the expression of the enzyme that removes 3-mA and the toxicity of 1 is consistent with the ARS data. The MPG- cells have significantly lower rates of formation and sustained levels of ARS than in the WT cells. Since the yield of 3-mA adducts produced by 1 and 7 should not be dependent on MPG levels, it is assumed that there will be more unrepaired 3-mA lesions in the MPG- cells. This would account for the lower ARS levels observed in these cells.
The fate of the unrepaired 3-mA adducts in the MPG- cells is unknown; however, the enhanced toxicity of 1 in the MPG knockdown cells indicates that 3-mA is either being converted by some process into a lethal intermediate or 3-mA directly blocks polymerases at replication forks. 3-mA can spontaneously depurinate, especially in single-stranded DNA, to yield an AP site. If this were the case, APE1 cleavage at the AP site would cause PARP activation similar to WT. This is not observed. We know 1 causes replication blocks in glioma cells exposed to low concentrations of 1 from the microfluidic-assisted replication tract analysis of cells treated with 1 for 40 min (Figure 10). Whether this is a direct effect or indirect effect of 3-mA remains to be determined, but it has been previously demonstrated that 3-mA and a stable analogue, 3-methyl-3-deazaadenine, directly block DNA polymerization in vitro.24–26
A significant sensitizing effect for the DNA methylating agents methyl methanesulfonate (MMS) (4-fold increase) and temozolomide (10-fold increase) has been reported in human mammary gland cells that over-express MPG.48 Over-expression of a catalytically defective MPG mutant did not sensitize cells to either MMS or temozolomide indicating the involvement of glycosylase activity. In contrast, the toxicity of 1 in the same MPG over-expressing cells was not enhanced vs. WT cells.48 As expected, the over-expression of MPG caused a significant increase in the rate of repair of 7-mG (3-mA levels were not followed) after MMS treatment. The authors suggested that the increase in toxicity was due to MPG mediated conversion of innocuous 7-mG lesions into toxic BER intermediates, e.g., abasic sites. Other cell lines over-expressing MPG are also sensitive to MMS.49 A similar modulation of MMS toxicity and mutagenicity was reported in CHO cells that over-express the rat MPG protein.50 To understand why the cellular level of MPG does not affect the toxicity of 1 and MMS in the same way, it is important to note that at equitoxic concentrations of MMS and 1 (based on their toxicity in WT cells), the yield of 7-mG adducts will be substantially higher with MMS than with 1. This is because of the difference in the ratio of 7-mG (non-toxic) to 3-mA (toxic): approximately 10:1 for MMS47 and 1:100 for 1. The conversion of non-toxic 7-mG to toxic intermediates by BER nicely explains the differential impact of MPG over-expression on MMS vs. 1.48
The level of ARS is also a function of APE-1 endonuclease activity that converts abasic sites into 5′-p-dR lesions, which retain the reactive aldehyde functionality (Figure 11). Because the number of APE-1 molecules in cells is estimated to be between 4–70 × 105 per cell,51 Pol β, and not APE-1 or MPG, is normally considered the rate limiting step in BER.52 However, antisense supression of MPG or APE-1 enhances the toxicity of 1 suggesting that unrepaired 3-mA is cytotoxic.53 We have also shown using a small molecule inhibitor of APE-1 that the level and persistence of ARS in WT T98G cells continues to increase through 12 h after treatment with 1,54 while the level falls off after 6 h in cells treated with 1 alone (Figure 7). The inhibition of APE-1 endonuclease activity synergistically enhanced the toxicity of 1 in T98G cells consistent with the toxicity of unrepaired abasic sites. Clearly, both unrepaired 3-mA, abasic sites or other BER intermediates are cytotoxic.
In summary, a number of minor groove alkylating compounds were prepared and evaluated based on their ability to bind to, and methylate DNA. As expected, there is direct relationship between DNA binding, formation of 3-mA and toxicity. Moreover, the rate and extent of excision of 3-mA by human MPG and the formation of ARS inversely correlate with toxicity. These data indicate that 3-mA can directly cause toxicity, most likely due to its ability to block DNA replication, and that there is no the need for it to be converted into a downstream BER intermediate.
Supplementary Material
Acknowledgments
We gratefully acknowledge Julia Sidorova (Department of Pathology, University of Washington) for her support and guidance on the microfluidic-assisted replication tract analysis assay.
FUNDING
This work was supported in part by National Institutes of Health grants CA29088 (BG), CA148629 (RWS) and GM087798 (RWS). Support for the UPCI Lentiviral Facility was provided by the Cancer Center Support Grant CA047904 from the National Institutes of Health.
ABBREVIATIONS
- AlkA
E. coli 3-methyladenine-DNA glycosylase II
- ARS
aldehyde reactive site
- BER
base excision repair
- CD
circular dichroism
- ICD
induced circular dichroism
- ITC
isothermal titration calorimetry
- 3-mA
N3-methyladenine
- 7-mG
N7-methylguanine
- MPG
(aka, AAG) methylpurine-DNA glycosylase
- MPG+
MPG overexpressing T98G cells
- MPG-
MPG knockdown T98G cells
- PARP
poly(ADP-ribose)polymerase
- TAG
E. coli 3-methyladenine DNA glycosylase I
- WT
wild type
Footnotes
RWS is a scientific consultant for Trevigen, Inc. The remaining authors state that there is no conflict of interest.
Synthetic details, NMR, MS spectra, HPLC traces, stability study details. This material is available free of charge via the Internet at http://pubs.acs.org.
References
- 1.Pratt WB, Ruddon RW, Ensminger WD, Maybaum J, editors. The Anticancer Drugs. 2. Oxford Press; New York: 1994. [Google Scholar]
- 2.see http://monographs.iarc.fr/ENG/Classification/
- 3.Shrivastav N, Li D, Essigmann JM. Chemical biology of mutagenesis and DNA repair: cellular responses to DNA alkylation. Carcinogenesis. 2010;31:59–70. doi: 10.1093/carcin/bgp262. [DOI] [PMC free article] [PubMed] [Google Scholar]
- 4.Marchesi F, Turriziani M, Tortorelli G, Avvisati G, Torino F, De Vecchis L. Triazene compounds: mechanism of action and related DNA repair systems. Pharmacol Res. 2007;56:275–287. doi: 10.1016/j.phrs.2007.08.003. [DOI] [PubMed] [Google Scholar]
- 5.Hijiya N, Hudson MM, Lensing S, Zacher M, Onciu M, Behm FG, Razzouk BI, Ribeiro RC, Rubnitz JE, Sandlund JT, Rivera GK, Evans WE, Relling MV, Pui CH. Cumulative incidence of secondary neoplasms as a first event after childhood acute lymphoblastic leukemia. J Am Med Assoc. 2007;297:1207–1215. doi: 10.1001/jama.297.11.1207. [DOI] [PubMed] [Google Scholar]
- 6.Hijiya N, Ness KK, Ribeiro RC, Hudson MM. Acute leukemia as a secondary malignancy in children and adolescents: current findings and issues. Cancer. 2009;115:23–35. doi: 10.1002/cncr.23988. [DOI] [PMC free article] [PubMed] [Google Scholar]
- 7.Türk D, Szakács G. Relevance of multidrug resistance in the age of targeted therapy. Curr Opin Drug Discov Devel. 2009;12:246–252. [PubMed] [Google Scholar]
- 8.Baumert C, Hilgeroth A. Recent advances in the development of P-gp inhibitors. Anticancer Agents Med Chem. 2009;9:415–436. doi: 10.2174/1871520610909040415. [DOI] [PubMed] [Google Scholar]
- 9.Gangemi R, Paleari L, Orengo AM, Cesario A, Chessa L, Ferrini S, Russo P. Cancer stem cells: a new paradigm for understanding tumor growth and progression and drug resistance. Curr Med Chem. 2009;16:1688–1703. doi: 10.2174/092986709788186147. [DOI] [PubMed] [Google Scholar]
- 10.Baguley BC. Multiple drug resistance mechanisms in cancer. Mol Biotechnol. 2010;46:308–316. doi: 10.1007/s12033-010-9321-2. [DOI] [PubMed] [Google Scholar]
- 11.Liu J, Powell KL, Thames HD, MacLeod MC. Detoxication of sulfur half-mustards by nucleophilic scavengers: robust activity of thiopurines. Chem Res Toxicol. 2010;23:488–496. doi: 10.1021/tx900190j. [DOI] [PMC free article] [PubMed] [Google Scholar]
- 12.Abel EL, Bubel JD, Simper MS, Powell L, McClellan SA, Andreeff M, MacLeod MC, DiGiovanni J. Protection against 2-chloroethyl ethyl sulfide (CEES)-induced cytotoxicity in human keratinocytes by an inducer of the glutathione detoxification pathway. Toxicol Appl Pharmacol. 2010;255:176–183. doi: 10.1016/j.taap.2011.06.012. [DOI] [PubMed] [Google Scholar]
- 13.Zhang Y, Chen FX, Mehta P, Gold B. The design of groove and sequence selective alkylation of DNA by sulfonate esters tethered to lexitropsins. Biochemistry. 1993;32:7954–7965. doi: 10.1021/bi00082a017. [DOI] [PubMed] [Google Scholar]
- 14.Encell L, Shuker DEG, Foiles PG, Gold B. The in vitro methylation of DNA by a minor groove binding methyl sulfonate ester. Chem Res Toxicol. 1996;9:563–567. doi: 10.1021/tx9501849. [DOI] [PubMed] [Google Scholar]
- 15.Kelly J, Shah D, Chen FX, Wurdeman R, Gold B. Quantitative and qualitative analysis of DNA methylation at N3-adenine by N-methyl-N-nitrosourea and dimethyl sulfate. Chem Res Toxicol. 1998;11:1481–1486. doi: 10.1021/tx9801763. [DOI] [PubMed] [Google Scholar]
- 16.Varadarajan S, Shah D, Dande P, Settles S, Chen FX, Fronza G, Gold B. DNA damage and cytotoxicity induced by minor groove binding methyl sulfonate esters. Biochemistry. 2003;42:14318–14327. doi: 10.1021/bi0353272. [DOI] [PubMed] [Google Scholar]
- 17.Shah D, Gold B. Evidence in Escherichia coli that N3-methyladenine lesions and cytotoxicity induced by a minor groove binding methyl sulfonate ester can be modulated in vivo by netropsin. Biochemistry. 2003;42:12610–12616. doi: 10.1021/bi035315g. [DOI] [PubMed] [Google Scholar]
- 18.Shah S, Kelly J, Zhang Y, Dande P, Martinez J, Ortiz G, Fronza G, Tran H, Soto MA, Marky L, Gold B. Evidence in Escherichia coli that N3-methyladenine lesions induced by a minor groove binding methyl sulfonate ester can be processed by both base and nucleotide excision repair. Biochemistry. 2001;40:1796–1803. doi: 10.1021/bi0024658. [DOI] [PubMed] [Google Scholar]
- 19.Kelly J, Inga A, Chen FX, Dande P, Shah D, Monti P, Aprile A, Burns PA, Scott G, Abbondandolo A, Gold B, Fronza G. Relationship between DNA methylation and mutational patterns induced by a sequence selective minor groove methylating agents. J Biol Chem. 1999;274:18327–18334. doi: 10.1074/jbc.274.26.18327. [DOI] [PubMed] [Google Scholar]
- 20.Monti PA, Campomenosi P, Iannone R, Ciribilli Y, Iggo R, Scott G, Burns PA, Shah D, Menichini P, Abbondandolo A, Gold B, Fronza G. Influences of base excision repair defects on the lethality and mutagenesis induced by Me-lex, a sequence selective N3-adenine methylating agent. J Biol Chem. 2002;277:28663–28668. doi: 10.1074/jbc.M203384200. [DOI] [PubMed] [Google Scholar]
- 21.Monti P, Iannon R, Campomenosi P, Ciribilli Y, Robbiano A, Varadarajan S, Shah D, Menichini P, Gold B, Fronza G. Nucleotide excision repair defect influences lethality and mutagenicity induced by Me-lex, a sequence-selective N3-adenine methylating agent in the absence of base excision repair. Biochemistry. 2004;43:5592–2299. doi: 10.1021/bi035968x. [DOI] [PubMed] [Google Scholar]
- 22.Monti P, Ciribilli Y, Russo D, Bisio A, Perfumo C, Andreotti V, Menichini P, Inga A, Huang X, Gold B, Fronza G. REV1 and Polζ influence toxicity and mutagenicity of Me-lex, a sequence selective N3-adenine methylating agent. DNA Repair. 2008;7:431–438. doi: 10.1016/j.dnarep.2007.11.015. [DOI] [PMC free article] [PubMed] [Google Scholar]
- 23.Boiteux S, Huisman O, Laval J. 3-Methyladenine residues in DNA induce the SOS function sfiA in Escherichia coli. EMBO J. 1984;3:2569–2573. doi: 10.1002/j.1460-2075.1984.tb02175.x. [DOI] [PMC free article] [PubMed] [Google Scholar]
- 24.Larson K, Sahm J, Shenkar R, Strauss B. Methylation-induced blocks to in vitro DNA replication. Mutat Res. 1985;150:77–84. doi: 10.1016/0027-5107(85)90103-4. [DOI] [PubMed] [Google Scholar]
- 25.Plosky BS, Frank EG, Berry DA, Vennall GP, McDonald JP, Woodgate R. Eukaryotic Y-family polymerases bypass a 3-methyl-2′-deoxyadenosine analog in vitro and methyl methanesulfonate-induced DNA damage in vivo. Nucleic Acids Res. 2008;36:2152–2162. doi: 10.1093/nar/gkn058. [DOI] [PMC free article] [PubMed] [Google Scholar]
- 26.Settles Wang R-W, Fronza G, Gold B. Effect of N3-Methyladenine and an isosteric stable analogue on DNA polymerization. J Nucleic Acids. 2010:426505. doi: 10.4061/2010/426505. [DOI] [PMC free article] [PubMed] [Google Scholar]
- 27.Monti P, Broxson C, Inga A, Wang RW, Menichini P, Tornaletti S, Gold B, Fronza G. 3-Methyl-3-deazaadenine, a stable isostere of N3-methyl-adenine, is efficiently bypassed by replication in vivo and by transcription in vitro. DNA Repair. 2011;10:861–868. doi: 10.1016/j.dnarep.2011.05.005. [DOI] [PMC free article] [PubMed] [Google Scholar]
- 28.Tang JB, Svilar D, Trivedi RN, Wang XH, Goellner EM, Moore B, Hamilton RL, Banze LA, Brown AR, Sobol RW. N-methylpurine DNA glycosylase and DNA polymerase beta modulate BER inhibitor potentiation of glioma cells to temozolomide. Neuro Oncol. 2011;13:471–486. doi: 10.1093/neuonc/nor011. [DOI] [PMC free article] [PubMed] [Google Scholar]
- 29.[Tang J, Goellner EM, Wang XW, Trivedi RN, St Croix CM, Jelezcova E, Svilar D, Brown AR, Sobol RW. Bioenergetic metabolites regulate base excision repair-dependent cell death in response to DNA damage. Mol Cancer Res. 2010;8:67–79. doi: 10.1158/1541-7786.MCR-09-0411. [DOI] [PMC free article] [PubMed] [Google Scholar]
- 30.Mutamba JT, Svilar D, Prasongtanakij S, Wang XH, Lin YC, Dedon PC, Sobol RW, Engelward BP. XRCC1 and base excision repair balance in response to nitric oxide. DNA Repair. 2011;10:1282–1293. doi: 10.1016/j.dnarep.2011.10.008. [DOI] [PMC free article] [PubMed] [Google Scholar]
- 31.Svilar D, Vens C, Sobol RW. Quantitative, real-time analysis of base excision repair activity in cell lysates utilizing lesion-specific molecular beacons. J Vis Exp. 2012;66:e4168. doi: 10.3791/4168. [DOI] [PMC free article] [PubMed] [Google Scholar]
- 32.Svilar D, Dyavaiah M, Brown AR, Tang JB, Li J, McDonald PR, Shun TY, Braganza A, Wang XH, Maniar S, St Croix CM, Lazo JS, Pollack IF, Begley TJ, Sobol RW. Mol Cancer Res. 2012 doi: 10.1158/1541-7786.MCR-12-0168. [Epub ahead of print. [DOI] [PMC free article] [PubMed] [Google Scholar]
- 33.Baird EE, Dervan PB. Solid phase synthesis of polyamides containing imidazole and pyrrole amino acids. J Am Chem Soc. 1996;118:6141–6146. doi: 10.1021/ol0156796. [DOI] [PubMed] [Google Scholar]
- 34.Wurtz NR, Turner JM, Baird EE, Dervan PB. Fmoc solid phase synthesis of polyamides containing pyrrole and imidazole amino acids. Org Lett. 2001;3:1201–1203. doi: 10.1021/ol0156796. [DOI] [PubMed] [Google Scholar]
- 35.Garbett NC, Ragazzon PA, Chaires JB. Circular dichroism to determine binding mode and affinity of ligand-DNA interactions. Nat Protoc. 2007;2:3166–3172. doi: 10.1038/nprot.2007.475. [DOI] [PubMed] [Google Scholar]
- 36.Sidorova JM, Li N, Schwartz DC, Folch A, Monnat RJ., Jr Microfluidic-assisted analysis of replicating DNA molecules. Nat Protoc. 2009;4:849–861. doi: 10.1038/nprot.2009.54. [DOI] [PMC free article] [PubMed] [Google Scholar]
- 37.Kubo K, Ide H, Wallace SS, Kow YW. A novel, sensitive, and specific assay for abasic sites, the most commonly produced DNA lesion. Biochemistry. 1992;31:3703–3708. doi: 10.1021/bi00129a020. [DOI] [PubMed] [Google Scholar]
- 38.Kow YW, Dare A. Detection of abasic sites and oxidative DNA base damage using an ELISA-like assay. Methods. 2000;22:164–169. doi: 10.1006/meth.2000.1057. [DOI] [PubMed] [Google Scholar]
- 39.Nakamura J, Walker VE, Upton PB, Chiang SY, Kow YW, Swenberg JA. Highly sensitive apurinic/apyrimidinic site assay can detect spontaneous and chemically induced depurination under physiological conditions. Cancer Res. 1998;58:222–225. [PubMed] [Google Scholar]
- 40.Bennett SE, Kitner J. Characterization of the aldehyde reactive probe reaction with AP-sites in DNA: influence of AP-lyase on adduct stability. Nucleosides Nucleotides Nucleic Acids. 2006;25:823–842. doi: 10.1080/15257770600726133. [DOI] [PMC free article] [PubMed] [Google Scholar]
- 41.Dantzer F, Schreiber V, Niedergang C, Trucco C, Flatter E, De La Rubia G, Oliver J, Rolli V, Ménissier-de Murcia J, de Murcia G. Involvement of poly(ADP-ribose) polymerase in base excision repair. Biochimie. 1999;81:69–75. doi: 10.1016/s0300-9084(99)80040-6. [DOI] [PubMed] [Google Scholar]
- 42.Khodyreva SN, Prasad R, Ilina ES, Sukhanova MV, Kutuzov MM, Liu Y, Hou EW, Wilson SH, Lavrik OI. Apurinic/apyrimidinic (AP) site recognition by the 5′-dRP/AP lyase in poly(ADP-ribose) polymerase-1 (PARP-1) Proc Natl Acad Sci USA. 2010;107:22090–22095. doi: 10.1073/pnas.1009182107. [DOI] [PMC free article] [PubMed] [Google Scholar]
- 43.Eustermann S, Videler H, Yang JC, Cole PT, Gruszka D, Veprintsev D, Neuhaus D. The DNA-binding domain of human PARP-1 interacts with DNA single-strand breaks as a monomer through its second zinc finger. J Mol Biol. 2011;407:149–170. doi: 10.1016/j.jmb.2011.01.034. [DOI] [PMC free article] [PubMed] [Google Scholar]
- 44.Lazebnik YA, Kaufmann SH, Desnoyers S, Poirier GG, Earnshaw WC. Cleavage of poly(ADP-ribose) polymerase by a proteinase with properties like ICE. Nature. 1994;371:346–347. doi: 10.1038/371346a0. [DOI] [PubMed] [Google Scholar]
- 45.Nicholson DW, Thornberry NA. Caspases: killer proteases. Trends Biochem Sci. 1997;22:299–306. doi: 10.1016/s0968-0004(97)01085-2. [DOI] [PubMed] [Google Scholar]
- 46.Germain M, Affar EB, D’Amours D, Dixit VM, Salvesen GS, Poirier GG. Cleavage of automodified poly(ADP-ribose) polymerase during apoptosis. Evidence for involvement of caspase-7. J Biol Chem. 199;274:28379–28384. doi: 10.1074/jbc.274.40.28379. [DOI] [PubMed] [Google Scholar]
- 47.Beranek DT, Weis CC, Swenson DH. A comprehensive quantitative analysis of methylated and ethylated DNA using high pressure liquid chromatography. Carcinogenesis. 1980;1:595–606. doi: 10.1093/carcin/1.7.595. [DOI] [PubMed] [Google Scholar]
- 48.Rinne ML, He Y, Pachkowski BF, Nakamura J, Kelley MR. N-methylpurine DNA glycosylase overexpression increases alkylation sensitivity by rapidly removing non-toxic 7-methylguanine adducts. Nucleic Acids Res. 2005;33:2859–2867. doi: 10.1093/nar/gki601. [DOI] [PMC free article] [PubMed] [Google Scholar]
- 49.Goellner EM, Grimme B, Brown AR, Lin YC, Wang XH, Sugrue KF, Mitchell L, Trivedi RN, Tang JB, Sobol RW. Overcoming temozolomide resistance in glioblastoma via dual inhibition of NAD+ biosynthesis and base excision repair. Cancer Res. 2011;71:2308–2317. doi: 10.1158/0008-5472.CAN-10-3213. [DOI] [PMC free article] [PubMed] [Google Scholar]
- 50.Calléja F, Jansen JG, Vrieling H, Laval F, van Zeeland AA. Modulation of the toxic and mutagenic effects induced by methyl methanesulfonate in Chinese hamster ovary cells by overexpression of the rat N-alkylpurine DNA-glycosylase. Mutat Res. 1999;425:185–194. doi: 10.1016/s0027-5107(99)00034-2. [DOI] [PubMed] [Google Scholar]
- 51.Chen DS, Herman T, Demple B. Two distinct human DNA diesterases that hydrolyze 3′-blocking deoxyribose fragments from oxidized DNA. Nucleic Acids Res. 1991;19:5907–5914. doi: 10.1093/nar/19.21.5907. [DOI] [PMC free article] [PubMed] [Google Scholar]
- 52.Srivastava DK, Vande Berg BJ, Prasad R, Molina JT, Beard WA, Tomkinson AE, Wilson SH. Mammalian abasic site base excision repair. Identification of the reaction sequence and rate-determining steps. J Biol Chem. 1998;273:21203–21209. doi: 10.1074/jbc.273.33.21203. [DOI] [PubMed] [Google Scholar]
- 53.Bobola MS, Varadarajan S, Smith NW, Goff RD, Kolstoe DD, Blank A, Gold B, Silber JR. Human glioma cell sensitivity to the sequence-specific alkylating agent methyl-lexitropsin. Clin Cancer Res. 2007;13:612–620. doi: 10.1158/1078-0432.CCR-06-1127. [DOI] [PubMed] [Google Scholar]
- 54.Srinivasan A, Wang L, Cline CJ, Xie Z, Sobol RW, Xie X-Q, Gold B. The identification and characterization of human AP endonuclease-1 inhibitors. Biochemistry. 2012;51:6246–6259. doi: 10.1021/bi300490r. [DOI] [PMC free article] [PubMed] [Google Scholar]
Associated Data
This section collects any data citations, data availability statements, or supplementary materials included in this article.


