Abstract
In this paper, we investigate computationally the oscillatory tank-treading motion of healthy swollen human erythrocytes (owing to lower, than physiological, plasma osmolarity) in shear flows with capillary number Ca = O(1) and small to moderate viscosity ratios 0.01 ≤ λ ≤ 2.75. Swollen cells show similar shear flow dynamics with normal cells but with significantly higher inclination and tank-treading speed owing to the higher cell thickness. For a given viscosity ratio, as the flow rate increases, the steady-state erythrocyte length L (in the shear plane) increases logarithmically while its depth W (normal to the shear plane) decreases logarithmically; increase of the viscosity ratio results in lower cell deformation. The erythrocyte width S, which exists in the shear plane, is practically invariant in time, flow rate and viscosity ratio, and corresponds to a real cell thickness of about 2.5 μm at physiological osmolarity (300 mO) and 3.4 μm at an osmolarity of 217 mO. The erythrocyte inclination decreases as the flow rate increases or as the surrounding fluid viscosity decreases, owing to the increased inner rotational flow which tends to align the cell toward the flow direction. The ektacytometry deformation of swollen cells increases logarithmically with the shear stress but with a slower slope than that for normal cells owing mainly to the higher orientation of the more swollen cells. As the cell swelling increases, the tank-treading period decreases owing to the higher thickness of the actual cell which overcomes the opposite action of the reduced shape-memory effects (i.e. the more spherical-like erythrocyte’s reference shape of shearing resistance). The local-area incompressibility tensions from the lipid bilayer increase with the cell swelling and cause a higher cytoskeleton prestress; this increased prestress results in smaller, but still measurable, local-area changes on the spectrin skeleton of the more swollen erythrocytes. Our work provides insight on the effects of clinical syndromes and biophysical processes associated with lowered plasma osmolarity (and thus higher cell swelling) such as inappropriate antidiuretic hormone secretion and diuretic therapy.
1. INTRODUCTION
The flow dynamics of red blood cells has long been recognized as a fundamental problem in physiology and biomechanics owing to the main function of these cells to exchange oxygen and carbon dioxide with the tissues in blood capillaries [1, 2]. Since the work of Fischer, Stöhr-Liesen and Schmid-Schönbein [3], it has been known that the erythrocytes elongate and orient to an ellipsoidal-like shape while their membrane tank-treads around the cell when the cells are subjected to a moderate or strong shear flow in a more viscous suspending liquid. By employing a cell imaging method parallel to the shear plane, Abkarian, Faivre and Viallat [4] found that at low shear stress (μG ≈ 0.1 Pa) erythrocytes present an oscillation of their inclination (which they called swinging motion) superimposed to the long-observed steady tank-treading motion. Based on these experimental observations, low degree-of-freedom theoretical models were developed to describe the tank-treading, swinging and tumbling motion of non-spherical capsules, such as erythrocytes, in shear flows [4, 5]. In addition, these findings have motivated computational studies on the shear flow oscillatory dynamics of erythrocytes at physiological osmolarity, e.g. [6–8].
In this paper, we investigate computationally the effects of swelling on the oscillatory tank-treading motion of healthy human erythrocytes in shear flows. When the osmolarity of the surrounding medium decreases (from its physiological value of 300 mO), the erythrocyte volume increases under conditions of constant surface area until the cell obtains a spherical shape; further decrease of the solution osmolarity causes additional increase of the volume and surface area of the spherical cell [9].
We emphasize that lowered plasma osmolarity is found in several clinical syndromes including inappropriate antidiuretic hormone secretion and diuretic therapy [10]. As reported in the earlier study [10], the swollen erythrocytes may, in general, produce some difficulties in the blood capillary or splenic passage but the aforementioned conditions are not associated with impairment of oxygen transport or hemolysis of clinical significance. It is of interest to note that swollen erythrocytes have been employed during the encapsulation of non-diffusible drugs into human erythrocytes (used for drug delivery and targeting) [11]. Swollen erythrocytes have also been used to investigate the adhesion and the dynamics of unbinding of red blood cells to solid surfaces [12, 13]. In addition, our work provides insight on the tank-treading dynamics of non-spherical elastic capsules with different degrees of swelling.
2. MATHEMATICAL FORMULATION AND COMPUTATIONAL ALGORITHM
In healthy blood and in the absence of flow, the average human erythrocyte assumes a biconcave discoid shape of surface area Sc = 135 μm2 whose dimensions and volume depend on the osmolarity of the surrounding liquid. Working with experimental observations from interference microscopy, Evans and Fung [9] found that the average human erythrocyte volume increases from Vc = 94 μm3 at physiological osmolarity (300 mO) to Vc = 116 μm3 at an osmolarity of 217 mO. The authors also provided the following equation to describe the half-thickness f(r) as a function of the radial distance r from the central axis of symmetry
| (1) |
At physiological osmolarity (300 mO), R0 = 3.91 μm, C0 = 0.81 μm, C2 = 7.83 μm, and C4 = −4.39 μm [9]; these cells are called normal erythrocytes in the present paper. At the reduced osmolarity of 217 mO, R0 = 3.80 μm, C0 = 2.10 μm, C2 = 7.58 μm, and C4 = −5.59 μm [9]; these cells are called swollen erythrocytes in the present paper.
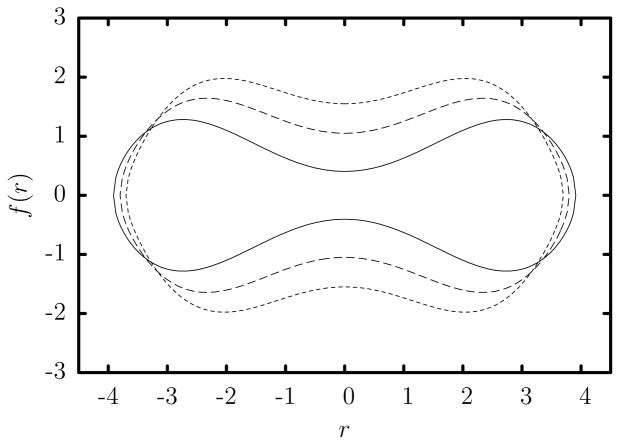
To be able to determine the effects of additional swelling at lower osmolarity, we define the extra swollen erythrocyte with the same surface area (i.e. Sc = 135 μm2) and higher volume Vc = 130.5 μm3 by using R0 = 3.7 μm, C0 = 3.1 μm, C2 = 7.4 μm, and C4 = −6.59 μm. The cross-section of these three types of erythrocytes are shown in figure 1. It is of interest to note that for these cells C2 ≈ 2 R0 while swelling reduces slightly the cell length R0 and increases significantly the cell thickness. Furthermore, in this work we define the characteristic length scale a of an erythrocyte based on its volume, i.e. Vc = 4/3πa3, and thus a = 2.82, 3.03, 3.15 μm for normal, swollen and extra swollen erythrocytes, respectively. Note that a spherical cell with surface area Sc = 135 μm2 has volume Vc = 147.8 μm3 and a radius of a = 3.28 μm.
FIG. 1.
Cross-section of the average erythrocyte (in units of μm) at physiological osmolarity (300 mO) and at an osmolarity of 217 mO, as found by Evans and Fung [9]. Also shown is the cross-section of an extra swollen erythrocyte. The cell thickness increases with the swelling.
In our computations, the shape given by Eq. (1) for a specific swelling is employed as the elastic reference shape (i.e. the shape of the erythrocyte under quiescent conditions), in agreement with experimental findings which have demonstrated the erythrocyte shape memory, i.e. the fact that after tank-treading an erythrocyte will always reform its two dimples in the same distinct loci on the membrane [14]. We note that the same assumption is commonly employed by computational studies for the dynamics of erythrocytes at physiological osmolarity, e.g. [6, 8], while there is no (conceptual) difference in studying erythrocytes at different osmolarities.
To describe the erythrocyte dynamics in a simple shear flow u∞ = G (z, 0, 0) (where G is the shear rate) in the Stokes regime, we utilize our recently developed non-stiff cytoskeleton-based continuum erythrocyte modeling [8, 15] and our interfacial spectral boundary element algorithm for membranes [16]. The problem’s dimensionless parameters include the capillary number Ca = μ G a/Gs (i.e. the ratio of viscous forces in the surrounding fluid to shearing forces in the membrane), and the viscosity ratio λ = μc/μ. Here Gs is the membrane shear modulus, μ is the viscosity of the surrounding liquid and μc is the cytoplasm viscosity which usually varies in the range μc ≈ 6–10 mPa s [17].
3. TANK-TREADING OF SWOLLEN ERYTHROCYTES IN SHEAR FLOWS
In this paper we investigate computationally the tank-treading motion of a swollen and extra swollen erythrocyte in a simple shear flow for capillary numbers Ca = 0.75–4 and small to moderate viscosity ratios 0.01 ≤ λ ≤ 2.75. These conditions correspond to a wide range of medium viscosities μ (2 to 600 mPa s) and shear rates G (1 to 760 s−1), and match those used in ektacytometry and rheoscopy systems [3, 18, 19]. The Reynolds number for both the surrounding and the cytoplasm flows is always negligible owing to the cell’s small size.
After an initial transient period, the erythrocyte assumes an inclined ellipsoidal conformation owing to the extensional component of the shear flow which extends the cell to an ellipsoidal-like shape and tries to align it with the flow’s principal direction at 45° as seen in figure 2(c) below. In addition the erythrocyte membrane tank-treads around the cell owing to the rotational component of the shear flow, as found in experimental systems, e.g. [3, 19, 20]. The shape and inclination of swollen erythrocytes show periodic oscillations over time with a period equal to half the period of the tank-treading motion, owing to their non-spherically symmetric quiescent shape, as also found for normal cells [4, 8, 15].
FIG. 2.
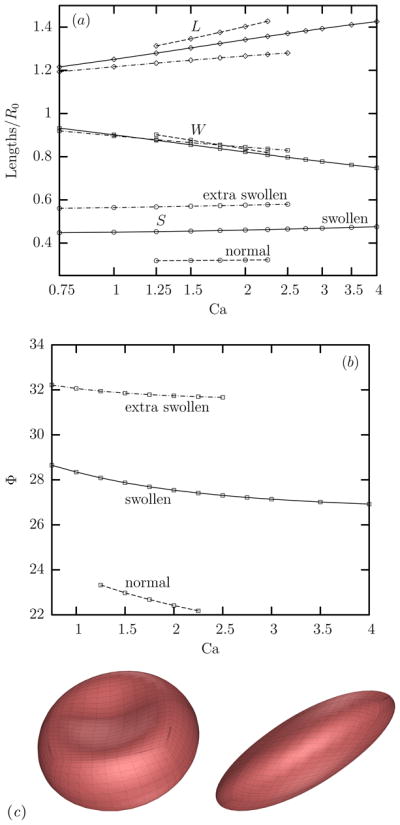
(Color online) (a) The average value at steady state of the erythrocyte’s semi-lengths L (◇), S (○) and W (□) as a function of the capillary number Ca in a linear-log plot for normal (- - -), swollen (—–) and extra swollen (– · –) erythrocytes at viscosity ratio λ = 0.1. (b) As in (a) but for the erythrocyte’s orientation angle Φ. (c) The shape of the swollen erythrocyte at time G t = 0, 2 for Ca = 1.5 and λ = 0.1.
To describe the erythrocyte deformation, we determine the cell’s semi-axes (i.e. length L, width S and depth W) as the semi-axes of the ellipsoid which has the same inertia tensor as that of the erythrocyte [8, 16]. In addition, we monitor the cell orientation Φ (in degrees) defined as the angle between the longest semi-axis L and the flow direction, i.e. the x-axis.
A. Effects of the Flow Strength and the Viscosity Ratio
Figure 2(a) shows the average value at steady state of the erythrocyte’s lengths over a range of capillary numbers for λ = 0.1 and for the three types of erythrocytes considered in this work. As for normal cells, the length L and depth W of swollen erythrocytes vary logarithmically with the flow rate as also found for the cell deformation in ektacytometry systems, e.g. [18]. Swelling reduces the scaled length L/R0 and has minor effects on the scaled depth W/R0 of the cells. In addition, swelling increases significantly the width S of the erythrocyte; however this thickness does not practically vary with the flow rate. The cell width has a normalized magnitude of approximately S/R0 = 0.32, 0.45, 0.57 for normal, swollen and extra swollen erythrocytes, respectively, which corresponds to a real cell thickness of about 2.5, 3.4, 4.2 μm for the three types of erythrocytes considered in this work.
Swelling increases considerably the erythrocyte’s orientation angle Φ as shown in figure 2(b) while the orientation of swollen cells does not reduce as fast with the flow rate as for normal cells. The increased orientation angle of the more swollen cells for a given flow rate is to be expected owing to their more spherical-like shape; thus in this case the shear flow tries to orient them to be more aligned with the principal direction at 45° of the extensional component of the shear flow. It is of interest to note that the increased orientation with the cell swelling is not restricted to erythrocytes but also represents other deformable objects such as vesicles where a similar behavior was found [21]. For all types of cells as the flow rate increases, the increased rotational component of the shear flow tends to decrease the cell orientation toward the flow direction at 0°. For the case depicted in figure 2(b) the viscosity ratio is low (i.e. λ = 0.1) and thus the weak inner flow causes only a small decrease of the cell orientation as the shear flow increases.
Increasing the viscosity ratio λ has little effects on the dimensions of the tank-treading swollen erythrocytes as also found for normal cells from our earlier work [8]. However, increasing the viscosity ratio λ reduces significantly the orientation angle Φ of the swollen cells as well as the amplitude of the angle oscillations ΔΦ (i.e. the swinging effects), as shown in figure 3.
FIG. 3.
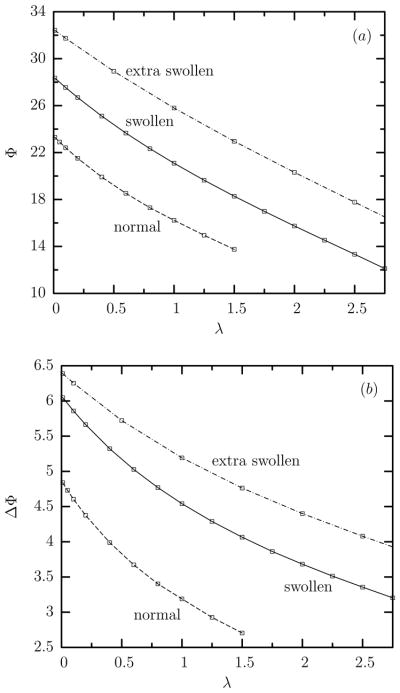
Time-average (a) orientation angle Φ and (b) amplitude of the angle oscillations ΔΦ at steady state versus the viscosity ratio λ for swollen, extra swollen and normal erythrocytes at capillary number Ca = 2.
The decreasing orientation Φ of all types of cells with the viscosity ratio λ can be understood based on the increased contribution of the inner flow (owing to the relatively higher inner viscosity) and thus the increased strength of the rotational component of the inner circulation, which tends to align the cells toward the flow direction at 0°, as also found for droplets, capsules, and vesicles in shear flows [21–23].
B. Ektacytometry and Rheoscopy Systems
Ektacytometry systems have been developed to measure the deformability and tank-treading speed of the erythrocyte by observing the deformation behavior of individual cells, or average deformabilities for populations of cells (see, e.g. [18, 24]). In these devices the flow pattern is a simple shear flow while the deformed erythrocyte is not observed in the plane of shear but from above the shear plate device. In our computations, u∞ = G(z, 0, 0) and thus the plane of shear is the xz-plane. In our terminology, we can say that ektacytometry observes the deformed erythrocyte projected as an ellipse on the xy-plane. The deformation parameter computed from the largest and smallest semi-axes of this ellipse, Lx and Ly respectively, and reported by researchers using ektacytometry, will be denoted Dxy. Note that Dxy = (Lx − Ly)/(Lx +Ly) while Lx = L cos Φ and Ly = W when the erythrocyte shape is a perfect ellipsoid. Since ektacytometry does not follow individual cells over time but uses a large number of them, and since the erythrocytes’ shape oscillates with time in a shear flow, the experimentally reported deformation Dxy corresponds to the average value of the cells deformation in the xy-plane over time and over the erythrocyte population.
Figure 4(a) shows that our computations capture very accurately the relationship of the ektacytometry deformation Dxy with the flow rate Ca for normal cells, including the logarithmic dependence with identical slope and the value of the membrane’s shear modulus at low strains [25], as discussed in our earlier publications [8, 15]. In addition, this figure reveals that the ektacytometry deformation Dxy of swollen cells also increases logarithmically with the capillary number Ca but with a slower slope than that for normal cells. Increasing further the cell swelling causes further reduction in the logarithmic slope of the Dxy-versus-Ca dependence as seen for the extra swollen cells. It is of interest to note that Clark et al. [24] also found experimentally that reduced osmolarity decreases the erythrocyte ektacytometry deformation by subjecting red cells to a constant high shear stress (17 Pa) at a low viscosity ratio λ and varying continuously the suspension osmolarity, as seen in their figure 1.
FIG. 4.
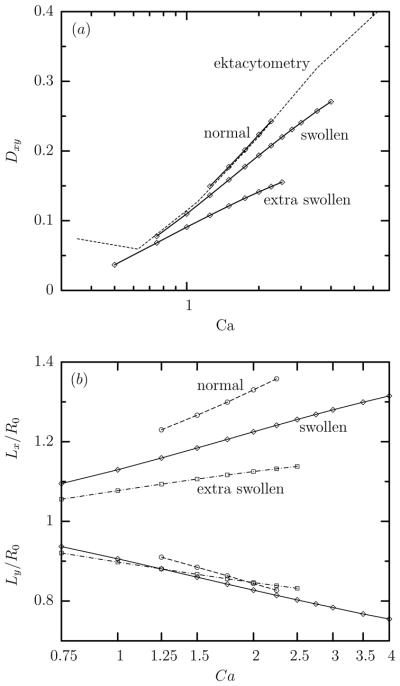
(a) The average value at steady state of the ektacytometry deformation Dxy versus the capillary number Ca for normal, swollen and extra swollen erythrocytes in a linear-log plot for viscosity ratio λ = 0.1. (b) As in (a) but for the ektacytometry projection semi-lengths Lx and Ly. Also included in (a) are the experimental findings (dashed lines) reported in figure 3 of Hardeman et al. [18] which have been converted to the capillary number domain using Gs = 2.4 μN/m and μc = 6 mPa s [15, 25].
The slower increase of the ektacytometry deformation of swollen erythrocytes with the flow rate may be attributed mainly to the increased orientation Φ of these cells in shear flows, shown earlier in figures 2 and 3, which affects significantly the ektacytometry length Lx as seen in figure 4(b).
Rheoscopes have been employed to measure the tank-treading speed of erythrocytes in shear flows via the aid of small beads attached to the cell membrane (see, e.g. [3, 19]). This quantity is of great physical interest being associated with the dissipation of energy during the tank-treading motion [5, 21, 26].
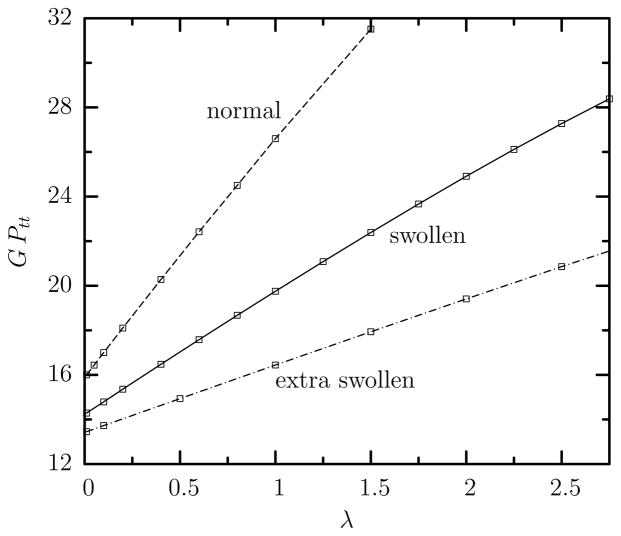
In our earlier work [15] we verified that the tank-treading frequency Ftt increases linearly with the shear rate G as first reported in the experimental work of Fischer and co-workers [3, 19]. In addition, our computations revealed that the tank-treading period GPtt of normal cells increases linearly with the viscosity ratio λ. This dependence is also valid for swollen cells but the slope of the linear increase of the tank-treading period with the viscosity ratio decreases with the cell swelling as shown in figure 5. It is of interest to note that the tank-treading period GPtt of swollen cells for a given viscosity ratio λ increases only slightly with the capillary number Ca (i.e. it is practically independent of Ca) for the range of moderate flow rates studied in this work as we also found for normal cells; see figure 5(b) in our earlier work [15]. Thus in figure 5 we report our results for capillary number Ca = 2 only.
FIG. 5.
Tank-treading period GPtt as a function of the viscosity ratio λ for swollen, extra swollen and normal erythrocytes at capillary number Ca = 2.
Based on our computational results for the three types of cells shown in figure 5, the tank-treading period is given by
| (2) |
where the constants take on values
| (3) |
for normal, swollen and extra swollen cells, respectively.
Observe that Π0 = GPtt when λ = 0, and thus the co-efficient Π0 is associated with the work done by the surrounding fluid on the ellipsoidal cell during tank-treading combined with the shape-memory effects on the membrane, while the coefficient Π1 also involves the dissipation of energy in the cytoplasm (when λ > 0) [5]. Therefore, as the swelling of the cell increases, the tank-treading period of an inviscid (i.e. λ = 0) cytoplasmatic fluid is reduced only slightly; however the effects of the cytoplasmatic viscosity are decreased significantly, i.e. the coefficient Π1 is much lower.
The increase of the tank-treading period with the viscosity ratio for any type of cells results from the increased hydrodynamic forces in the cytoplasm which slow down the rotation of the inner fluid and thus the erythrocyte membrane [15]. The decrease of the tank-treading period GPtt of the erythrocyte membrane with the cell’s swelling can be understood by a suitable modification of the Skotheim-Secomb (SS) model, as discussed in the Appendix. In particular, the two effects of swelling (i.e. the reduced shape-memory effects owing to the more spherical-like reference shape for the shearing resistance, and the increase thickness of the actual cell during tank-treading), have opposite consequences on the tank-treading period. Our analysis suggests that, as the cell swelling increases, shape-memory effects tend to increase the tank-treading period while the higher thickness of the actual cell tends to decrease more the tank-treading period, and thus overall the tank-treading period decreases with the cell swelling. The effects of the higher thickness of the actual cell during the tank-treading dynamics are more severe for the coefficient Π1 which decreases more with the cell swelling than the co-efficient Π0.
It is of interest to note that our analysis presented in the Appendix is not restricted to erythrocytes but represents also non-spherical elastic capsules with significant shape-memory effects. Thus the decrease of the tank-treading period with the cell’s swelling discussed in the section should also characterize non-spherical elastic capsules with different degrees of swelling.
C. Spectrin Skeleton Dynamics of Swollen Erythrocytes
As discussed in our earlier publication [15], our non-stiff continuum erythrocyte algorithm focuses on the spectrin skeleton of the cell’s membrane, and thus provides information for this interface. (This information is not available via most continuum computational algorithms which focus on the membrane’s lipid bilayer.) The cytoskeleton can undergo local area changes under the constraint of fixed total area being enclosed beneath the lipid bilayer in the erythrocyte membrane. Furthermore, the spectrin skeleton is under prestress owing to the local-area incompressibility tensions transferred to it from the lipid bilayer [15]. The dynamics of the erythrocyte cytoskeleton during deformation has received attention from earlier theoretical and computational studies, e.g. [15, 27–29].
To describe the cytoskeleton prestress, we define the prestress parameter αp such that all lengths in the undeformed capsule would be scaled by (1+αp), relative to the reference shape (i.e. without changing the current shape during tank-treading) to generate the necessary prestress tensions. (For more details see Ref.[15].)
In figure 6 we collect our results for the average value at steady state of the prestress parameter αp as a function of the capillary number Ca and the viscosity ratio λ. The sub-linear increase of αp with Ca shown in figure 6(a) is well described by
FIG. 6.
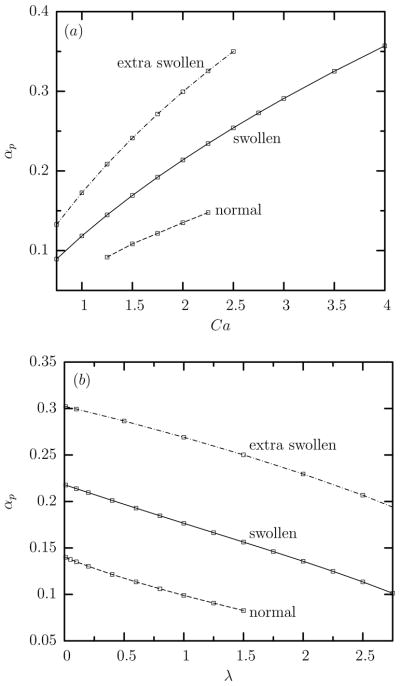
(a) The average value at steady state of the cytoskeleton prestress αp as a function of the capillary number Ca for swollen, extra swollen and normal erythrocytes at viscosity ratio λ = 0.1. (b) The average value at steady state of the cytoskeleton prestress αp as a function of the viscosity ratio λ for swollen, extra swollen and normal erythrocytes at capillary number Ca = 2.
| (4) |
where the constant A0 increases with the cell swelling, A0 = 0.08, 0.12, 0.17 for normal, swollen and extra swollen erythrocytes, respectively. In addition, the nearly linear decrease of αp with λ can be described as
| (5) |
By combining both expressions, the cytoskeleton prestress can be described as a function of both the capillary number and the viscosity ratio as
| (6) |
The increase of the cytoskeleton prestress αp with the flow rate originates from the higher hydrodynamic forces exerted on the tank-treading cell by the surrounding fluid which result in a higher cell deformation and tank-treading speed (or frequency Ftt), as seen in figures 2 and 5. Furthermore, the decrease of the cytoskeleton prestress αp with the cytoplasm viscosity results from the increased hydrodynamic forces in the cytoplasm which slow down the rotation of the inner fluid and thus the erythrocyte membrane. The increase of the cytoskeleton prestress αp with the cell swelling can be attributed to the increased tank-treading speed (or frequency Ftt) as discussed in section 3 B. That is, the higher thickness of the actual cell during tank-treading increases the tank-treading speed of the swollen cells, and thus the necessary prestress. (It is of interest to note that the tank-treading motion involves the entire surface of the erythrocyte, i.e. it is a three-dimensional surface motion.)
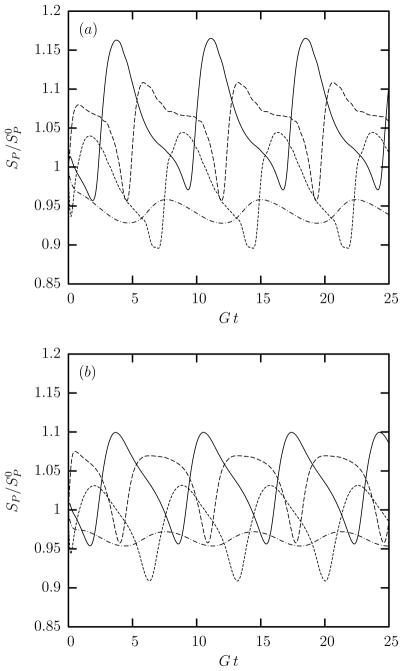
We now turn our attention to the local surface area changes of the cytoskeleton during tank-treading. As shown in figure 7, our computations reveal that during the steady-state tank-treading motion, the cytoskeleton of swollen erythrocytes undergoes measurable local area dilatation and compression with local area changes of almost ±10%. These local area changes reduce with the cell swelling as seen in figure 7(b) for the extra swollen cells. These local surface-area changes accumulate in larger portions of the cytoskeleton (such as the spectral elements used in our computations) producing similar surface area changes while the total area of the cytoskeleton is always fixed.
FIG. 7.
Time evolution of the differential surface area SP (scaled with its original value ) for the spectral discretization point at the middle of the spectral elements for (a) a swollen and (b) an extra swollen erythrocyte tank-treading in shear flow with λ = 0.1 and Ca = 2. Note that out of the NE = 10 spectral elements used in our computations, only four are independent (and show different behavior) owing to symmetry reasons. With respect to the first cell shown in figure 2(c), the location of the spectral elements presented here is: (——): upper dimple; (– – –): lower dimple; (- - -): edge region below dimple; (– · –): lateral edge.
Therefore the local surface area changes on the spectrin skeleton of swollen erythrocytes is similar to that for normal cells identified in our earlier work, e.g. see figure 6 in Ref.[15]. The reduction, with the cell swelling, of the local area changes on the cytoskeleton during tank-treading can be understood via the increased prestress αp shown in figure 6. That is, as the cell swelling is increased, the local-area incompressibility tensions from the lipid bilayer increase and thus cause a higher cytoskeleton prestress; this increased prestress results in smaller local-area changes on the spectrin skeleton of the more swollen erythrocytes.
4. CONCLUSIONS
In this paper, we have investigated computationally the effects of swelling on the oscillatory tank-treading motion of healthy human erythrocytes in shear flows utilizing our non-stiff cytoskeleton-based continuum erythrocyte algorithm [15]. The cell swelling results from the decrease of the osmolarity of the surrounding fluid from its physiological value of 300 mO [9]. Lowered plasma osmolarity (and thus swollen erythrocytes) is found in several clinical syndromes including inappropriate antidiuretic hormone secretion and diuretic therapy [10]. In our work we have studied the tank-treading dynamics of swollen erythrocytes in shear flows with capillary number Ca = O(1) and small to moderate viscosity ratios 0.01 ≤ λ ≤ 2.75. These conditions correspond to a wide range of surrounding medium viscosities (2 to 600 mPa s) and shear rates (1 to 760 s−1), and match those used in ektacytometry and rheoscopy systems [3, 18, 19].
Swollen cells show similar shear flow dynamics with normal cells, e.g. [8, 15], but with significantly higher inclination and tank-treading speed owing to the higher cell thickness. For a given viscosity ratio, as the flow rate increases, the steady-state erythrocyte length L (in the shear plane) increases logarithmically while its depth W (normal to the shear plane) decreases logarithmically. For a given flow rate, as the viscosity ratio increases, the erythrocyte length L contracts while its depth W increases, and thus the cell becomes less deformed. Our computations show that the erythrocyte width S, which exists in the shear plane, is practically invariant in time, capillary number and viscosity ratio, and corresponds to a real cell thickness of about 2.5 μm at physiological osmolarity (300 mO) and 3.4 μm at an osmolarity of 217 mO. The erythrocyte inclination decreases as the flow rate increases or as the surrounding fluid viscosity decreases, owing to the increased inner rotational flow which tends to align the cell toward the flow direction.
The ektacytometry deformation of swollen cells increases logarithmically with the shear stress but with a slower slope than that for normal cells owing mainly to the higher orientation of the more swollen cells. Ektacytometry systems are commonly used in clinical applications to measure the deformability of healthy and diseased erythrocytes [18], and our work reveals that swollen cells (e.g. owing to a blood disorder) show similar ektacytometry deformation Dxy with normal cells at low flow rates but significantly smaller Dxy at high flow rates. This does not imply a significant reduction in the ability of swollen erythrocytes to deform, but it is an artifact of the specific experimental technique which is affected by the cell inclination.
For both normal and swollen cells the tank-treading period GPtt increases linearly with the viscosity ratio λ while the slope of the linear dependence decreases with the cell swelling. The increase of the tank-treading period with the viscosity ratio results from the increased hydrodynamic forces in the cytoplasm which slow down the rotation of the inner fluid and thus the erythrocyte membrane. The two effects of swelling (i.e. the reduced shape-memory effects owing to the more spherical-like reference shape for the shearing resistance, and the increased thickness of the actual cell during tank-treading), have opposite consequences on the tank-treading period. Our analysis suggests that as the cell swelling increases, shape-memory effects tend to increase the tank-treading period while the higher thickness of the actual cell tends to decrease more the tank-treading period, and thus overall the tank-treading period decreases with the cell swelling.
It is of interest to note that our computations do not account for the viscosity of the erythrocyte membrane. As discussed in our earlier papers [8, 15], comparison of our computational results for normal cells with theoretical models and experimental findings, suggests that the membrane viscosity slows down the tank-treading motion by a factor close to two; however, the energy dissipation due to the shape-memory effects is more significant than the energy dissipation due to the membrane viscosity.
Our non-stiff cytoskeleton-based continuum erythrocyte algorithm [15] provides information on the dynamics of the spectrin skeleton of the erythrocyte membrane; this information is not available via most continuum computational algorithms which focus on the membrane’s lipid bilayer. The local-area incompressibility tensions from the lipid bilayer increase with the cell swelling and cause a higher cytoskeleton prestress; this increased prestress results in smaller, but still measurable, local-area changes on the spectrin skeleton of the more swollen erythrocytes.
Acknowledgments
This work was supported in part by the National Science Foundation and the National Institutes of Health. Most computations were performed on multiprocessor computers provided by the National Center for Supercomputing Applications (NCSA) in Illinois.
APPENDIX: ANALYSIS OF THE EFFECTS OF CELL SWELLING ON THE TANK-TREADING PERIOD
Theoretical models have been developed to describe and explain the tank-treading, swinging and tumbling motion of erythrocytes (and other non-spherical capsules) in shear flows, e.g. [5, 26]. These models restrict the number of degrees of freedom to a few necessary to describe the basic particle motion and thus do not solve the entire (non-linear) dynamics problem in shear flows while they require as input the cell’s dimensions. The early model of Keller and Skalak (KS) [26] treats the erythrocyte as an ellipsoidal capsule of fixed shape but without taking into consideration the shape-memory effects (owing to the non-spherical reference cell shape of the shearing resistance) which were not known at that time. This property has been included into the recent model of Skotheim and Secomb (SS) [5] motivated by experimental findings with erythrocytes in shear flows [4].
In our earlier work we investigated the predictions of these two models on the tank-treading dynamics of normal erythrocytes [8] and found that the consideration of the shape-memory effects is of paramount importance for the determination of the tank-treading speed of the erythrocyte membrane. In particular, comparing our computational results for normal erythrocytes with the models prediction in our earlier work [8], we found that the KS model underestimates significantly (by a factor of six) the tank-treading period while the predictions of the SS model are quite accurate when we provide in these models the cell dimensions during tank-treading from our computations.
Given the success of the Skotheim-Secomb model in predicting the tank-treading speed of normal erythrocytes, here we show that the decrease of the tank-treading period GPtt with the cell swelling (discussed in section 3 B) can be understood by a suitable modification of this model. We emphasize that swelling has two effects on the cell dynamics: (i) it reduces the shape-memory effects since it makes the erythrocyte’s reference shape of the shearing resistance more spherical-like, and (ii) it increases the cell thickness, a feature which is also preserved under flow conditions.
The original model by Keller and Skalak [26] took into account the geometric shape of the cell, and thus effect (ii), by considering three dimensionless constants, f1, f2, and f3, functions of the cell’s lengths, i.e. L, S and W. The subsequent model of Skotheim and Secomb [5] added shape memory, i.e. effect (i), but without taking into consideration any swelling effects on the cell’s reference shape. In particular, the SS model incorporated into the KS model the rate of elastic energy storage as
| (7) |
where E0 is the elastic energy change, φ(t) is the phase angle, and Ftt = ∂φ/∂t is the tank-treading frequency.
The swelling effects on the elastic energy can be incorporated approximately into the SS model by assuming that
| (8) |
where Sf is the swelling factor of the cell’s reference shape, and Ê0 is the elastic energy change of an overextended ellipsoid with zero swelling factor. In this paper, we prefer to define the swelling factor of the reference shape as Sf = S/L which is particularly suited for tank-treading dynamics. Observe that now E0 = 0 for Sf = 1, i.e. the shape-memory effects are eliminated for a spherical reference shape as should be.
Based on the above, and taking into consideration the balance of the rate of work done by the surrounding fluid on the ellipsoidal cell during tank-treading with the internal dissipation and the rate of elastic energy storage owing to shape-memory, Eq.(6) in the work of Skotheim and Secomb [5] suggests that, for cells with significant shape-memory effects, the tank-treading frequency Ftt scales as
| (9) |
and thus the tank-treading period is a linear function of the viscosity ratio λ
| (10) |
Comparing Eq. (2) with Eq. (10) we obtain
| (11) |
For the three types of cells studied in this paper (normal, swollen, and extra swollen), the swelling factor of the reference shape takes values Sf = 0.32, 0.45, 0.58 while during tank-treading the two shape dimensionless constants take typical values of f1 ≈ 14.9, 5.8, 3.0 and f2 ≈ −9.8, −5.4, −3.6.
Therefore, Eq. (11) suggests that the ratio of coefficient Π0 of the swollen cell to that of the normal cell is
| (12) |
that is close to the actual value of this ratio 0.9. In addition, the same equation suggests that the ratio of coefficient Π1 of the swollen cell to that of the normal cell is
| (13) |
that is rather close to the actual value of this ratio 0.49. Similarly comparing the extra swollen cell with the swollen cell, we find
| (14 |
that is close to the actual value of this ratio 0.94, while
| (15) |
that is rather close to the actual value of this ratio 0.56. (Note that we also found that the Skotheim-Secomb model over-estimates slightly the slope Π1 even for normal erythrocytes; see figure 9 in Ref.[8].)
This analysis shows that as the cell swelling increases, shape-memory effects tend to increase the tank-treading period while the higher thickness of the actual cell tends to decrease more the tank-treading period, and thus overall the tank-treading period decreases with the cell swelling. The effects of the higher thickness of the actual cell during the tank-treading dynamics are more severe for the coefficient Π1, which decreases more with the cell swelling than the coefficient Π0.
References
- 1.Baskurt OK, Meiselman HJ. Blood rheology and hemodynamics. Sem Thromb Hem. 2003;29:435–450. doi: 10.1055/s-2003-44551. [DOI] [PubMed] [Google Scholar]
- 2.Popel AS, Johnson PC. Microcirculation and Hemorheology. Annu Rev Fluid Mech. 2005;37:43–69. doi: 10.1146/annurev.fluid.37.042604.133933. [DOI] [PMC free article] [PubMed] [Google Scholar]
- 3.Fischer TM, Stöhr-Liesen M, Schmid-Schönbein H. The red cell as a fluid droplet: tank tread-like motion of the human erythrocyte membrane in shear flow. Science. 1978;202:894–896. doi: 10.1126/science.715448. [DOI] [PubMed] [Google Scholar]
- 4.Abkarian M, Faivre M, Viallat A. Swinging of red blood cells under shear flow. Phys Rev Lett. 2007;98:188302. doi: 10.1103/PhysRevLett.98.188302. [DOI] [PubMed] [Google Scholar]
- 5.Skotheim JM, Secomb TW. Red blood cells and other nonspherical capsules in shear flow: oscillatory dynamics and the tank-treading-to-tumbling transition. Phys Rev Lett. 2007;98:078301. doi: 10.1103/PhysRevLett.98.078301. [DOI] [PubMed] [Google Scholar]
- 6.Sui Y, Chew YT, Roy P, Cheng YP, Low HT. Dynamic motion of red blood cells in simple shear flow. Phys Fluids. 2008;20:112106. [Google Scholar]
- 7.Tsubota K, Wada S. Effect of the natural state of an elastic cellular membrane on tank-treading and tumbling motions of a single red blood cell. Phys Rev E. 2010;81:011910. doi: 10.1103/PhysRevE.81.011910. [DOI] [PubMed] [Google Scholar]
- 8.Dodson WR, III, Dimitrakopoulos P. Oscillatory tank-treading motion of erythrocytes in shear flows. Phys Rev E. 2011;84:011913. doi: 10.1103/PhysRevE.84.011913. [DOI] [PMC free article] [PubMed] [Google Scholar]
- 9.Evans E, Fung YC. Improved measurements of the erythrocyte geometry. Microvasc Res. 1972;4:335–347. doi: 10.1016/0026-2862(72)90069-6. [DOI] [PubMed] [Google Scholar]
- 10.Stäubli M, Roessler B, Straub PW. Fluid trapping of erythrocytes under hypoosmolar conditions. Blut. 1987;54:239–245. doi: 10.1007/BF00594200. [DOI] [PubMed] [Google Scholar]
- 11.Magnani M, Rossi L, D’Ascenzo M, Panzani I, Bigi L, Zanella A. Erythrocyte engineering for drug delivery and targeting. Biotechnol Appl Biochem. 1998;28:1–6. [PubMed] [Google Scholar]
- 12.Pierrat S, Brochard-Wyart F, Nassoy P. Enforced detachment of red blood cells adhering to surfaces: statics and dynamics. Biophys J. 2004;87:2855–2869. doi: 10.1529/biophysj.104.043695. [DOI] [PMC free article] [PubMed] [Google Scholar]
- 13.Tachev KD, Angarska JK, Danov KD, Kralchevsky PA. Erythrocyte attachment to substrates: determination of membrane tension and adhesion energy. Coll Surf B Biointer. 2000;19:61–80. [Google Scholar]
- 14.Fischer TM. Shape memory of human red blood cells. Biophys J. 2004;86:3304–3313. doi: 10.1016/S0006-3495(04)74378-7. [DOI] [PMC free article] [PubMed] [Google Scholar]
- 15.Dodson WR, III, Dimitrakopoulos P. Tank-treading of erythrocytes in strong shear flows via a non-stiff cytoskeleton-based continuum computational modeling. Biophys J. 2010;99:2906–2916. doi: 10.1016/j.bpj.2010.08.048. [DOI] [PMC free article] [PubMed] [Google Scholar]
- 16.Dodson WR, III, Dimitrakopoulos P. Dynamics of strain-hardening and strain-softening capsules in strong planar extensional flows via an interfacial spectral boundary element algorithm for elastic membranes. J Fluid Mech. 2009;641:263–296. [Google Scholar]
- 17.Skalak R, Özkaya N, Skalak TC. Biofluid Mechanics. Annu Rev Fluid Mech. 1989;21:167–204. [Google Scholar]
- 18.Hardeman MR, Goedhart PT, Dobbe JGG, Lettinga KP. Laser-assisted optical rotational cell analyser (LORCA): I. A new instrument for measurement of various structural hemorheological parameters. Clin Hemorheol. 1994;14:605–618. [Google Scholar]
- 19.Fischer TM. Tank-tread frequency of the red cell membrane: dependence on the viscosity of the suspending medium. Biophys J. 2007;93:2553–2581. doi: 10.1529/biophysj.107.104505. [DOI] [PMC free article] [PubMed] [Google Scholar]
- 20.Mohandas N, Clark MR, Jacobs MS, Shohet SB. Analysis of factors regarding erythrocyte deformability. J Clin Invest. 1980;66:563–573. doi: 10.1172/JCI109888. [DOI] [PMC free article] [PubMed] [Google Scholar]
- 21.Beaucourt J, Rioual F, Seón T, Biben T, Misbah C. Steady to unsteady dynamics of a vesicle in a flow. Phys Rev E. 2004;69:011906. doi: 10.1103/PhysRevE.69.011906. [DOI] [PubMed] [Google Scholar]
- 22.Rallison JM. The deformation of small viscous drops and bubbles in shear flows. Ann Rev Fluid Mech. 1984;16:45–66. [Google Scholar]
- 23.Ramanujan S, Pozrikidis C. Deformation of liquid capsules enclosed by elastic membranes in simple shear flow: large deformations and the effect of fluid viscosities. J Fluid Mech. 1998;361:117–143. [Google Scholar]
- 24.Clark MR, Mohandas N, Shohet SB, Hoesch RM, Rossi ME. Osmotic gradient ektacytometry: comprehensive characterization of red-cell volume and surface maintenance. Blood. 1983;61:899–910. [PubMed] [Google Scholar]
- 25.Hénon S, Lenormand G, Richert A, Gallet F. A new determination of the shear modulus of the human erythrocyte membrane using optical tweezers. Biophys J. 1999;76:1145–1151. doi: 10.1016/S0006-3495(99)77279-6. [DOI] [PMC free article] [PubMed] [Google Scholar]
- 26.Keller SR, Skalak R. Motion of a tank-treading ellipsoidal particle in a shear flow. J Fluid Mech. 1982;120:27–47. [Google Scholar]
- 27.Fischer TM. Is the surface area of the red cell membrane skeleton locally conserved? Biophys J. 1992;61:298–305. doi: 10.1016/S0006-3495(92)81837-4. [DOI] [PMC free article] [PubMed] [Google Scholar]
- 28.Discher DE, Mohandas N, Evans EA. Molecular maps of red cell deformation: hidden elasticity and in situ connectivity. Science. 1994;266:1032–1035. doi: 10.1126/science.7973655. [DOI] [PubMed] [Google Scholar]
- 29.Boey SK, Boal DH, Discher DE. Simulations of the erythrocyte cytoskeleton at large deformation. I. Microscopic Models. Biophys J. 1998;75:1573–1583. doi: 10.1016/S0006-3495(98)74075-5. [DOI] [PMC free article] [PubMed] [Google Scholar]


