

Abstract
Because of the inherent complexity of coupled nonlinear biological systems, the development of computational models is necessary for achieving a quantitative understanding of their structure and function in health and disease. Statistical learning is applied to high-dimensional biomolecular data to create models that describe relationships between molecules and networks. Multiscale modeling links networks to cells, organs, and organ systems. Computational approaches are used to characterize anatomic shape and its variations in health and disease. In each case, the purposes of modeling are to capture all that we know about disease and to develop improved therapies tailored to the needs of individuals. We discuss advances in computational medicine, with specific examples in the fields of cancer, diabetes, cardiology, and neurology. Advances in translating these computational methods to the clinic are described, as well as challenges in applying models for improving patient health.
From Models to Medicine
There is growing recognition that the tabulation of the molecular building blocks from which biological systems are composed is not sufficient for understanding the systems' functional properties in health and disease. Indeed, function does not originate exclusively at the level of the gene, progressing in a feed-forward fashion through higher levels of biological organization (the original central dogma of biology) (1). Rather, many of the emergent, integrative behaviors of biological systems result not only from complex interactions within a specific level but also from feed-forward and feedback interactions that connect a broad range of hierarchical levels of biological organization (Fig. 1). As examples, both RNA and protein expression (2), voltage-dependent ion channel gating (3), mechanical forces at the level of cells and tissue (4), and external cues, including environmental factors (5), can feedback to regulate gene expression. Such interactions between different organizational levels have been referred to as upward and downward pathways of causation (6). A consequence of these feedforward and feedback pathways is that no particular level, such as that of the gene, can be considered to be the locus of origin of function. Instead, function arises from the integrated behavior of the overall system.
Fig. 1.
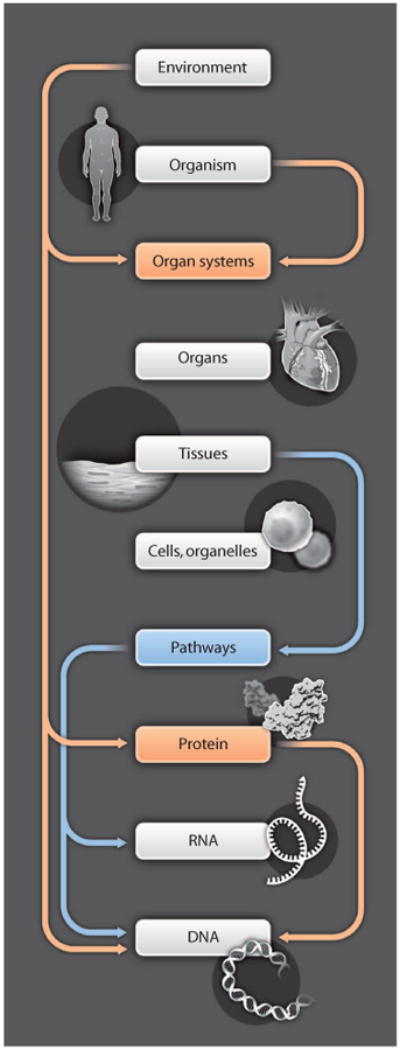
Function is distributed across multiple biological scales. Physiological systems have feed-forward pathways between successive levels, and feedback pathways that span levels of biological organization. Function is distributed and does not necessarily originate from any one level, such as the gene. As a consequence of this complexity, understanding physiological systems in health and disease can only be achieved through quantitative modeling and cannot be understood using “mental models.”
This inherent complexity necessitates the development of models, whether at a specific biological level or across levels, based on experimental data to achieve a quantitative understanding of the structure and function of living systems. Creating these computational models is the long-term goal of the Virtual Physiological Human and Physiome Projects. These projects are developing an infrastructure for linking models of structure and function developed at different biological levels to create integrative models of cells, tissues, and organs (7, 8). It includes the development of modeling standards (9), computational tools (10), and Web-accessible databases of models (11).
Computational modeling can also be applied to understand the perturbed structure and function of living systems in disease (12), and insights gained from modeling can in turn be used to develop improved methods for disease diagnosis and treatment. We refer to this emerging approach as “computational medicine.” This includes not only models of molecular networks and physiological processes but also modeling anatomic shapes layered with physiological function. Although modeling approaches used in each of these areas of computational medicine differ, the common thread is the use of quantitative models to understand altered structure and function in disease. Figure 2 gives examples of the different types of models used and types of data needed to describe biological processes and disease across different biological scales. It is important that predictions regarding perturbed structure and function in disease be tested using data not included in model building. Model predictions may or may not be supported by results from the studies they motivate. After testing these predictions, models should be revised as needed to more accurately capture the nature of disease.
Fig. 2.
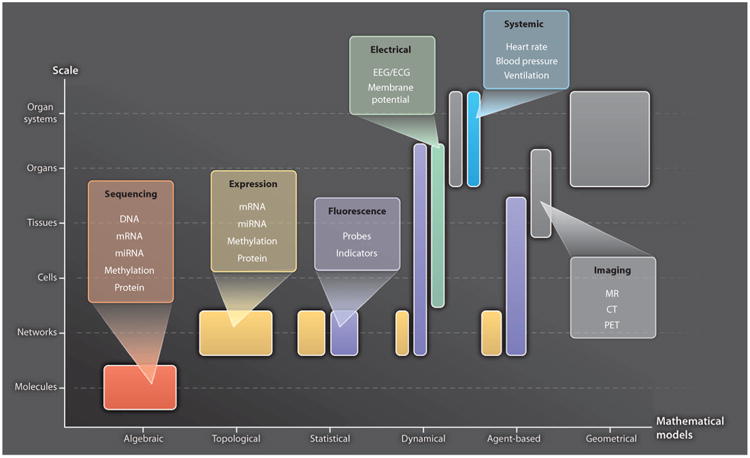
Representative modeling approaches and their data requirements. The abscissa lists different approaches to modeling biological systems at different scales (ordinate). “Algebraic” models describe classes of objects in the genome and their relationships [for example, (107)]. “Topological” models describe molecular wiring diagrams [for example, (108)]. “Statistical” models describe molecular networks as the joint probability distribution of molecular concentrations [for example, (35)]. “Dynamical,” mechanistic models describe the spatiotemporal evolution of biological states using ordinary or partial differential equations [for example, (68)]. “Agent-based” models describe physiological system component interactions using rules, and component location and state evolve in time [for example, (109)]. “Geometrical” models describe anatomic shape [for example, (88)]. Representative data types used in these different modeling approaches and at different biological scales are color-coded. EEG, electroencephalography; ECG, electrocardiography; PET, positron emission tomography.
As we gain confidence in the ability of computational models to predict human biological processes, they will help guide us through the complex landscape of disease, ultimately leading to more effective and reliable methods for disease diagnosis, risk stratification, and therapy. This goal is challenging. Nonetheless, progress is being made across several medical fields. In this Review, we describe aspects of computational medicine, from molecules and networks to highly integrated physiological systems, and how models can be used to improve human health. In the following sections, we further describe the scientific disciplines from which computational medicine is composed.
Computational Molecular Medicine
Understanding the function of highly interconnected molecular networks has come to be known as “systems biology.” Diseased cells arise from perturbations in biological networks owing to the net effect of interactions among multiple molecular agents, including inherited and somatic DNA variants; changes in mRNA, microRNA (miRNA), and protein expression; and epigenetic factors, such as DNA methylation. An enormous amount of data about these perturbations is being produced by next-generation sequencing and microarray experiments of large patient cohorts, making it possible for the first time to discover the driving differences in the abundance and activity of key biomolecules. Analysis of high-dimensional biomolecular data using methods of statistical learning has the potential to enhance discovery of molecular disease networks, detection of disease, discrimination among disease subtypes, prediction of clinical outcomes, and characterization of disease progression (13–15).
Owing to the massive number of interacting components in biological systems, the traditional approach to biomedical research— which is experimental and molecule by molecule—is not feasible for high-throughput assessment of biological complexity. A principled learning approach has become indispensable for extracting knowledge from large arrays of numbers. In the case of computational molecular medicine, this entails revealing and exploiting disease-related information implicitly stored in high-dimensional, high-throughput biological data. For example, in Fig. 3, understanding the role of biomolecules in the list L (left panel) in health and disease requires analyzing the relationships among them in the context of a network, in particular identifying the main physical and causal interactions as a wiring diagram (middle panel, Fig. 3). A deep understanding also requires a statistical characterization: Learning the likely and unlikely concentrations of these biomolecules—not just individually but collectively as a multivariate probability distribution—opens the possibility of making clinical decisions based on these likelihoods (right panel, Fig. 3). Statistical modeling is motivated by the simple fact that in functioning organisms, not all combinations of individual molecular states are equally likely. Some configurations are observed far more likely than others, and thus, the favored states in health and disease are markedly different.
Fig. 3.
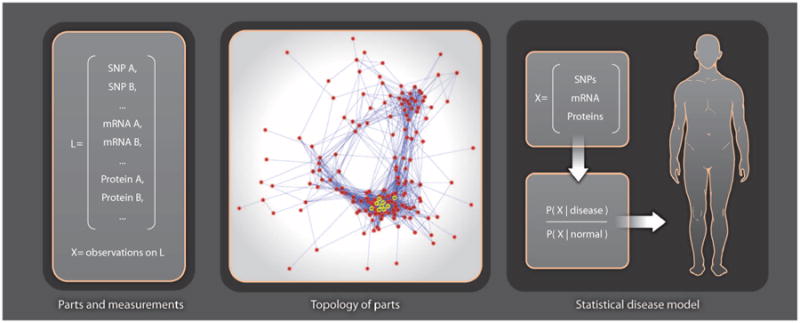
Statistical learning of molecular networks and disease phenotypes. The panel on the left shows the names of a set L of measured molecular species, where X represents the observed states [for singlen-ucleotide polymorphisms (SNPs) ] or concentrations (for mRNAs and proteins) for an individual. A topology of parts (molecular network) is then constructed, where nodes are the measured species L and edges represent molecular interactions. The rightmost panel shows how a statistical model of disease, expressed as the likelihood of the measurements X, in disease divided by likelihood in normal, is used to make a personalized diagnosis. Building this classifier for diagnosing the individual requires knowing the likely and unlikely states that distinguish health from disease.
Applications: Learning Molecular Signatures of Disease
In the statistical learning approach for analysis of genomic data, the extraction of knowledge is formulated as the recognition of high-dimensional patterns often referred to as “biomarkers.” Here, these patterns are network properties and configurations of measurements that can detect or even characterize phenotypes of interest at the molecular level, for example, genes with an unusually large number of connections (“hubs”; middle panel, Fig. 3) and patterns of gene-protein interactions, which are far more common in disease than in health. Data generated from gene microarrays and other high-throughput technologies can be used to identify such network-based signatures, which can, in turn, assist in early detection or improved prognosis for complex diseases.
However, proceeding from a list of implicated biomolecules to a useful signature for disease requires a prediction rule. For example (right panel, Fig. 3), comparing the likelihoods of observed features X in health and disease yields a number that is a diagnostic score. Other diagnostic scores can be computed from molecular network properties. A few biomarkers and scores have been approved by the U.S. Food and Drug Administration (FDA) for clinical use [see list of FDA approved devices (16)]. For example, there are currently three molecularly based prognostic tests for early-stage breast cancer (17). One of these is MammaPrint, which was developed from microarray experiments and combines the expression levels of 70 genes into a score for predicting 5-year recurrence of breast cancer in both estrogen receptor-positive and estrogen receptor-negative patient populations (18).
Despite promising beginnings, and with a few exceptions, the results reported to date using computational learning methods have not been sufficiently accurate or reproducible for clinical use. We believe that there are three main barriers to progress in computational medicine based on statistical learning: technological, mathematical, and translational. First, any statistical analysis at the molecular level requires high-quality data collected from a sufficiently large patient cohort to represent the population. Sample sizes described in modeling studies are frequently at least an order of magnitude too small to enable the type of pattern recognition that is statistically robust and consistent across data collection methods. In addition, biological samples are often degraded by lab and batch effects (19), which severely limit their use and contribute to a lack of reproducibility in biomarker analyses. Increases in both the quantity and the quality of data in the coming years will lower this barrier.
Second, the mathematical challenges are formidable. Extremely high-dimensional data sets are now ubiquitous in basic biomedical and engineering research but pose technical difficulties for statistical learning and inference because of the large number of interacting components. A prototypical example occurs in predicting the state of a complex variable, such as a disease phenotype, when the number n of samples available for learning is small compared to the number d of potential biomarkers. Ideally, n would be of the same order, or even larger, than d. However, in actual studies, d ranges from thousands to even millions, and n is several orders of magnitude smaller. This “small n, large d” dilemma in statistical learning is pervasive in functional genomics (20). Consequently, in view of well-known tradeoffs in learning theory between sample size and model complexity (21), and between “bias” and “variance” (22), incorporating rich a priori knowledge to constrain the set of possible representations for the data may be unavoidable.
Finally, even assuming ample, high-quality data, it is difficult to extract information about the underlying biology or generate testable hypotheses from the results generated by most off-the-shelf statistical learning techniques such as support vector machines and random forests. These methods were generally developed for other purposes, such as computer-based speech and image recognition. Their decision rules are mathematically complex functions of the input variables, for example, involving nonlinear functions of hundreds or thousands of gene expression values. Although these prediction rules may be accurate, it can be very difficult, if not impossible, to interpret them to gain biological insights about why a particular set of genes is a useful bio-marker. Rules that are easy to understand because they are based on expression levels of clearly identified gene sets are better for learning because they can be related more directly to molecular function and therefore treatment design. For example, when separating two disease phenotypes on the basis of a gene expression profile, a decision rule that is based on a regulatory pattern involving a small number of interacting genes can provide valuable information about the possible targets of intervention.
As an illustration of these technological, mathematical, and translational barriers, many diseases result from perturbations in signaling pathways, which can be detected and quantified through microarrays. Statistical learning has been applied to distinguish among disease phenotypes from these genomic data. Most of the early applications were entirely data-driven, that is, not informed by a priori domain knowledge (23) and used machine-learning methods such as neural networks (24), random forests (25), and support vector machines (26), which usually generate complex decision rules involving many parameters and genes. Traditionally, validation and other follow-up studies including therapeutic development must be based on small numbers of biomarkers so that the role of genes and gene products can be more easily understood. A key observation has been that simplicity does not necessarily limit performance (27) and that prediction rules based on fewer genes and parameters can be as sensitive and specific as more complex ones. As an example, the top-scoring pair method (20) is based on a single binary “switch” that compares the ordering of expression between two genes. Extensions of this method to more genes and multiple switches have been used to differentiate between stomach cancers (28), predict treatment response in breast cancer (29), grade prostate cancers (30), and prognosticate lung cancer (31).
Still, widespread clinical application of diagnostic devices based on molecular signatures of disease discovered using statistical learning methods is limited. In particular, to our knowledge, none of the diagnostic and prognostic tools mentioned above are in clinical use. Data quality may be one factor because microarray data are often “noisy” and subject to lab and batch effects. The sample size issue is still predominant (small n, large d), leading to overfitting of training data, which increases study-to-study differences in lists of discriminating biomolecules and their reported prediction accuracies. The most effective way to control variability and enhance reproducibility is to restrict the complexity of decision rules and scores by incorporating carefully chosen, domain-dependent biases. One example is to limit decision rules to a smaller set of genes that, on the basis of previous molecular studies, are members of pathways believed to be associated with the disease. Limiting the set of genes used in decision rules reduces the impact of small sample number and the particular choice of samples used on the variance of decision rule parameter estimates. Conclusions derived from one study are then more likely to generalize to another. In more recent applications of statistical learning, there are efforts to incorporate previous information on molecular networks to identify differential expression at the level of pathways rather than individual genes (32, 33).
Further progress in deriving clinical value from high-dimensional statistical learning will depend on advances in statistical network modeling, which entails representing and learning the stochastic dependency structure among multiple variables, including disease phenotypes, molecular concentrations, and genetic states (Fig. 3). This is arguably the core challenge of computational systems biology (34, 35). A “wiring diagram” depicts the interactions among the system components (genes, RNA, and proteins) in the form of an annotated graph but does not provide quantitative information about the most likely or unlikely interactions and their patterns. Statistical modeling is different. From a mathematical perspective, it is a more ambitious undertaking than biomarker discovery or prediction, both of which can be accomplished by proceeding directly from examples to decisions. Indeed, uncovering a complex statistical dependency structure within a large number of variables, many of which are hidden (unobservable), from a limited number of samples can stretch de novo learning to the limit. Once these dependency structures are learned, information from both wiring diagrams and statistical models can then be combined to suggest mechanistic explanations for decision rules.
Despite the variety and level of detail of real molecular networks, the computational challenge in learning from data is again to control the complexity of the models. It is essential to balance scope and biochemical fidelity with a useful level of abstraction and computational efficiency (35, 36). Discovering rich structure from small samples would seem to require severely restricting the search space. This could be accomplished by reducing the size of the networks or by incorporating bias in the form of a priori information about likely states and plausible interactions, in which case learning may become more efficient owing to variance reduction. Progress in this direction has been made using Bayesian networks and other restricted topologies and by imposing experimentally derived constraints, such as information about transcription factor targets when studying cell signaling (37). Learning stable and accurate models will also require integrating evidence from multiple biological levels (Fig. 1). For example, identifying the drivers of cancer can be improved by integrating data on genetic variations (for example, copy number aberrations) with gene expression (38).
The potential benefits of robust statistical network modeling are considerable. Given phenotype-specific models, one can make predictions and balance sensitivity and specificity with classical likelihood ratio tests, which are theoretically optimal. Modeling may be necessary to reach a deep understanding of the hierarchical nature of gene regulation and how malignant phenotypes arise from the net effect of interactions among multiple genes and other molecular agents within biological network. Analysis of high-dimensional biomolecular data using methods of statistical learning has the potential to enhance discovery of molecular disease networks, detection of disease, discrimination among disease subtypes, prediction of clinical outcomes, and characterization of disease progression (13). In this way, modeling naturally elucidates mechanism (39, 40), which is important for drug design, and may contribute to new computational learning paradigms for disease treatment.
Computational Physiological Medicine
The goal of computational physiological medicine is to develop mechanistic models of biological systems in disease and how system properties may change over time, and then translate insights gained from these models to improved therapies. Mechanistic modeling differs from statistical modeling. As described in the previous section, a statistical network model describes the likelihood of different configurations of molecular concentrations as a multivariate probability distribution (Fig. 3). Knowledge regarding disease is gained by learning which state configurations are more likely in disease than in health. In contrast, a mechanistic network model describes the molecules that interact with one another, their concentrations, the rates at which they interact, the biochemical nature of these interactions, the factors that control them, and how concentrations can change over time. Mechanistic network models often take the form of coupled systems of ordinary differential equations where the states are concentrations of molecules, possibly including their modified forms. Model equations are solved to observe how states evolve in time as they interact with one another and respond to network inputs. Other modeling approaches are used as well, including stochastic processes or stochastic ordinary differential equations (41), in cases where it is important to capture the ways in which processes evolve randomly in time, and partial differential reaction-diffusion equation (42) and agent-based models (43) for processes that evolve in time and space.
At the network, pathway, and cell levels, the number of states in mechanistic models is typically smaller than in statistical models. This is because it can be difficult to measure certain states and/or reaction rates experimentally, and it is therefore necessary to make assumptions about which biological processes and components should be included in the models. It is always desirable to start the model-building process with a minimal set of assumptions regarding the numbers of states and parameters, and then test the extent to which this “minimal model” reproduces as well as predicts experimental data. From there, complexity can be expanded as warranted (44). Despite the relative low dimension of these models, their advantage is the ability to predict emergent behaviors of biological systems in health and disease because they incorporate the biological mechanisms by which system components interact.
Understanding disease and treatment options also requires development of models spanning different levels of biological organization (Fig. 1). For example, cancer begins at the molecular level as a result of mutations of oncogenes, tumor suppressor genes, miRNA, and changes in DNA methylation. This leads to dysregulation of many different signaling pathways involved in cell growth, angiogenesis, and apoptosis. Tumor cells also interact with their local environment (extracellular matrix and cells) by secreting signaling molecules. Changes to this signaling can ultimately affect cell adhesion and migration, tissue invasion, and metastasis. Cancer is clearly a multiscale disease, and mechanistic models spanning these scales are being developed and applied to predicting the progression of tumors (45–48). Efforts to develop multiscale mechanistic models of cardiac electromechanics, microcirculatory, renal, gastrointestinal, lung, and immune system function in health and disease are under way (49–56). For certain disease areas, there are promising results (described below), indicating that computational models will ultimately contribute to patient treatment, including individualized patient therapy.
Applications: Modeling Physiological Function in Disease
Cancer
As described above, there is a large body of work on computational modeling of cancer processes and mathematical methods for detection (57). Multiscale models of tumor growth, for example, include factors such as signaling events in tumor cells, interactions between cells (for example, adhesion), interactions between cells and extracellular matrix, changes in cell environment (for example, oxygen diffusion), and angiogenesis (45–47). These models have made it possible to study the impact of these factors on tumor development. Recently, several groups have investigated how these models may be tailored to the individual patient. Macklin et al. (48) developed a patient-specific mechanistic model of ductal carcinoma in situ (DCIS), the most prevalent precursor to invasive ductal carcinoma, that describes the spatiotemporal dynamics of DCIS. Using this model, they showed that the volume of breast with in situ tumors could be predicted by adjusting parameters that could be measured for each patient using biopsy analysis results. The ability of the model to predict the volume of tissue that should be resected will help guide surgeons during these procedure and may reduce the need for repeat resections.
In a more minimalist approach, Swanson and co-workers developed a partial differential reaction-diffusion equation model of glioblastoma development, which describes the rate of change of glioma cell density as a function of tumor growth and invasion, and the fraction of cells that survive exposure to ionizing radiation (58). The parameters of this model can be estimated from as little as two magnetic resonance (MR) images taken before treatment. This model has been used to evaluate the therapeutic value of different radiation therapies (59) and tumor resection procedures in individual patients (58).
In silico modeling of cancer therapy has also been done at the level of cell signaling networks. Recently, a kinetic model of the ErbB tumorigenic signaling network was developed, and sensitivity analysis was used to identify an optimal drug target, ErbB3 (60). Using this information, a novel, fully human monoclonal antibody (MM-121) that binds with high affinity to inhibit ErbB3 was developed. Multiple phase 1 to 2 clinical trials are now under way to test MM-121, either alone or combined with pharmacotherapy, in treating lung, breast, and ovarian cancers, and advanced solid tumors refractory to therapy (61).
These results demonstrate that computational models are influencing cancer diagnosis and treatment. However, there remain several challenges to overcome before such computational models see more widespread use. There is a need for more digitized, multimodality diagnostic data sets (genomics to imaging) that gather information over multiple time points to constrain and test models and diagnostic algorithms on a per-patient basis. The field needs improved methods for rapid modeling across multiple scales to readily simulate therapeutic scenarios. Finally, methods for presenting information from simulations within the electronic patient record must be developed to provide actionable, point-of-care decisions.
Diabetes
The Artificial Pancreas Project (62), funded by the Juvenile Diabetes Research Foundation, is an effort to develop a closed-loop subcutaneous insulin delivery system for treatment of type 1 diabetes mellitus. A subcutaneous continuous glucose-monitoring sensor is coupled to an insulin infusion pump, and a control algorithm is used to adjust insulin delivery as a function of measured glucose level. A major challenge in developing these systems is devising the appropriate strategy for controlling insulin delivery. Such strategies can be developed using animal models of diabetes; however, the duration and expense of these studies are prohibitive. Development of implantable closed-loop controlled insulin pumps would be accelerated if an accurate model of the glucose-insulin system were available to control algorithms. Dalla Man et al. (63) developed a computational model of the glucose-insulin system that includes the major glucose and insulin fluxes in response to a mixed meal. Model parameters were estimated in a patient-specific manner using data from glucose isotope labeling experiments. Models of glucose sensor errors for commercially available systems and insulin kinetics in the subcutaneous space were integrated with the glucose-insulin metabolism model (64).
With these model components, a simulation system was developed in which (i) glucose-insulin fluxes following meal ingestion are simulated, (ii) simulation results are input to the glucose sensor model, (iii) output of the glucose sensor is input to the control algorithm under development, (iv) control signals produced by the algorithm are input to the insulin pump model, and (v) simulated insulin delivery is input to the diabetes model (64). Together, this system enabled the testing of closed-loop glucose control strategies. This model-based computational system for testing strategies for controlling type 1 diabetes using implantable insulin pumps was sufficiently predictive that, in 2008, the FDA approved this system for testing closed-loop insulin pumps in lieu of animal models.
Challenges to be addressed in future work include developing artificial pancreas control strategies specialized to different scenarios such as type 2 diabetes, diabetes in the setting of other systemic diseases, nighttime basal regulation, and control for preventing hypoglycemia in exercise. Use in outpatient settings will require development of remote monitoring and management tools, and approaches by which users will receive alerts. It will also require that the reliability and durability of these systems be established (65). Finally, it is possible to scan public spaces for insulin pump controllers and break into these devices to manipulate pump settings (66). In response, the Generic Infusion Pump Project (http://rtg.cis.upenn.edu/gip.php3) is using the open source approach to develop and test infusion pump designs and software so that the community can evaluate both the accuracy of design and correctness of code implementation, as well as security. Security has therefore emerged as a critical problem that must be solved for all medical devices using embedded software.
Heart disease
Among computational models of the various physiological systems, the heart is one of the most highly advanced examples of a “virtual organ.” One reason for this is that there is a long history of cardiac modeling, beginning more than 50 years ago with publication of the first model of the cardiac myocyte action potential (67). Since then, myocyte modeling has progressed rapidly by incorporating descriptions of many different subcellular processes and the ways they regulate properties such as the action potential (68). Models typically take the form of deterministic systems of coupled, nonlinear, ordinary differential equations that are integrated numerically to simulate timeevolving behaviors of the cell. Integrative myocyte models are now providing valuable insights into the molecular basis of cellular arrhythmias in heart disease (69, 70).
Cardiac modeling has also progressed to the level of the whole heart. The key step in achieving this goal has been the application of diffusion tensor MR imaging (DTMRI) to measure the anatomy, fiber, and sheet structure of the heart (71). Whole-heart image-based models take the form of reaction-diffusion partial differential equations, where the reaction term is specified by the system of equations modeling the myocyte, and the diffusion term is specified by the image-based measurements of heart anatomy along with estimated cell-to-cell coupling by gap junctions. This has led to a new generation of whole-heart image-based models with unprecedented structural and biophysical detail, including cardiac electromechanics (72), and even models integrating from the levels of cellular electrophysiology to electromechanics, to fluid dynamics of blood flow within the left ventricle (73). These models are being used to gain insights into mechanisms of arrhythmia in the setting of idiopathic dilated cardiomyopathy (74), myocardial ischemia (75), and channelopathies (76). The models are being applied in a patient-specific manner to investigate improved methods for cardiac resynchronization therapy in dyssynchronous heart failure (movie S1) (77, 78).
A major thrust in computational physiology is to use models as a test bed for evaluation of new antiarrhythmic drug therapies. It is now possible to collect the experimental data needed to constrain models of ion channel gating and drug binding, and use these data to test hypotheses regarding mechanisms of drug action on heart cells and tissues (79, 80) as well as whole heart (81). Furthermore, multiscale heart models of antiarrhythmic drug interactions with ion channels have provided insights into why certain pharmacological interventions result in proarrhythmia, whereas others do not (81). This work has the potential to more effectively guide the drug development pipeline—a process that is well known to have high failure rate and expense.
The feasibility of subject-specific modeling has been demonstrated through the use of animal models of infarcted hearts, which have shown good correspondence between in silico and experimental maps of wavefront propagation, and predict mechanisms of infarct-related ventricular tachycardia (VT) (82). The advancing capabilities of MR and CT (computed tomography) imaging now make it possible to construct models of an individual patient heart (Fig. 4). Detailed heart model reconstructed from clinical MRI scans has been used to evaluate infarct-related VT, which may help predict optimal locations of catheter ablation in individual patient hearts (83, 84).
Fig. 4.
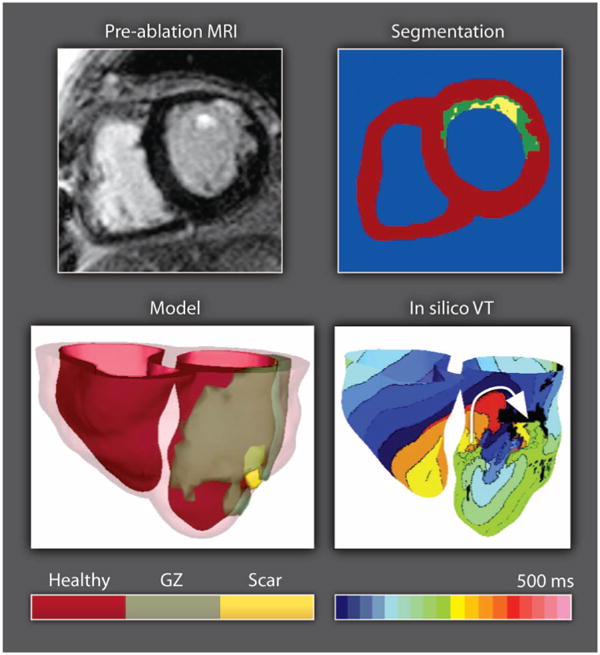
Modeling electrical activity in the infarcted heart. Clinical MR scan of an infarcted patient heart before ablation (treatment) and the corresponding segmentation: healthy (red), gray zone (GZ) of functional but impaired tissue surrounding the scar (green), or scar (yellow). A three-dimensional geometric model of the patient heart was rendered with the epicardium and the infarct border zone semitransparent. An in silico activation map of VT reveals reentry on the left ventricular endocardium. The color code in the bottom right shows electrical activation time.
The use of heart models in personalized diagnosis, treatment planning, and prevention of sudden cardiac death is slowly becoming a reality. Nevertheless, there are several challenges that need to be addressed to clear the way for the translation of patient-specific heart modeling into the clinic. First, heart disease also manifests with other diseases such as obesity, diabetes, or pulmonary edema. A major focus of the modeling community to date has been on understanding mechanisms of arrhythmia as a primary risk factor, so understanding it in these more complicated settings of comorbidity must be addressed. Second, clinical heart imaging data are currently of low spatial resolution, limiting the ability to develop structural heart models with the spatial resolution needed to model electrical activation of the heart. More widespread use of state-of-the-art CT systems with large numbers of detectors and better spatiotemporal resolution will help resolve this problem (85). Third, broader use of cardiac models in treatment planning will require real-time information and model adjustment using patient-specific cardiac electrophysiological and mechanical information. Finally, to implement heart modeling at the bedside, improved approaches for high-speed simulations will need to be developed.
Computational Anatomy
Advances in imaging technology have progressed to the point where it can be argued that the interpretation of medical images for disease diagnosis is no longer limited by poor image quality, but rather is limited by inherent subject-to-subject variation of anatomies in health and disease. Understanding how ensembles of anatomies differ within and between healthy and diseased states has required the development of a mathematical theory of shape and its variation—an approach known as computational anatomy (CA) (86–88). In CA methods, a global shape model (template) representing typical structures in an ensemble of anatomic image volumes is constructed. To illustrate one approach to CA, an example template of the hippocampus constructed from a set of MR image volumes collected in a study of structural brain changes in Alzheimer's disease (AD) is shown in Fig. 5A (88). Variation within the ensemble of targets (the hippocampi surrounding the template) is captured by defining geometric transformations that perform the dilation, contraction, and warping needed to map each voxel of the hippocampal template anatomy onto corresponding pixels of the individual hippocampi (89).
Fig. 5.
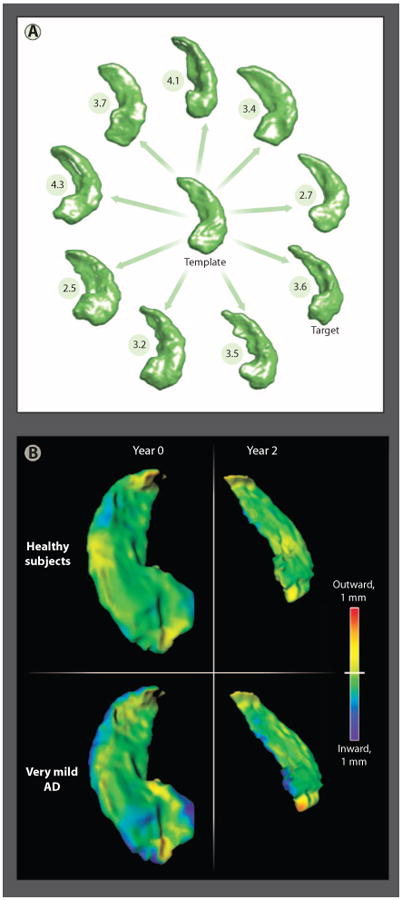
Methods of computational anatomy. (A) A sample of hippocampi from a population of healthy subjects (n = 57) and subjects with very mild AD (n = 38) (88). The anatomical template was generated from all hippocampi from this study. Also shown are the distances between nine individual hippocampi selected from the population and the template. (B) Patterns of hippocampal shape change over a 2-year period in healthy elderly subjects and subjects with very mild AD (90). The shape and volume changes revealed using CA methods support the detection of AD onset.
Because these transformations are invertible, CA methods can be described as placing each of the individual target anatomies into a common coordinate system—that of the template. This set of transformations can then be analyzed to determine the distance between each target and the template (numbers in Fig. 5A) and the significant dilations and contractions that distinguish anatomic structures in health from those in disease. Figure 5B shows patterns of hippocampal change over a 2-year period in healthy subjects (top row) and subjects with very mild AD. Detection of very mild AD in the elderly has been performed, where a statistical measure of the rate of shape and volume change over a 2-year period separated the two populations (90).
Applications: Modeling The Shape of Disease
There are three major directions of research in CA. The first is theory and tool development (91-95). The second is understanding alteration of brain structure in neuropsychiatric illnesses and neurodegenerative diseases (96-100). The third, which builds on the ability to detect these anatomic changes, is to couple the benefits of modern high-resolution imaging techniques with CA methods to perform early detection of disease.
Csernansky et al. (96) showed that hippocampal shape changes were predictive of progression of nondemented elderly subjects from a score of 0 (no dementia) on the Clinical Dementia Rating scale to a score of 0.5 (very mild dementia). McEvoy et al. (101) separated healthy controls from subjects with mild AD with 83% sensitivity and 93% specificity. Subjects diagnosed with mild cognitive impairment with the AD shape phenotype showed a significant 1-year cognitive decline. This predictive indicator of decline could be important as a clinical marker. Moreover, a fully automated data analysis pipeline for differentiating very mild dementia from normal elderly subjects has been implemented (102), demonstrating the feasibility of applying these algorithms in the clinical setting.
CA methods have compelling use in neonatal neurology because it is difficult to diagnose neurological disease in neonates during the first year of life. As a first step in this direction, a neonatal brain atlas has been developed (103) using images from normal neonates ranging in age from 37 to 53 weeks after conception. The atlas is a template describing anatomical regions of the brain and the premyelinated structures connecting them. The template was segmented into 122 different brain regions. Transformations taking the neonatal brain atlas onto targets carry with them the location of these different brain regions. Ensembles of target brains can then be analyzed region by region for structural differences. The authors used this atlas to better understand the time course of changes in neonatal brain structures with cognitive function. A future application could be to detect neurodevelopmental disorders within the first few months after birth.
The flood of new information from MR scanners is a substantial bottleneck in radiological diagnosis. However, with 30-min scan times already presenting a premium in terms of health care costs, use of automated methods to perform brain shape analysis and diagnosis must be faster and more sensitive and specific. The major challenge to be confronted by next-generation CA methods is to achieve both high sensitivity and specificity so as not to increase false alarm rate. Developing these methods will require large case study data sets to be online and indexed to support application of machine-learning methods.
The Future of Computational Medicine
We are poised at an exciting moment in medicine. The fruits of reductionist biology; the advances in high-throughput assays; the emergence of new technologies for measuring properties of cells, tissues, and organ function; and the continuing consequences of Moore's law and its impact on computational science are coming together to drive the creation of new, quantitative, model-based approaches to medicine. To date, the primary accomplishment of computational medicine has been to provide us with a more quantitative, deeper understanding of disease. There are few applications of computational medicine that are, as of yet, in routine clinical use. Each of the model applications in cancer, diabetes, and heart disease described here is in the early stages of development. It is a long road from medical discovery to translation and clinical application. Clinical translation of model-based approaches requires sufficient evidence to convince regulatory agencies to approve clinical trials. Once in clinical trials, it will be necessary to show that clinical outcomes are improved before widespread use will be achieved.
Despite these challenges, we have described how CA methods have been applied successfully in several different disease settings. In addition, CA algorithms have recently been used directly in the clinic in the form of an iPad application. This application helps physicians select deep brain stimulation parameters by mapping an image of the patient's brain and electrode position onto a brain atlas, and then simulating distribution of current within the brain given brain structure, electrode placement, and conduction parameters (104, 105). This allows selection of stimulus parameters that localize current to the structures that should be stimulated. CA methods will likely transition to additional clinical applications over the next several years. Methods of computational molecular medicine have already led to FDA-approved assays (16), and their performance will improve as new methods of data collection and biomarker identification and validation are developed. Applications of personalized physiological models in medicine are being developed for brain, heart, cancer, diabetes, and lung disease (106). Owing to advances in imaging capabilities and ever increasing computational power, improvements in predictive ability of these models as well as approaches for constraining models using clinical data are being made rapidly. Each of the computational areas described in this review has potential for application in personalized medicine. Computational medicine will continue to grow as a discipline because it is providing a new, quantitative approach to understanding, detecting, and treating disease at the level of the individual.
Supplementary Material
www.sciencetranslationalmedicine.org/cgi/content/full/4/158/158rv11/DC1
Movie S1. Electromechanical simulations of left bundle branch block (LBBB) and cardiac resynchronization therapy (CRT) with a biophysically detailed, MRI-based electromechanical model of the dyssynchronous failing canine heart.
Acknowledgments
We thank the NIH and the NSF for their continuing support of this research. We also thank the faculty of the Institute for Computational Medicine for their support.
References and Notes
- 1.Crick F. Central dogma of molecular biology. Nature. 1970;227:561–563. doi: 10.1038/227561a0. [DOI] [PubMed] [Google Scholar]
- 2.Licatalosi DD, Darnell RB. RNA processing and its regulation: Global insights into biological networks. Nat Rev Genet. 2010;11:75–87. doi: 10.1038/nrg2673. [DOI] [PMC free article] [PubMed] [Google Scholar]
- 3.Dolmetsch R. Excitation-transcription coupling: Signaling by ion channels to the nucleus. Sci STKE. 2003;2003:PE4. doi: 10.1126/stke.2003.166.pe4. [DOI] [PubMed] [Google Scholar]
- 4.Frank D, Kuhn C, Brors B, Hanselmann C, Lüdde M, Katus HA, Frey N. Gene expression pattern in biomechanically stretched cardiomyocytes: Evidence for a stretch-specific gene program. Hypertension. 2008;51:309–318. doi: 10.1161/HYPERTENSIONAHA.107.098046. [DOI] [PubMed] [Google Scholar]
- 5.Jaenisch R, Bird A. Epigenetic regulation of gene expression: How the genome integrates intrinsic and environmental signals. Nat Genet. 2003;33:245–254. doi: 10.1038/ng1089. [DOI] [PubMed] [Google Scholar]
- 6.Noble D. The Music of Life: Biology Beyond the Genome. Oxford Univ. Press; New York: 2006. [Google Scholar]
- 7.International Union of the Physiological Society. http://www.physiome.org.nz/
- 8.A Vision and Strategy for the VPH 2011. http://www.vph-noe.eu/images/vph_vision_ 2011_23dec2010.pdf.
- 9.Beard DA, Britten R, Cooling MT, Garny A, Halstead MD, Hunter PJ, Lawson J, Lloyd CM, Marsh J, Miller A, Nickerson DP, Nielsen PM, Nomura T, Subramanium S, Wimalaratne SM, Yu T. CellML metadata standards, associated tools and repositories. Philos Transact A Math Phys Eng Sci. 2009;367:1845–1867. doi: 10.1098/rsta.2008.0310. [DOI] [PMC free article] [PubMed] [Google Scholar]
- 10.Chang DC, Dokos S, Lovell NH. MML toolkit and work flow overview: Creating temporo-spatial heart models from CellML. Conf Proc IEEE Eng Med Biol Soc. 2010;2010:1481–1484. doi: 10.1109/IEMBS.2010.5626847. [DOI] [PubMed] [Google Scholar]
- 11.Lloyd CM, Lawson JR, Hunter PJ, Nielsen PF. The CellML Model Repository. Bioinformatics. 2008;24:2122–2123. doi: 10.1093/bioinformatics/btn390. [DOI] [PubMed] [Google Scholar]
- 12.Hood L, Heath JR, Phelps ME, Lin BY. Systems biology and new technologies enable predictive and preventative medicine. Science. 2004;306:640–643. doi: 10.1126/science.1104635. [DOI] [PubMed] [Google Scholar]
- 13.Schadt EE, Björkegren JL. NEW: Network-enabled wisdom in biology, medicine, and health care. Sci Transl Med. 2012;4:115rv1. doi: 10.1126/scitranslmed.3002132. [DOI] [PubMed] [Google Scholar]
- 14.Sage/DREAM breast cancer prognosis challenge. https://synapse.sagebase.org/#BCCOverview:0.
- 15.Saria S, Rajani AK, Gould J, Koller D, Penn AA. Integration of early physiological responses predicts later illness severity in preterm infants. Sci Transl Med. 2010;2:48ra65. doi: 10.1126/scitranslmed.3001304. [DOI] [PMC free article] [PubMed] [Google Scholar]
- 16.FDA List of Approved Devices. http://www.fda.gov/MedicalDevices/ProductsandMedicalProcedures/DeviceApprovalsandClearances/Recently-ApprovedDevices/default.htm.
- 17.Marchionni L, Wilson RF, Wolff AC, Marinopoulos S, Parmigiani G, Bass EB, Goodman SN. Systematic review: Gene expression profiling assays in early-stage breast cancer. Ann Intern Med. 2008;148:358–369. doi: 10.7326/0003-4819-148-5-200803040-00208. [DOI] [PubMed] [Google Scholar]
- 18.van't Veer LJ, Dai H, van de Vijver MJ, He YD, Hart AAM, Mao M, Peterse HL, van der Kooy K, Marton MJ, Witteveen AT, Schreiber GJ, Kerkhoven RM, Roberts C, Linsley PS, Bernards R, Friend SH. Gene expression profiling predicts clinical outcome of breast cancer. Nature. 2002;415:530–536. doi: 10.1038/415530a. [DOI] [PubMed] [Google Scholar]
- 19.Leek JT, Scharpf RB, Bravo HC, Simcha D, Langmead B, Johnson WE, Geman D, Baggerly K, Irizarry RA. Tackling the widespread and critical impact of batch effects in high-throughput data. Nat Rev Genet. 2010;11:733–739. doi: 10.1038/nrg2825. [DOI] [PMC free article] [PubMed] [Google Scholar]
- 20.Geman D, d'Avignon C, Naiman DQ, Winslow RL. Classifying gene expression profiles from pairwise mRNA comparisons. Stat Appl Genet Mol Biol. 2004;3 doi: 10.2202/1544-6115.1071. Article19. [DOI] [PMC free article] [PubMed] [Google Scholar]
- 21.Hastie T, Tibshirani R, Friedman J. The Elements of Statistical Learning: Data Mining, Inference, and Prediction. Springer Science+Business Media, LLC; New York: 2009. [Google Scholar]
- 22.Geman S, Bienenstock E, Doursat R. Neural networks and the bias/variance dilemma. Neural Comput. 1992;4:1–58. [Google Scholar]
- 23.Varadan V, Mittal P, Vaske CJ, Benz SC. The integration of biological pathway knowledge in cancer genomics: A review of existing computational approaches. IEEE Signal Process Mag. 2012;29:35–50. [Google Scholar]
- 24.Khan J, Wei JS, Ringnér M, Saal LH, Ladanyi M, Westermann F, Berthold F, Schwab M, Antonescu CR, Peterson C, Meltzer PS. Classification and diagnostic prediction of cancers using gene expression profiling and artificial neural networks. Nat Med. 2001;7:673–679. doi: 10.1038/89044. [DOI] [PMC free article] [PubMed] [Google Scholar]
- 25.Zhang H, Yu CY, Singer B. Cell and tumor classification using gene expression data: Construction of forests. Proc Natl Acad Sci U S A. 2003;100:4168–4172. doi: 10.1073/pnas.0230559100. [DOI] [PMC free article] [PubMed] [Google Scholar]
- 26.Yeang CH, Ramaswamy S, Tamayo P, Mukherjee S, Rifkin RM, Angelo M, Reich M, Lander E, Mesirov J, Golub T. Molecular classification of multiple tumor types. Bioinformatics. 2001;17(Suppl. 1):S316–S322. doi: 10.1093/bioinformatics/17.suppl_1.s316. [DOI] [PubMed] [Google Scholar]
- 27.Dudoit S, Fridlyand J, Speed TP. Comparison of discrimination methods for the classification of tumors using gene expression data. J Am Stat Assoc. 2002;97:77–87. [Google Scholar]
- 28.Price ND, Trent J, El-Naggar AK, Cogdell D, Taylor E, Hunt KK, Pollock RE, Hood L, Shmulevich I, Zhang W. Highly accurate two-gene classifier for differentiating gastrointestinal stromal tumors and leiomyosarcomas. Proc Natl Acad Sci U S A. 2007;104:3414–3419. doi: 10.1073/pnas.0611373104. [DOI] [PMC free article] [PubMed] [Google Scholar]
- 29.Weichselbaum RR, Ishwaran H, Yoon T, Nuyten DSA, Baker SW, Khodarev N, Su AW, Shaikh AY, Roach P, Kreike B, Roizman B, Bergh J, Pawitan Y, van de Vijver MJ, Minn AJ. An interferon-related gene signature for DNA damage resistance is a predictive marker for chemotherapy and radiation for breast cancer. Proc Natl Acad Sci U S A. 2008;105:18490–18495. doi: 10.1073/pnas.0809242105. [DOI] [PMC free article] [PubMed] [Google Scholar]
- 30.Zhao H, Logothetis CJ, Gorlov IP. Usefulness of the top-scoring pairs of genes for prediction of prostate cancer progression. Prostate Cancer Prostatic Dis. 2010;13:252–259. doi: 10.1038/pcan.2010.9. [DOI] [PMC free article] [PubMed] [Google Scholar]
- 31.Patnaik SK, Kannisto E, Knudsen S, Yendamuri S. Evaluation of microRNA expression profiles that may predict recurrence of localized stage I non–small cell lung cancer after surgical resection. Cancer Res. 2010;70:36–45. doi: 10.1158/0008-5472.CAN-09-3153. [DOI] [PubMed] [Google Scholar]
- 32.Khatri P, Sirota M, Butte AJ. Ten years of pathway analysis: Current approaches and outstanding challenges. PLoS Comput Biol. 2012;8:e1002375. doi: 10.1371/journal.pcbi.1002375. [DOI] [PMC free article] [PubMed] [Google Scholar]
- 33.Eddy JA, Hood L, Price ND, Geman D. Identifying tightly regulated and variably expressed networks by Differential Rank Conservation (DIRAC) PLoS Comput Biol. 2010;6:e1000792. doi: 10.1371/journal.pcbi.1000792. [DOI] [PMC free article] [PubMed] [Google Scholar]
- 34.Fertig EJ, Lu HHS, Danilova LV, Schölkopf B, Ochs MF, Zhao H. Handbook of Statistical Bioinformatics. Springer; Berlin: 2011. pp. 533–565. [Google Scholar]
- 35.Pe'er D, Hacohen N. Principles and strategies for developing network models in cancer. Cell. 2011;144:864–873. doi: 10.1016/j.cell.2011.03.001. [DOI] [PMC free article] [PubMed] [Google Scholar]
- 36.Zerbino DR, Paten B, Haussler D. Integrating genomes. Science. 2012;336:179–182. doi: 10.1126/science.1216830. [DOI] [PubMed] [Google Scholar]
- 37.Yörük E, Ochs MF, Geman D, Younes L. A comprehensive statistical model for cell signaling. IEEE/ACM Trans Comput Biol Bioinform. 2011;8:592–606. doi: 10.1109/TCBB.2010.87. [DOI] [PMC free article] [PubMed] [Google Scholar]
- 38.Akavia UD, Litvin O, Kim J, Sanchez-Garcia F, Kotliar D, Causton HC, Pochanard P, Mozes E, Garraway LA, Pe'er D. An integrated approach to uncover drivers of cancer. Cell. 2010;143:1005–1017. doi: 10.1016/j.cell.2010.11.013. [DOI] [PMC free article] [PubMed] [Google Scholar]
- 39.Ahmad FK, Deris S, Othman NH. The inference of breast cancer metastasis through gene regulatory networks. J Biomed Inform. 2012;45:350–362. doi: 10.1016/j.jbi.2011.11.015. [DOI] [PubMed] [Google Scholar]
- 40.Cheng YK, Beroukhim R, Levine RL, Mellinghoff IK, Holland EC, Michor F. A mathematical methodology for determining the temporal order of pathway alterations arising during gliomagenesis. PLoS Comput Biol. 2012;8:e1002337. doi: 10.1371/journal.pcbi.1002337. [DOI] [PMC free article] [PubMed] [Google Scholar]
- 41.Pahle J. Biochemical simulations: Stochastic, approximate stochastic and hybrid approaches. Brief. Bioinform. 2009;10:53–64. doi: 10.1093/bib/bbn050. [DOI] [PMC free article] [PubMed] [Google Scholar]
- 42.Keener J, Sneyd J. Mathematical Physiology. Springer; New York: 2009. [Google Scholar]
- 43.Thorne BC, Bailey AM, Peirce SM. Combining experiments with multi-cell agent-based modeling to study biological tissue patterning. Brief Bioinform. 2007;8:245–257. doi: 10.1093/bib/bbm024. [DOI] [PubMed] [Google Scholar]
- 44.Aldridge BB, Burke JM, Lauffenburger DA, Sorger PK. Physicochemical modelling of cell signalling pathways. Nat Cell Biol. 2006;8:1195–1203. doi: 10.1038/ncb1497. [DOI] [PubMed] [Google Scholar]
- 45.Deisboeck TS, Wang Z, Macklin P, Cristini V. Multiscale cancer modeling. Annu Rev Biomed Eng. 2011;13:127–155. doi: 10.1146/annurev-bioeng-071910-124729. [DOI] [PMC free article] [PubMed] [Google Scholar]
- 46.Hatzikirou H, Chauviere A, Bauer AL, Leier A, Lewis MT, Macklin P, Marquez-Lago TT, Bearer EL, Cristini V. Integrative physical oncology. Wiley Interdiscip Rev Syst Biol Med. 2012;4:1–14. doi: 10.1002/wsbm.158. [DOI] [PMC free article] [PubMed] [Google Scholar]
- 47.Byrne HM. Dissecting cancer through mathematics: From the cell to the animal model. Nat Rev Cancer. 2010;10:221–230. doi: 10.1038/nrc2808. [DOI] [PubMed] [Google Scholar]
- 48.Macklin P, Edgerton ME, Thompson AM, Cristini V. Patient-calibrated agent-based modelling of ductal carcinoma in situ (DCIS): From microscopic measurements to macroscopic predictions of clinical progression. J Theor Biol. 2012;301:122–140. doi: 10.1016/j.jtbi.2012.02.002. [DOI] [PMC free article] [PubMed] [Google Scholar]
- 49.Thomas SR, Tahi F, Harris P, Lonie A. The Renal Physiome Project, 2006 3rd IEEE International Symposium on Biomedical Imaging: Macro to Nano. 2006;1–3:820–823. [Google Scholar]
- 50.Thomas SR. Kidney modeling and systems physiology. Wiley Interdiscip Rev Syst Biol Med. 2009;1:172–190. doi: 10.1002/wsbm.14. [DOI] [PubMed] [Google Scholar]
- 51.Tawhai MH, Hoffman EA, Lin CL. The lung physiome: Merging imaging-based measures with predictive computational models. Wiley Interdiscip Rev Syst Biol Med. 2009;1:61–72. doi: 10.1002/wsbm.17. [DOI] [PMC free article] [PubMed] [Google Scholar]
- 52.Popel AS, Greene AS, Ellis CG, Ley KF, Skalak TC, Tonellato PJ. The Micro-circulation Physiome Project. Ann Biomed Eng. 1998;26:911–913. doi: 10.1114/1.112. [DOI] [PubMed] [Google Scholar]
- 53.Clayton RH, Bernus O, Cherry EM, Dierckx H, Fenton FH, Mirabella L, Panfilov AV, Sachse FB, Seemann G, Zhang H. Models of cardiac tissue electrophysiology: Progress, challenges and open questions. Prog Biophys Mol Biol. 2011;104:22–48. doi: 10.1016/j.pbiomolbio.2010.05.008. [DOI] [PubMed] [Google Scholar]
- 54.Cheng LK, Komuro R, Austin TM, Buist ML, Pullan AJ. Anatomically realistic multiscale models of normal and abnormal gastrointestinal electrical activity. World J Gastroenterol. 2007;13:1378–1383. doi: 10.3748/wjg.v13.i9.1378. [DOI] [PMC free article] [PubMed] [Google Scholar]
- 55.Mirsky HP, Miller MJ, Linderman JJ, Kirschner DE. Systems biology approaches for understanding cellular mechanisms of immunity in lymph nodes during infection. J Theor Biol. 2011;287:160–170. doi: 10.1016/j.jtbi.2011.06.037. [DOI] [PMC free article] [PubMed] [Google Scholar]
- 56.Fallahi-Sichani M, El-Kebir M, Marino S, Kirschner DE, Linderman JJ. Multiscale computational modeling reveals a critical role for TNF-α receptor 1 dynamics in tuberculosis granuloma formation. J Immunol. 2011;186:3472–3483. doi: 10.4049/jimmunol.1003299. [DOI] [PMC free article] [PubMed] [Google Scholar]
- 57.Hori SS, Gambhir SS. Mathematical model identifies blood biomarker–based early cancer detection strategies and limitations. Sci Transl Med. 2011;3:109ra116. doi: 10.1126/scitranslmed.3003110. [DOI] [PMC free article] [PubMed] [Google Scholar]
- 58.Swanson KR, Rostomily RC, Alvord EC., Jr A mathematical modelling tool for predicting survival of individual patients following resection of glioblastoma: A proof of principle. Br J Cancer. 2008;98:113–119. doi: 10.1038/sj.bjc.6604125. [DOI] [PMC free article] [PubMed] [Google Scholar]
- 59.Rockne R, Rockhill JK, Mrugala M, Spence AM, Kalet I, Hendrickson K, Lai A, Cloughesy T, Alvord EC, Jr, Swanson KR. Predicting the efficacy of radiotherapy in individual glioblastoma patients in vivo: A mathematical modeling approach. Phys Med Biol. 2010;55:3271–3285. doi: 10.1088/0031-9155/55/12/001. [DOI] [PMC free article] [PubMed] [Google Scholar]
- 60.Schoeberl B, Pace EA, Fitzgerald JB, Harms BD, Xu L, Nie L, Linggi B, Kalra A, Paragas V, Bukhalid R, Grantcharova V, Kohli N, West KA, Leszczyniecka M, Feldhaus MJ, Kudla AJ, Nielsen UB. Therapeutically targeting ErbB3: A key node in ligand-induced activation of the ErbB receptor–PI3K axis. Sci Signal. 2009;2:ra31. doi: 10.1126/scisignal.2000352. [DOI] [PubMed] [Google Scholar]
- 61.MM-121 Clinical Trials. http://clinicaltrials.gov/ct2/results?term=mm-121&lSearch=Search.
- 62.Artificial Pancreas Consortium. http://www.artificialpancreasproject.com/
- 63.Dalla Man C, Rizza RA, Cobelli C. Meal simulation model of the glucose-insulin system. IEEE Trans Biomed Eng. 2007;54:1740–1749. doi: 10.1109/TBME.2007.893506. [DOI] [PubMed] [Google Scholar]
- 64.Kovatchev BP, Breton M, Man CD, Cobelli C. In silico preclinical trials: A proof of concept in closed-loop control of type 1 diabetes. J Diabetes Sci Technol. 2009;3:44–55. doi: 10.1177/193229680900300106. [DOI] [PMC free article] [PubMed] [Google Scholar]
- 65.Cobelli C, Renard E, Kovatchev B. Artificial pancreas: Past, present, future. Diabetes. 2011;60:2672–2682. doi: 10.2337/db11-0654. [DOI] [PMC free article] [PubMed] [Google Scholar]
- 66.McAfee hacker says Medtronic insulin pumps vulnerable to attack. http://www. bloomberg.com/news/2012-02-29/mcafee-hacker-says-medtronic-insulin-pumps-vulnerable-to-attack.html.
- 67.Noble D. Cardiac action and pacemaker potentials based on the Hodgkin-Huxley equations. Nature. 1960;188:495–497. doi: 10.1038/188495b0. [DOI] [PubMed] [Google Scholar]
- 68.Winslow RL, Cortassa S, O'Rourke B, Hashambhoy YL, Rice JJ, Greenstein JL. Integrative modeling of the cardiac ventricular myocyte. Wiley Interdiscip Rev Syst Biol Med. 2011;3:392–413. doi: 10.1002/wsbm.122. [DOI] [PMC free article] [PubMed] [Google Scholar]
- 69.Clancy CE, Rudy Y. Na+ channel mutation that causes both Brugada and long-QT syndrome phenotypes: A simulation study of mechanism. Circulation. 2002;105:1208–1213. doi: 10.1161/hc1002.105183. [DOI] [PMC free article] [PubMed] [Google Scholar]
- 70.Saucerman JJ, Healy SN, Belik ME, Puglisi JL, McCulloch AD. Proarrhythmic consequences of a KCNQ1 AKAP-binding domain mutation: Computational models of whole cells and heterogeneous tissue. Circ Res. 2004;95:1216–1224. doi: 10.1161/01.RES.0000150055.06226.4e. [DOI] [PubMed] [Google Scholar]
- 71.Helm PA, Tseng HJ, Younes L, McVeigh ER, Winslow RL. Ex vivo 3D diffusion tensor imaging and quantification of cardiac laminar structure. Magn Reson Med. 2005;54:850–859. doi: 10.1002/mrm.20622. [DOI] [PMC free article] [PubMed] [Google Scholar]
- 72.Gurev V, Lee T, Constantino J, Arevalo H, Trayanova NA. Models of cardiac electromechanics based on individual hearts imaging data: Image-based electromechanical models of the heart. Biomech Model Mechanobiol. 2011;10:295–306. doi: 10.1007/s10237-010-0235-5. [DOI] [PMC free article] [PubMed] [Google Scholar]
- 73.Sugiura S, Washio T, Hatano A, Okada J, Watanabe H, Hisada T. Multi-scale simulations of cardiac electrophysiology and mechanics using the University of Tokyo heart simulator. Prog Biophys Mol Biol. 2012 doi: 10.1016/j.pbiomolbio.2012.07.001. [DOI] [PubMed] [Google Scholar]
- 74.Bayer JD, Narayan SM, Lalani GG, Trayanova NA. Rate-dependent action potential alternans in human heart failure implicates abnormal intracellular calcium handling. Heart Rhythm. 2010;7:1093–1101. doi: 10.1016/j.hrthm.2010.04.008. [DOI] [PMC free article] [PubMed] [Google Scholar]
- 75.McDowell KS, Arevalo HJ, Maleckar MM, Trayanova NA. Susceptibility to arrhythmia in the infarcted heart depends on myofibroblast density. Biophys J. 2011;101:1307–1315. doi: 10.1016/j.bpj.2011.08.009. [DOI] [PMC free article] [PubMed] [Google Scholar]
- 76.Benson AP, Al-Owais M, Holden AV. Quantitative prediction of the arrhythmogenic effects of de novo hERG mutations in computational models of human ventricular tissues. Eur Biophys J. 2011;40:627–639. doi: 10.1007/s00249-010-0663-2. [DOI] [PubMed] [Google Scholar]
- 77.Niederer SA, Shetty AK, Plank G, Bostock J, Razavi R, Smith NP, Rinaldi CA. Biophysical modeling to simulate the response to multisite left ventricular stimulation using a quadripolar pacing lead. Pacing Clin Electrophysiol. 2012;35:204–214. doi: 10.1111/j.1540-8159.2011.03243.x. [DOI] [PMC free article] [PubMed] [Google Scholar]
- 78.Kerckhoffs RC, McCulloch AD, Omens JH, Mulligan LJ. Effects of biventricular pacing and scar size in a computational model of the failing heart with left bundle branch block. Med Image Anal. 2009;13:362–369. doi: 10.1016/j.media.2008.06.013. [DOI] [PMC free article] [PubMed] [Google Scholar]
- 79.Clancy CE, Zhu ZI, Rudy Y. Pharmacogenetics and anti-arrhythmic drug therapy: A theoretical investigation. Am J Physiol Heart Circ Physiol. 2007;292:H66–H75. doi: 10.1152/ajpheart.00312.2006. [DOI] [PMC free article] [PubMed] [Google Scholar]
- 80.Morita N, Lee JH, Xie Y, Sovari A, Qu Z, Weiss JN, Karagueuzian HS. Suppression of re-entrant and multifocal ventricular fibrillation by the late sodium current blocker ranolazine. J Am Coll Cardiol. 2011;57:366–375. doi: 10.1016/j.jacc.2010.07.045. [DOI] [PMC free article] [PubMed] [Google Scholar]
- 81.Moreno JD, Zhu ZI, Yang PC, Bankston JR, Jeng MT, Kang C, Wang L, Bayer JD, Christini DJ, Trayanova NA, Ripplinger CM, Kass RS, Clancy CE. A computational model to predict the effects of class I anti-arrhythmic drugs on ventricular rhythms. Sci Transl Med. 2011;3:98ra83. doi: 10.1126/scitranslmed.3002588. [DOI] [PMC free article] [PubMed] [Google Scholar]
- 82.Arevalo H, Plank G, Helm P, Halperin H, Trayanova N. Volume of peri-infarct zone determines arrhythmogenesis in infarcted hearts. Heart Rhythm. 2009;6:S232–S233. [Google Scholar]
- 83.Ashikaga H, Arevalo H, Vadakkumpadan F, Blake R, Berger R, Calkins H, Trayanova N, Halperin H. MRI-based patient-specific virtual electrophysiology laboratory for scar-related ventricular tachycardia. Circulation. 2011;124:A541. [Google Scholar]
- 84.Relan J, Chinchapatnam P, Sermesant M, Rhode K, Ginks M, Delingette H, Rinaldi CA, Razavi R, Ayache N. Coupled personalization of cardiac electrophysiology models for prediction of ischaemic ventricular tachycardia. Interface Focus. 2011;1:396–407. doi: 10.1098/rsfs.2010.0041. [DOI] [PMC free article] [PubMed] [Google Scholar]
- 85.Halliburton S, Arbab-Zadeh A, Dey D, Einstein AJ, Gentry R, George RT, Gerber T, Mahesh M, Weigold WG. State-of-the-art in CT hardware and scan modes for cardiovascular CT. J Cardiovasc Comput Tomogr. 2012;6:154–163. doi: 10.1016/j.jcct.2012.04.005. [DOI] [PMC free article] [PubMed] [Google Scholar]
- 86.Miller M, Banerjee A, Christensen G, Joshi S, Khaneja N, Grenander U, Matejic L. Statistical methods in computational anatomy. Stat Methods Med Res. 1997;6:267–299. doi: 10.1177/096228029700600305. [DOI] [PubMed] [Google Scholar]
- 87.Grenander U, Miller MI. Computational anatomy: An emerging discipline. Q Appl Math. 1998;56:617–694. [Google Scholar]
- 88.Miller MI, Qiu A. The emerging discipline of computational functional anatomy. Neuroimage. 2009;45:S16–S39. doi: 10.1016/j.neuroimage.2008.10.044. [DOI] [PMC free article] [PubMed] [Google Scholar]
- 89.Haller JW, Banerjee A, Christensen GE, Gado M, Joshi S, Miller MI, Sheline Y, Vannier MW, Csernansky JG. Three-dimensional hippocampal MR morphometry with high-dimensional transformation of a neuroanatomic atlas. Radiology. 1997;202:504–510. doi: 10.1148/radiology.202.2.9015081. [DOI] [PubMed] [Google Scholar]
- 90.Csernansky JG, Wang L, Joshi SC, Ratnanather JT, Miller MI. Computational anatomy and neuropsychiatric disease: Probabilistic assessment of variation and statistical inference of group difference, hemispheric asymmetry, and time-dependent change. Neuroimage. 2004;23:S56–S68. doi: 10.1016/j.neuroimage.2004.07.025. [DOI] [PubMed] [Google Scholar]
- 91.Fischl B. FreeSurfer. Neuroimage. 2012;62:774–781. doi: 10.1016/j.neuroimage.2012.01.021. [DOI] [PMC free article] [PubMed] [Google Scholar]
- 92.Jenkinson M, Beckmann CF, Behrens TE, Woolrich MW, Smith SM. FSL. Neuroimage. 2012;62:782–790. doi: 10.1016/j.neuroimage.2011.09.015. [DOI] [PubMed] [Google Scholar]
- 93.Rex DE, Ma JQ, Toga AW. The LONI Pipeline Processing Environment. Neuroimage. 2003;19:1033–1048. doi: 10.1016/s1053-8119(03)00185-x. [DOI] [PubMed] [Google Scholar]
- 94.Jiang H, van Zijl PC, Kim J, Pearlson GD, Mori S. DtiStudio: Resource program for diffusion tensor computation and fiber bundle tracking. Comput Methods Programs Biomed. 2006;81:106–116. doi: 10.1016/j.cmpb.2005.08.004. [DOI] [PubMed] [Google Scholar]
- 95.Ashburner J. SPM: A history. Neuroimage. 2012;62:791–800. doi: 10.1016/j.neuroimage.2011.10.025. [DOI] [PMC free article] [PubMed] [Google Scholar]
- 96.Csernansky JG, Wang L, Swank J, Miller JP, Gado M, McKeel D, Miller MI, Morris JC. Preclinical detection of Alzheimer's disease: Hippocampal shape and volume predict dementia onset in the elderly. Neuroimage. 2005;25:783–792. doi: 10.1016/j.neuroimage.2004.12.036. [DOI] [PubMed] [Google Scholar]
- 97.Cobia DJ, Csernansky JG, Wang L. Cortical thickness in neuropsychologically near-normal schizophrenia. Schizophr Res. 2011;133:68–76. doi: 10.1016/j.schres.2011.08.017. [DOI] [PMC free article] [PubMed] [Google Scholar]
- 98.Oishi K, Ogawa M, Oya Y, Kawai M. Whole-brain voxel-based correlation analysis between regional cerebral blood flow and intelligence quotient score in Parkinson's disease. Eur Neurol. 2004;52:151–155. doi: 10.1159/000081624. [DOI] [PubMed] [Google Scholar]
- 99.Sepelyak K, Crinion J, Molitoris J, Epstein-Peterson Z, Bann M, Davis C, Newhart M, Heidler-Gary J, Tsapkini K, Hillis AE. Patterns of breakdown in spelling in primary progressive aphasia. Cortex. 2011;47:342–352. doi: 10.1016/j.cortex.2009.12.001. [DOI] [PMC free article] [PubMed] [Google Scholar]
- 100.Thompson PM, Dutton RA, Hayashi KM, Toga AW, Lopez OL, Aizenstein HJ, Becker JT. Thinning of the cerebral cortex visualized in HIV/AIDS reflects CD4+ T lymphocyte decline. Proc Natl Acad Sci U S A. 2005;102:15647–15652. doi: 10.1073/pnas.0502548102. [DOI] [PMC free article] [PubMed] [Google Scholar]
- 101.McEvoy LK, Fennema-Notestine C, Roddey JC, Hagler DJ, Jr, Holland D, Karow DS, Pung CJ, Brewer JB, Dale AM. Alzheimer's Disease Neuroimaging Initiative, Alzheimer disease: Quantitative structural neuroimaging for detection and prediction of clinical and structural changes in mild cognitive impairment. Radiology. 2009;251:195–205. doi: 10.1148/radiol.2511080924. [DOI] [PMC free article] [PubMed] [Google Scholar]
- 102.Wang L, Khan A, Csernansky JG, Fischl B, Miller MI, Morris JC, Beg MF. Fully-automated, multi-stage hippocampus mapping in very mild Alzheimer disease. Hippocampus. 2009;19:541–548. doi: 10.1002/hipo.20616. [DOI] [PMC free article] [PubMed] [Google Scholar]
- 103.Oishi K, Mori S, Donohue PK, Ernst T, Anderson L, Buchthal S, Faria A, Jiang H, Li X, Miller MI, van Zijl PC, Chang L. Multi-contrast human neonatal brain atlas: Application to normal neonate development analysis. Neuroimage. 2011;56:8–20. doi: 10.1016/j.neuroimage.2011.01.051. [DOI] [PMC free article] [PubMed] [Google Scholar]
- 104.Intelect Medical. http://www.intelectmedical.com/
- 105.Butson CR, Tamm G, Jain S, Fogal T, Kruger J. Evaluation of interactive visualization on mobile computing platforms for selection of deep brain stimulation parameters. IEEE Trans Vis Comput Graph. 2012 doi: 10.1109/TVCG.2012.92. [DOI] [PMC free article] [PubMed] [Google Scholar]
- 106.Tawhai MH, Clark AR, Wilsher ML, Milne DG, Subramaniam K, Burrowes KS. Spatial redistribution of perfusion and gas exchange in patient-specific models of pulmonary embolism, in 2012. 9th IEEE International Symposium on Biomedical Imaging (ISBI); 2012. [Google Scholar]
- 107.Sánchez R, Grau R. An algebraic hypothesis about the primeval genetic code architecture. Math Biosci. 2009;221:60–76. doi: 10.1016/j.mbs.2009.07.001. [DOI] [PubMed] [Google Scholar]
- 108.Barabási AL, Gulbahce N, Loscalzo J. Network medicine: A network-based approach to human disease. Nat Rev Genet. 2011;12:56–68. doi: 10.1038/nrg2918. [DOI] [PMC free article] [PubMed] [Google Scholar]
- 109.Peirce SM, Van Gieson EJ, Skalak TC. Multicellular simulation predicts microvascular patterning and in silico tissue assembly. FASEB J. 2004;18:731–733. doi: 10.1096/fj.03-0933fje. [DOI] [PubMed] [Google Scholar]
Associated Data
This section collects any data citations, data availability statements, or supplementary materials included in this article.
Supplementary Materials
www.sciencetranslationalmedicine.org/cgi/content/full/4/158/158rv11/DC1
Movie S1. Electromechanical simulations of left bundle branch block (LBBB) and cardiac resynchronization therapy (CRT) with a biophysically detailed, MRI-based electromechanical model of the dyssynchronous failing canine heart.