

Abstract
Forward genetic screen via mutagenesis is a powerful method for identifying regulatory factors in target pathways in model organisms such as the soil-dwelling free-living nematode Caenorhabditis elegans (C. elegans). Currently manual microscopy is the standard technique for conducting such screens; however, it is labor-intensive and time-consuming because screening requires imaging thousands of animals. Recently microfluidic chips have been developed to increase the throughput of some of such experiments; nonetheless, most of these chips are multilayer devices and complicated to fabricate and therefore prone to failure during fabrication and operation. In addition, most sorting decisions are made manually and the criteria used for sorting are subjective. To overcome these limitations, we developed a simple single-layer microfluidic device and an adaptive algorithm to make sorting decisions. The one-layer device greatly improves the reliability, while the quantitative analysis with adaptive algorithm allows for the identification of mutations that generate subtle changes in expression, which would have been hard to be detected by eye. The screening criterion is set based on the mutagenized population, not separate control populations measured prior to actual screening experiments, to account for stochasticity and day-to-day variations of gene expression in mutagenized worms. Moreover, during each experiment, the threshold is constantly updated to reflect the balance between maximizing sorting rate and minimizing false-positive rate. Using this system, we screened for mutants that have altered expression level of tryptophan hydroxylase, a key enzyme for serotonin synthesis in a CaMKII gain-of-function background. We found several putative mutants in this screen. Furthermore, this microfluidic system and quantitative analysis can be easily adapted to study other pathways in C. elegans.
Introduction
Caenorhabditis elegans (C. elegans) is a free living soil nematode; the adult worm is about 1 mm in length and has 959 cells.1 Since 1974, C. elegans has been broadly used for biological and medical research to characterize signaling mechanisms. Its transparent body, completely sequenced genome, mapped neuron wiring, short life cycle, and the ease of applying genetics has enabled great discoveries including programmed cell death and RNA interference.2–5 Many of the developmental mechanisms identified in C. elegans are conserved in more complex animals including humans.
Genetic screen, based on selecting a phenotype of interest in a mutated population, is a powerful tool to define components in pathways in C. elegans.1 This screening requires surveying large number of animals to find rare mutants.6 Since conventional manual microscopy to perform these screens is usually labor-intensive and time-consuming, it is challenging to identify the complete set of genes involved in a regulatory process. Moreover, human intervention and anaesthesia usage to inhibit worms’ movement during microscopy may affect the phenotype of interest and consistency of data. In contrast to manual screening method, the only commercially available high-throughput system, a complex object parametric analyzer and sorter (COPAS, Union Biometrica), is a modified flow cytometer for worms. This system has superior throughput and has been successfully used to analyze the spatiotemporal activities of promoters in large-scale.7–9 However, its application is limited because COPAS has essentially a one-dimensional tissue-level resolution and lower data content as compared to manual microscopy.
Recent development of microfluidic systems has increased the throughput of imaging experiments in high resolution.10–15 For example, Chung et al. reported automated microfluidic system with a sorting speed of 150 – 900 worms/hr depending on the magnification used and complexity of the screens.10 This system showed the ability to perform screens based on cellular and subcellular phenotypes. Some studies also reported the ability to perform laser ablations and sort the animals using microfluidic devices.16–18 However, most devices require a design with multiple layers, usually fluid and control layers, and thus the fabrication is complex, especially for non-expert end-users.
There are some single-layer devices developed for C. elegans.13–15, 19–20 Hulme et al. developed the array device to trap and image C. elegans, which is simple to make and easy to operate.14, 19 However, valve control to load and release worms cannot be automated in this device and thus it is not suitable for high-throughput imaging and sorting.21–22 Additionally, Chronis et al. reported the single-layer device to image neuronal and behavioral responses in C. elegans.13, 15 This device is designed to record responses from target neurons to odors, and a single outlet, thus not applicable to screening applications.
For screening applications, in addition to system requirement, another important element of quantitative screens is the sorting criterion, particularly in image-based ones. It is important to set a balanced criterion to sort putative mutants in screening: too relaxed criterion means large false positive rates and would unnecessarily increase the number of candidates to be scored to confirm positive hits, while a too strict threshold may result in missing mutants. Target mutants are sorted usually based on the changes of certain morphological markers, such as GFP transcriptional reporters. This selection in some scenarios is straightforward, but some changes are too subtle to be characterized even at high magnification. For example, changes in specific location or pattern of GFP expression are easier to be identified rather than changes in expression intensity in a single cell.
To overcome these limitations in the existing methods, we designed a simple algorithm for quantitative screening performed in a newly designed microfluidic device. The microfluidic device developed for imaging and sorting C. elegans is a single-layer device, where all sample, control, and cooling channels are in the same PDMS layer, unlike most of other imaging/sorting devices that use additional layers to gate samples by using push-up or push-down valves. The advantage of the single-layer design is that it avoids the requirement of precise alignment of multiple patterned layers; consequently several hours of fabrication time can be saved and the fabrication failure rate is decreased dramatically. The device is operated in a semi-automated manner using MATLAB software. Here we show that the throughput of up to 500 worms/hr is achieved with high reliability. In addition to microfluidics, we also used a quantitative adaptive algorithm for the sorting criterion. This algorithm minimizes efforts for verifying selected targets and can be integrated easily with any other quantitative screening platforms.
Using the integrated system, we screened for mutants in the transcriptional regulation of tryptophan hydroxylase (TPH; tph-1) in C. elegans. TPH is a rate-limiting enzyme for the synthesis of neurotransmitter serotonin, which is known to integrate environmental signals and modulate various neural functions such as mood, feeding, and aggression.23 Deficiency of serotonin signaling is associated with various mental disorders like depression.24–25 Moreover, deficient serotonin signaling leads to diseases like migraine, an episodic pain disorder, possibly through abnormal activity of calcium channel.26–27 For therapeutic interest or general inquiry to understand how environmental perception is mediated to change physiology, it is significant to identify the regulatory mechanism of serotonin production.
Among serotonergic neurons where the tph-1 is expressed, in this study, we focus on ADFL/R, since stressful environmental conditions such as starvation, aversive stimuli like pathogens, and high temperature increase the tph-1 expression in the ADF neurons.27–28 Many genetic factors including insulin-like peptides, transforming growth factor beta, and calcium signaling pathways are involved in regulating tph-1 expression in ADFL/R.23, 27, 29–30 For example, gain-of-function (gf) mutant of unc-43, a gene that encodes the calcium/calmodulin dependent protein kinase II (CaMKII) in C. elegans, increases tph-1 expression in ADFL/R and loss-of-function (lf) mutant of unc-43 decreases it. Here, we sought the molecular components in the signaling pathway of unc-43 that regulates tph-1 expression. The engineered high-throughput microfluidic system with the simple analysis enables us to find 43 putative mutants possibly relevant to this pathway in a relative short period of time.
Materials and methods
C. elegans culture and sample preparation
Strains of C. elegans used include GR1333 [yzIs71(Ptph-1::gfp; rol-6(d))], and mutant ZC5 [unc-43(n498); yzIs71(tph-1::gfp; rol-6(d))]. All worms were fed with E. coli OP50 and grown according to standard protocols at 20 °C or 25 °C.1 For each experiment, age-synchronized L4 or adult worms were suspended in M9 solution containing 0.02 wt% Triton X100 for imaging.
Isolation and characterization of putative double mutants
To perform screening for factors in the CaMKII-mediated regulation of tph-1, animals that express an integrated reporter Ptph-1::gfp in the unc-43(gf) mutant background were mutagenized (P0 generation) using ethylmethane sulfonate (EMS) with a standard mutagenesis protocol.1 Approximately 4,000 adult F2 progeny cultured at 20 °C were scored for reduction of TPH-1::GFP in the ADF neurons. After selection, each isolated mutant was cultured individually and its progeny cultured at 20 °C and 25 °C were imaged for characterization.
Fabrication of devices
Soft lithography was used to fabricate all single-layer devices in polydimethylsiloxane (PDMS) (Dow Corning Sylgard 184, Midland, MI).31 To make the masters, the conventional UV photolithographic processes were used to transfer features on transparency. The 50 μm-thick mold was fabricated using SU-8 2025 (Microchem) and the wafer surface was treated with tridecafluoro 1,1,2,2-tetrahydrooctyl-1-trichlorosilane vapor (United Chemical Technologies, Inc, Bristol, PA) to prevents the PDMS from adhering to the master. On top of the mold, the first layer (~1 mm; part A and B in a 20:1 ratio) was partially cured at 70 °C for 10 min. Then, for mechanical integrity, the second layer (~5 mm; 10:1) was poured on the first layer and cured at 70 °C for 2 hr.20 Finally, the whole PDMS layer was peeled off, cut into shape, punched for holes, and bonded onto a cover glass for complete devices.
System operation and image analysis
To control all components in the system semi-automatically, previously developed MATLAB routines were used.11 The z-stack (2-μm steps) images of worms were obtained at 20X objective using an EM CCD camera (Hamamatsu C9100-13).
For quantitative analysis, software code developed in MATLAB was used to flatten z-stack by computing the maximum projection of each stack. From the flattened images, target neurons were manually selected, and then the neuron intensity was automatically calculated in the MATLAB code with the following procedure: (1) nine pixels enclosing the center of each neuron were automatically selected, (2) their intensities were summed, (3) the intensities of background where TPH-1::GFP were not expressed were subtracted, And (4) the intensities of the two ADF neurons were averaged.
To balance the false positive rate and reasonable sorting rate, an adaptive algorithm was used. In this adaptive algorithm, the intensities of first 50 mutagenized worms were measured using the software code and the minimum value was set as the first screening threshold. Subsequently, the sorting criterion was updated every 50 worms to maintain a sorting rate of the lowest 2% of total worms.
Statistical analysis
Statistical analysis was performed by applying a two-tailed Students’ t test and Kolmogorov-Smirnov test (KS-test) to compare unc-43(gf) and the double mutants, as well as the temperature-dependent phenotypic changes on each selected mutant population.
Results and discussion
Performance of the one-layer microfluidic device
In order to perform the screen in a high-throughput manner, we developed a simple single-layer microfluidic device that can be operated robustly over long periods of time. This device has two outlets, and has the flow, control and cooling channels in the same layer (Fig 1a, b). Most microfluidic methods for imaging and sorting C. elegans use multilayer soft lithography to create complex microfluidic control components.10–12 Multilayer soft lithography is a typical fabrication method where layers of patterned elastomeric are aligned, stacked and bonded for three-dimensional (3D) microstructures,32–33 and enables completely closed valves.10 In comparison, our device uses partially closed side-valves that still allows fluid flow but stops the animals from passing. This single-layer design minimizes the complexity of the system. In the imaging zone, this small space remaining between the valves fits the worm’s head well and helps to position each worm in an identical location. Moreover, the fabrication process does not require any alignment process, and thus it enables fast fabrication with dramatically lowered failure rate and higher reliability than its multilayer counterpart (Fig 1c). These advantages allow the device to be easily replicated by users, especially by non-experts of microfluidics.
Fig. 1.
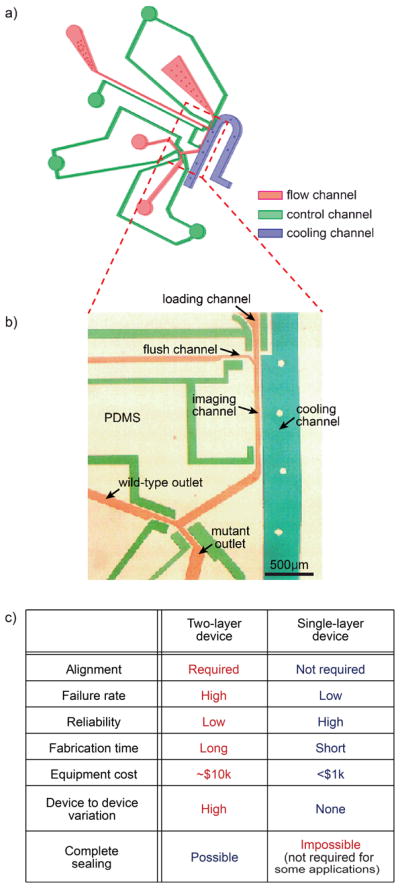
(a) 3D image of single-layer device (b) Optical micrograph of the imaging zone in a microdevice. The channels were filled with color dye to visualize features: blue, cooling channel; green, control valves; and red, sample flow channel. (c) Comparison between single-layer and double-layer devices.
Device operation is similar to previous work.10–11 Worms were loaded by pressure-driven flow and reliably positioned in the imaging zone by controlling the side valves. Once worms were loaded, they were immediately cooled because of the side cooling channel, then remain immobilized for <5 sec during the imaging process.10 To cool down only worms in the imaging zone, the cooling channel is designed to be close to the imaging channel; in contrast, there is enough distance to other parts of devices such as the input chamber and outlets so that their temperatures are not affected by the presence of the cooling channel. After being completely immobilized, worms were imaged and quantified for their expression level of a target gene (in this case Ptph-1::gfp). Based on the phenotype of the animal, it would be sorted as either mutant of interest (i.e., double mutant whose tph-1 expression level is lower than that of unc-43(gf) in here), or waste. This unloading process is very efficient and fast because of the use of the flushing channel.15 This sequence of operation is automated by a program developed in MATLAB. This yields a high throughput (up to 500 worms/hr, which is comparable with other microfluidic devices previously developed for imaging C. elegans10–11 and 1–2 orders of magnitude higher than conventional microscopy), and facilitates the screening performance for the regulation of a target gene. In general, the system can be easily integrated for any screening or imaging a large number of C. elegans.
Quantitative Screen of target of interest
Using the system developed here, we performed the screening to identify genetic factors that regulate tph-1 expression to understand environmental responsive physiologies or serotonin-deficient diseases. Currently it is known that stress, such as high temperature, stimulates calcium signaling pathway including CaMKII encoded by unc-43, in ADFL/R and up-regulates tph-1 expression level (Fig. 2).27–28 To look for additional genetic players in the unc-43-dependent tph-1 regulation pathway, we performed a forward genetic screen with mutagenized worms having unc-43(gf) background. Double mutants showing different phenotype from unc-43(gf), i.e., low expression of tph-1, were sorted for further analysis. In other words, screening target has similar Ptph-1::gfp expression phenotype as wild-type.
Fig. 2.

Simplified mechanism for CaMKII-dependent regulation of tph-1 in ADF neurons.
There are several challenges in performing this screen. First, we need to use quantitative analysis to define the expression level of tph-1 to reduce the false-positive rate and post-processing such as re-imaging the selected putative mutants as population. Previously some genetic screens for tph-1 regulatory factors in ADFL/R were performed using a dissecting microscope based on its relative intensity.27, 29 From these previous screens, several genetic regulators were identified. However, generally, qualitative screens are low throughput because identifying subtle differences of tph-1 expression in each worm is difficult and it introduces significant false positive rates. For example, by comparing Fig. 3b/c to Fig. 3d/e, it is easy to distinguish between strong and weak tph-1 expressions. Also, it may be possible to compare the relative expression levels of tph-1 among worms having low expressions in Fig. 3b or 3c. However, from a single image (as during a screen in real time), it is not reliable to define a target whose expression level is lower than the threshold of difference. Thus, we can conclude that quantitative imaging is necessary and effective to find genetic regulators of tph-1.
Fig. 3.

Stochasticity in gene expressions in a genetically identical population. (a) Probability histogram of tph-1 expression levels in single mutant (unc-43). The n value represents number of worms imaged. (b–e) Representative images of tph-1 expressions in ADF neurons in unc-43(gf), which correlate with each quantified bar in histogram (a). All fluorescent images are revised as a heat map for clarity. The color bar on the left represents the average intensity of target neurons, ADFL/R, which correlates with the expression levels of tph-1.
We quantified the GFP intensity levels using MATLAB®. From maximum-projection images, we selected the region of interest and the software automatically calculated the average intensity of target neurons. This quantitative analysis is fast and simple to use, and can be easily translated to analyze any other neuron intensities.
The second, but toughest, challenge of this screening is the stochastic effects on gene expression levels. To define the screening criterion for target selection, we imaged wild-type and unc-43(gf) worms having Ptph-1::gfp cultured at 20°C. As seen in the histogram in Fig. 4a, the average expression of tph-1 is lower in wild-type and higher in unc-43(gf); however, because the histograms overlap significantly, it is virtually impossible to pinpoint the genetic identity of individual worms and to have a threshold criterion to distinguish the two genotypes (Fig. 4a, and supplemental materials). Any pre-determined threshold to sort targets would result in an appreciable false positive rate (see supplemental figures and table). Practically, we needed to set a relatively low intensity value as a screening threshold instead of performing control experiment to compare wild-type and unc-43(gf).
Fig. 4.

Challenges in screening of unc-43-dependent regulation on tph-1. (a) Probability histogram of tph-1 expression levels in between wild-type and single mutant (unc-43). (b) Empirical cumulative distribution functions of tph-1 expression for a different set of worms, which illustrate day-to-day variations. The n value represents number of worms imaged.
Furthermore, the putative mutant animals that we selected during the screen might have a fluorescent intensity that is above or below the average for the genotype, i.e. they may not represent the population average. Therefore it is very likely that half of the animals isolated are actually false positives even if we follow a stringent selection criterion (see supplemental figures and table). Thus, after the first round of screen, we need to re-image the selected putative mutants as populations and confirm the population average is indeed below the unc-43(gf) expression. This re-screen is very time consuming since populations would have to be reimaged; to minimize the workload, it is critical to minimize the false positive rate.
Lastly, we need to compensate for the day-to-day variation. First, noises from equipment could interfere with accurate measurement of target GFP intensity. These external noises can be tuned by control bead measurement but additional preparation steps and measurement are required. Furthermore, the gene expression itself may be variable due to certain environmental fluctuations such as culture temperature and bacterial food conditions. Moreover, the worm age affects the expression level of the target gene and age synchronization is often not perfect. For instance, two wild-type cultures at the same conditions for the same period time show large difference in tph-1 expression, despite negligible external equipment noises, which has been confirmed with control bead measurement (Fig. 4b). In the case of unc-43(gf), two cumulative distribution functions are similar but not identical, which is enough to affect the screening performance because mutant selection is very sensitive to the intensity. Thus, to look for mutants with subtle quantitative changes, a simple threshold of GFP intensity is insufficient to generate an acceptable small number of false positives.
Screening with adaptive algorithm
Since a simple threshold based on GFP intensity is not sufficient to select putative mutants due to fluctuations in gene expressions or instrumental noise, we used an adaptive algorithm for sorting mutants. In the adaptive algorithm, the screening threshold was defined and updated by values of mutagenized worms themselves, not by the comparison of wild-type and unc-43(gf) (Fig. 5 and 6). This selection based on rolling minimum intensities is advantageous because no positive or negative controls are required before the start of the screen, and therefore insensitive to the many variations discussed before.
Fig. 5.

Schematics of adaptive screening algorithm for a single worm. Quantitative analysis is only applied to worms having dim TPH-1::GFP. The screening threshold is heuristically updated by every 50 images and possible double mutant is sorted based on threshold.
Fig. 6.
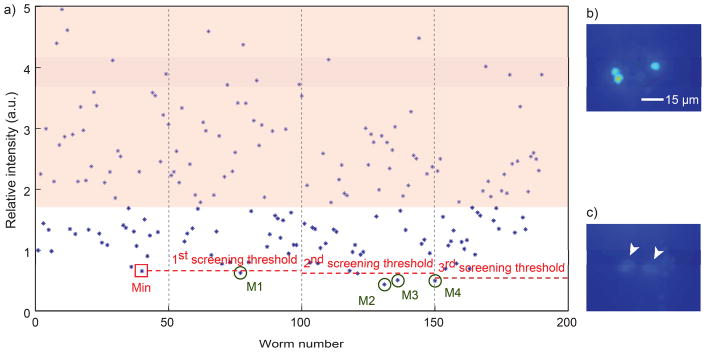
Quantitative screening with the adaptive algorithm. (a) The scattered plot showing tph-1 expression levels in mutagenized unc-43 worms. Each circle represents single worm intensity (average of two ADF neurons). Worms in shaded regions are bright enough to be identified by eyes due to high expression level of tph-1, which is above a certain threshold, and thus, it does not require to be quantified during actual screening. An example of high (b) and low (c) tph-1 expression in ADF neurons. Mutant (M) selection in quantitative screening with flexible thresholds which are updated after every 50 worms. The first screening criterion is set based on minimum value (Min) of first 50 images.
In the adaptive algorithm, first, we imaged fifty mutagenized unc-43(gf) worms, and the minimum value of target reporter expression in this group was set as a screening criterion. Putative mutant worms having lower expression level compared to the sorting threshold were isolated. The sorting criterion was updated after each 50 additional worms passed through and were imaged. We assume that the rate of finding relevant mutant is low (i.e. lowest ~2% of worms). After hundreds of mutants, the screening criterion usually settles to a stable value and does not require more adaptations. This algorithm is easy to implement by modifying target selection rate depending on the expected hit rate with minimized efforts for verifying selected targets.
Using the algorithm and the single-layer microfluidic device, we performed quantitative screening of a mutagenized unc-43 population (Fig. 6). When the intensity of TPH-1::GFP in ADF neurons is higher than a certain threshold, we can easily eliminate the worms having high expression of tph-1 without quantification (Fig. 6b). Thus, there was no need to analyze the high expressing worms, i.e. those in the shaded region in Fig. 6a during actual screening. This rough estimate eliminates many worms quickly, and increases the overall throughput of screening. If the initial evaluation of the intensity is low, as shown in Fig. 6c, we quantified their expression levels and followed the adaptive algorithm to isolate the putative double mutants (Fig. 6a). For example, 0.66 (AU) was set to the first screening threshold and one worm with an intensity value of 0.63 was sorted. Subsequently, the threshold was updated as 0.64 and three worms whose intensities are 0.44, 0.51, and 0.50 were sorted. After hundreds of mutants, usually, the screening threshold stabilized to a value between 0.5 and 0.7 and does not require more adaptations. In total, we screened ~4000 mutagenized F2 unc-43(gf) worms and selected 95 putative mutants. Moreover, the usage of high-throughput microfluidic system enabled this screening within 25 hr, which would have taken longer time (many days or possibly months) with manual conventional methods because of the quantitative requirement of this screen.
After screening, we clonally cultured all sorted putative F2 double mutants and re-imaged their progeny to eliminate false-positive strains. We compared the intensities of putative double mutants to those of unc-43(gf) and eventually verified that 43 of the sorted populations have lowered tph-1 expression than unc-43(gf) when cultured at 20 °C (Fig. 7). These differences are all significant by student’s t test and K-S test (p<0.01). Among the 43 isolates, two (a156 and a157) have no tph-1 expression. We further characterized the rest of the strains and compared with wild-type: 19% of them showed expression levels similar to wild-type at 20 °C and some showed higher and the others showed lower average expression than wild-type.
Fig. 7.
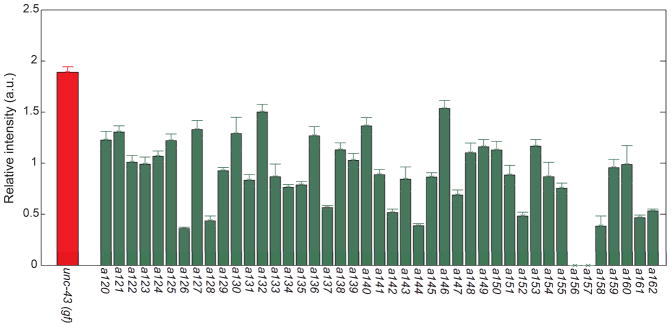
The average expression levels of tph-1 in all progenies from isolated putative mutants were compared to unc-43(gf). Statistically all mutants showed significant differences from unc-43(gf) (p≪0.01).
Interestingly, 14 of the mutants have temperature-dependent expression in ADF L/R, similar to wild-type (Fig. 8a). Theses temperature-dependent changes in the expression levels are all statistically significant by student’s t test and K-S test. It is likely that the genetic lesions in these mutants do not disrupt the Ptph-1::gfp reporter itself. Thus these 14 strains could be useful to identify new regulatory genes in tph-1 expression, particularly in the temperature-dependent responses.
Fig. 8.

Characterizations of putative mutants. (a) 13 putative mutants have temperature-dependent changes in tph-1 expression. (b–d) Three types putative double mutants that have temperature-dependent phenotype of tph-1 expression in ADF neurons. Each probability histogram of tph-1 expression levels fits with either Gaussian (b), Gamma (c), or double Gaussian distribution (d).
Furthermore, the actual distributions (histograms) of the expression levels can be informative. For all 14 strains, Poisson distribution is not appropriate to fit the data since the Fano factor (σ2/μ where σ is the variance and μ is the mean) of the reporter expression level is less than one. We considered both Gaussian and gamma distributions to describe the data. Gaussian distribution was used to fit symmetric distributions and gamma the asymmetric ones. In the cases that the data appear to be bimodal, we used double Gaussian distributions. Examples and categorizations of the mutants are shown in Fig. 8b–d. We hypothesize that these phenotypical groupings are possible results from the mutations happening in different specific pathways.
Conclusions
In summary, we present a quantitative screen based on simple adaptive algorithm using a single-layer microfluidic device. The fabrication of microdevice is simple, giving a low failure rate and a robust and reliable performance. Since all control and fluid channels are in the same layer, optimizing space between the channels when designing the system is necessary. Moreover, to make a flexible control wall, proper aspect ratio was considered. In addition to devices, quantitative analysis with adaptive algorithm was validated with performing the screening of mutated unc-43(gf) worms.
Using this system, we successfully performed a forward screen that identified tph-1 regulators in less than 25 hours and isolated 43 putative double mutants. The system developed here is flexible, and thus can be readily integrated with other studies for screening or imaging C. elegans; this system can also be applied to genome-wide RNAi screening and drug screening, to look for genes that alter/regulate tempo-spatial expression patterns of target genes in response of various conditions such as aging, food level, and pathogens.
Supplementary Material
Acknowledgments
The authors acknowledge US National Science Foundation (CBET-0954578) and National Institutes of Health (R01AG035317, R21EB012803, R01GM088333) for funding, Q. Yuqi for reagents and discussions. HL is a DuPont Young Professor and a Sloan Research Fellow. YZ is funded by the Esther A. and Joseph Klingenstein Fund, March of Dimes Foundation, the Alfred P. Sloan Foundation, the John Merck Fund and NIH (R01DC009852).
Notes and references
- 1.Brenner S. Genetics. 1974;77:71–94. doi: 10.1093/genetics/77.1.71. [DOI] [PMC free article] [PubMed] [Google Scholar]
- 2.Fire A, Xu S, Montgomery MK, Kostas SA, Driver SE, Mello CC. Nature. 1998;391:806–11. doi: 10.1038/35888. [DOI] [PubMed] [Google Scholar]
- 3.Sonnichsen B, Koski LB, Walsh A, Marschall P, Neumann B, Brehm M, Alleaume AM, Artelt J, Bettencourt P, Cassin E, Hewitson M, Holz C, Khan M, Lazik S, Martin C, Nitzsche B, Ruer M, Stamford J, Winzi M, Heinkel R, Roder M, Finell J, Hantsch H, Jones SJ, Jones M, Piano F, Gunsalus KC, Oegema K, Gonczy P, Coulson A, Hyman AA, Echeverri CJ. Nature. 2005;434:462–9. doi: 10.1038/nature03353. [DOI] [PubMed] [Google Scholar]
- 4.Sieburth D, Ch’ng Q, Dybbs M, Tavazoie M, Kennedy S, Wang D, Dupuy D, Rual JF, Hill DE, Vidal M, Ruvkun G, Kaplan JM. Nature. 2005;436:510–7. doi: 10.1038/nature03809. [DOI] [PubMed] [Google Scholar]
- 5.Budovskaya YV, Wu K, Southworth LK, Jiang M, Tedesco P, Johnson TE, Kim SK. Cell. 2008;134:291–303. doi: 10.1016/j.cell.2008.05.044. [DOI] [PMC free article] [PubMed] [Google Scholar]
- 6.Jorgensen EM, Mango SE. Nat Rev Genet. 2002;3:356–69. doi: 10.1038/nrg794. [DOI] [PubMed] [Google Scholar]
- 7.Dupuy D, Bertin N, Hidalgo CA, Venkatesan K, Tu D, Lee D, Rosenberg J, Svrzikapa N, Blanc A, Carnec A, Carvunis AR, Pulak R, Shingles J, Reece-Hoyes J, Hunt-Newbury R, Viveiros R, Mohler WA, Tasan M, Roth FP, Le Peuch C, Hope IA, Johnsen R, Moerman DG, Barabasi AL, Baillie D, Vidal M. Nat Biotechnol. 2007;25:663–8. doi: 10.1038/nbt1305. [DOI] [PubMed] [Google Scholar]
- 8.Mango SE. Nat Biotechnol. 2007;25:645–6. doi: 10.1038/nbt0607-645. [DOI] [PubMed] [Google Scholar]
- 9.Doitsidou M, Flames N, Lee AC, Boyanov A, Hobert O. Nat Methods. 2008;5:869–72. doi: 10.1038/nmeth.1250. [DOI] [PMC free article] [PubMed] [Google Scholar]
- 10.Chung K, Crane MM, Lu H. Nat Methods. 2008;5:637–43. doi: 10.1038/nmeth.1227. [DOI] [PubMed] [Google Scholar]
- 11.Crane MM, Chung K, Lu H. Lab Chip. 2009;9:38–40. doi: 10.1039/b813730g. [DOI] [PubMed] [Google Scholar]
- 12.Stirman JN, Brauner M, Gottschalk A, Lu H. J Neurosci Methods. 2010;191:90–3. doi: 10.1016/j.jneumeth.2010.05.019. [DOI] [PMC free article] [PubMed] [Google Scholar]
- 13.Chronis N, Zimmer M, Bargmann CI. Nat Methods. 2007;4:727–31. doi: 10.1038/nmeth1075. [DOI] [PubMed] [Google Scholar]
- 14.Hulme SE, Shevkoplyas SS, Apfeld J, Fontana W, Whitesides GM. Lab Chip. 2007;7:1515–23. doi: 10.1039/b707861g. [DOI] [PubMed] [Google Scholar]
- 15.Chokshi TV, Bazopoulou D, Chronis N. Lab Chip. 2010;10:2758–63. doi: 10.1039/c004658b. [DOI] [PubMed] [Google Scholar]
- 16.Chung K, Lu H. Lab Chip. 2009;9:2764–6. doi: 10.1039/b910703g. [DOI] [PubMed] [Google Scholar]
- 17.Guo SX, Bourgeois F, Chokshi T, Durr NJ, Hilliard MA, Chronis N, Ben-Yakar A. Nat Methods. 2008;5:531–3. doi: 10.1038/nmeth.1203. [DOI] [PMC free article] [PubMed] [Google Scholar]
- 18.Zeng F, Rohde CB, Yanik MF. Lab Chip. 2008;8:653–6. doi: 10.1039/b804808h. [DOI] [PubMed] [Google Scholar]
- 19.Hulme SE, Shevkoplyas SS, McGuigan AP, Apfeld J, Fontana W, Whitesides GM. Lab Chip. 2010;10:589–97. doi: 10.1039/b919265d. [DOI] [PMC free article] [PubMed] [Google Scholar]
- 20.Chung K, Zhan M, Srinivasan J, Sternberg PW, Gong E, Schroeder FC, Lu H. Lab Chip. 2011;11:3689–97. doi: 10.1039/c1lc20400a. [DOI] [PMC free article] [PubMed] [Google Scholar]
- 21.Weibel DB, Kruithof M, Potenta S, Sia SK, Lee A, Whitesides GM. Anal Chem. 2005;77:4726–33. doi: 10.1021/ac048303p. [DOI] [PubMed] [Google Scholar]
- 22.Hulme SE, Shevkoplyas SS, Whitesides GM. Lab Chip. 2009;9:79–86. doi: 10.1039/b809673b. [DOI] [PMC free article] [PubMed] [Google Scholar]
- 23.Sze JY, Victor M, Loer C, Shi Y, Ruvkun G. Nature. 2000;403:560–4. doi: 10.1038/35000609. [DOI] [PubMed] [Google Scholar]
- 24.Lucki I. Biol Psychiatry. 1998;44:151–62. doi: 10.1016/s0006-3223(98)00139-5. [DOI] [PubMed] [Google Scholar]
- 25.Davidson RJ, Putnam KM, Larson CL. Science. 2000;289:591–4. doi: 10.1126/science.289.5479.591. [DOI] [PubMed] [Google Scholar]
- 26.Ferrari MD, Odink J, Tapparelli C, Van Kempen GM, Pennings EJ, Bruyn GW. Neurology. 1989;39:1239–42. doi: 10.1212/wnl.39.9.1239. [DOI] [PubMed] [Google Scholar]
- 27.Estevez M, Estevez AO, Cowie RH, Gardner KL. J Neurochem. 2004;88:102–13. doi: 10.1046/j.1471-4159.2003.02140.x. [DOI] [PubMed] [Google Scholar]
- 28.Zhang Y, Lu H, Bargmann CI. Nature. 2005;438:179–84. doi: 10.1038/nature04216. [DOI] [PubMed] [Google Scholar]
- 29.Estevez AO, Cowie RH, Gardner KL, Estevez M. Dev Biol. 2006;298:32–44. doi: 10.1016/j.ydbio.2006.06.005. [DOI] [PubMed] [Google Scholar]
- 30.Zhang S, Sokolchik I, Blanco G, Sze JY. Development. 2004;131:1629–38. doi: 10.1242/dev.01047. [DOI] [PubMed] [Google Scholar]
- 31.Duffy DC, McDonald JC, Schueller OJ, Whitesides GM. Anal Chem. 1998;70:4974–84. doi: 10.1021/ac980656z. [DOI] [PubMed] [Google Scholar]
- 32.Unger MA, Chou HP, Thorsen T, Scherer A, Quake SR. Science. 2000;288:113–6. doi: 10.1126/science.288.5463.113. [DOI] [PubMed] [Google Scholar]
- 33.Thorsen T, Maerkl SJ, Quake SR. Science. 2002;298:580–4. doi: 10.1126/science.1076996. [DOI] [PubMed] [Google Scholar]
Associated Data
This section collects any data citations, data availability statements, or supplementary materials included in this article.