

Abstract
We determine the time- and force-dependent viscoelastic responses of reconstituted networks of microtubules that have been strongly crosslinked by biotin-streptavidin bonds. To measure the microscale viscoelasticity of such networks, we use a magnetic tweezers device to apply localized forces. At short time scales, the networks respond nonlinearly to applied force, with stiffening at small forces, followed by a reduction in the stiffening response at high forces, which we attribute to the force-induced unbinding of crosslinks. At long time scales, force-induced bond unbinding leads to local network rearrangement and significant bead creep. Interestingly, the network retains its elastic modulus even under conditions of significant plastic flow, suggesting that crosslinker breakage is balanced by the formation of new bonds. To better understand this effect, we developed a finite element model of such a stiff filament network with labile crosslinkers obeying force-dependent Bell model unbinding dynamics. The coexistence of dissipation, due to bond breakage, and the elastic recovery of the network is possible because each filament has many crosslinkers. Recovery can occur as long as a sufficient number of the original crosslinkers are preserved under the loading period. When these remaining original crosslinkers are broken, plastic flow results.
Introduction
Reconstituted cytoskeletal networks are important model systems for exploring the basic physical principles underlying the static and dynamic features of living cells1–3. These entangled and crosslinked semiflexible polymer networks exhibit a rich set of mechanical properties that have been studied extensively because they provide both a testing ground for fundamental polymer physics and a minimal model of cell mechanics4–7. Most of this previous work explored stable F-actin networks. However, the cytoskeletal networks of living cells are being continuously remodelled by a large variety of binding proteins that generate forces, crosslink or bundle filaments, and regulate polymer assembly. Collectively these processes change the cell’s architecture, internal stress state, and mechanics in response to internal and external cues. To capture these more complex aspects of the behaviour of cytoskeletal networks, there have been increasing theoretical and experimental investigations of composite networks, composed of filaments and one or more crosslinking or motor proteins1, 2, 8–14. These networks have captured aspects of cellular behaviour, most notably gel contraction, but important questions remain about the molecular origins of stress transmission and dissipation, and how local structural features influence the microscale mechanical response.
In comparison to the extensive studies of F-actin solutions and crosslinked F-actin networks, few efforts have explored mechanics of networks of microtubules (MTs), cytoskeletal polymers that are essential for cell division, motility and intracellular transport 15, 16. Mechanical measurements of isolated MTs have shown them to be the stiffest biopolymer filament. Due to the large outer diameter (~25 nm) of these long hollow cylinders, they have a persistence length of ~1000 μm, orders of magnitude greater than that of F-actin, and significantly longer than their average contour length of ~10 μm17, 18. Because of this, MT networks lack the entropic contributions of elasticity that dominate the mechanical response of most polymer gels (including F-actin), and are ideal model systems for the study of athermal, rigid rod polymeric materials. Moreover, because the persistence length is much longer than the entanglement length, forces applied to one point can propagate undisturbed over distances much larger than a mesh size in an MT network.
In this article, we explore the structural and mechanical properties of reconstituted networks of MTs that have been strongly crosslinked by biotin-streptavidin bonds. We find that crosslinking leads to heterogeneity and nonlinearity, intrinsic features of in vivo cytoskeletal networks. To measure the microscale viscoelasticity of such networks, we use a magnetic tweezers device to apply localized forces ranging from 1–151 pN to ~5 μm embedded beads. At short time scales, we find that the crosslinked networks respond nonlinearly to applied force, with stiffening at small forces and a reduction in the stiffening response at high forces, which we attribute to the force-induced unbinding of crosslinks. This reduction can be thought of as a softening transition above a maximal stiffness value, although the measured stiffness in the “softened” regime is usually stiffer than the value we measure at the lowest forces. At long time scales, force-induced bond unbinding leads to local network rearrangement and significant bead creep. To better understand this effect, we developed a finite element model of such a stiff filament network with labile crosslinkers obeying force-dependent Bell model unbinding dynamics 19. Using these simulations, we are able to better understand the role of crosslinker unbinding and rebinding as the principle source of energy dissipation at long time scales and account for the experimentally observed plastic deformation of the MT networks. In addition to providing new insight into the microscale rheology of crosslinked rigid rod networks, these results will have important implications for understanding the mechanical properties of the cytoskeleton, in which networks of MTs and F-actin bundles are locally deformed by transport of intracellular cargos and by the large-scale structural changes in cell division, motility and morphogenesis. It is interesting to note that at these long time scales and for these essentially athermal crosslinked networks, the standard mechanisms for energy dissipation (e.g. hydrodynamics and filament contour fluctuations) play subdominant roles. The dissipative and plastic response of the network to applied loads is more akin to crack propagation in a solid than it is to standard polymer rheology 20.
Results
Microstructures of highly crosslinked MT networks
We have developed a robust protocol to assemble small volumes (~5 μL) of crosslinked MT networks in glass capillary tubes amenable to both confocal fluorescence imaging and manipulation by magnetic tweezers. Crosslinked MT networks with 25 μM of total tubulin proteins are assembled. The degree of crosslinking is controlled by varying the molar percentage of biotinylated tubulin relative to total tubulin, R, to be 12.5%, 25% and 50%, while maintaining the molar ratio of streptavidin to biotin to be 1:2. A representative structure of a crosslinked MT network is shown in Fig. 1a. We have previously used this assembly protocol to generate entangled MT networks, which form homogeneous and isotropic gels. By contrast, the crosslinked MT networks are highly heterogeneous, with the formation of tubulin-rich and tubulin-poor regions throughout the sample. At R = 12.5%, we find a loose, fibrous network of interconnected domains (Fig. S1). For more crosslinked networks, it is possible to threshold the images in order to identify tubulin-poor regions, which appear as dark ‘voids’ within the network. At R = 12.5%, it is difficult to determine the void areal fraction with certainty, since thresholding is particularly challenging in highly interconnected networks, but from visual inspection, we estimate the void areal fraction is < 30%. At R = 25% and 50%, the network is more compact, with clearer boundaries between tubulin-rich and tubulin-poor regions; the void areal fraction is ~60%. The observed changes in network structure and mechanics over this range of crosslinker concentration are in reasonable quantitative agreement with the simple assumption that biotinylated tubulin is randomly incorporated into the polymerizing MTs. We examine this point in more detail in Appendix A in the Supplemental Materials.
Fig. 1.
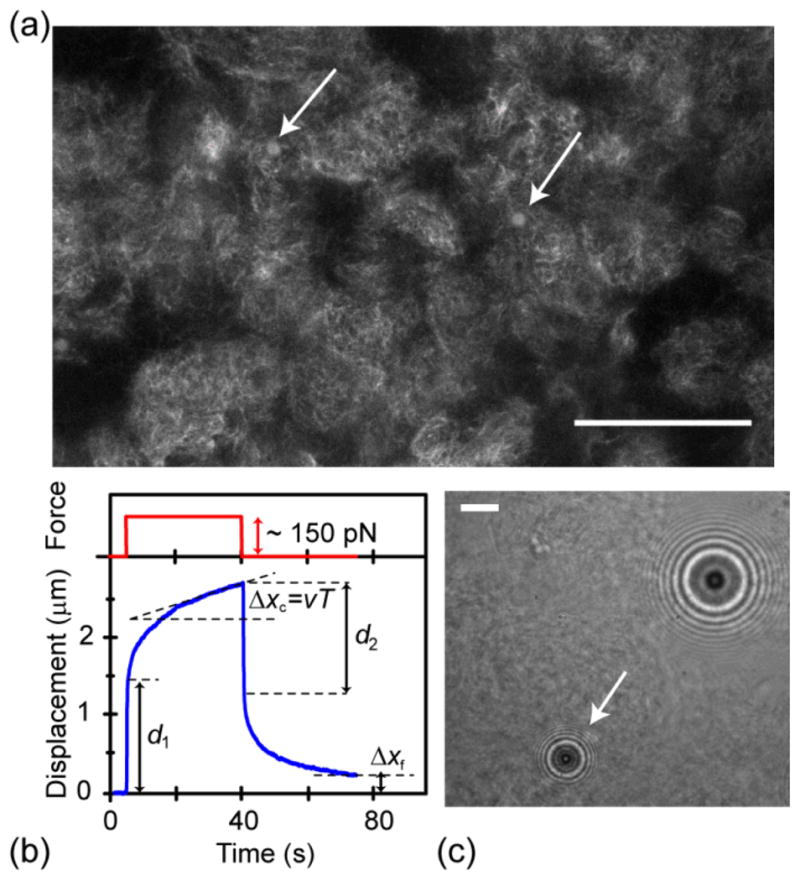
(a) Representative confocal fluorescence microscopy image of a crosslinked MT network in which magnetic beads are embedded (R=25% 25 μM tubulin). Magnetic beads (arrows) are mostly found in areas with dense structures. Scale bar is 50 μm. (b) Typical creep response curve, showing the displacement of magnetic bead (blue) and the force pulse (red) as a function of time. (c) Brightfield microscopy image of the magnetic bead (white arrow), which is embedded in a crosslinked MT network, showing the characteristic diffraction pattern used for 3-d tracking of bead position. The tracked bead is trapped in a denser (darker) area of the heterogeneous structure. The larger bead in the upper right corner is a reference bead, which is attached to the coverslip and allows subtraction of mechanical drift. Scale bar is 10 μm.
The heterogeneity is not caused by the presence of the magnetic beads or by rotation of the samples during polymerization (data not shown). We believe the heterogeneous structures are inherent, resulting from the strong streptavidin-biotin interactions that prevent the formation of thermodynamically-stable MT network structures 21. It is common for densely crosslinked structures to show microphase separation into bundles and clusters 22–24. We report local microscale mechanical properties corresponding to areas with dense structures only.
The formation of the heterogeneous structures is further investigated by time-lapsed confocal fluorescence imaging (Fig. S2, Supplementary Movie 1). For our mechanical tests, tubulin polymerization is triggered by the rapid increase in sample temperature from ice-cold to ~35°C. For this imaging experiment, we use a temperature-controlled environmental chamber to maintain the sample at a fixed temperature during observation. We define the start of assembly as when the sealed capillary tube containing the ice-cold tubulin mixture is placed into the microscope chamber. We assume that the equilibration to the set temperature is immediate due to the small (~5 μL) volume. When the chambers are set to 35°C, most structures have formed at the time when the recording starts, ~2 min after assembly starts.
In order to visualize structures formed at earlier stages of polymerization, the formation of the crosslinked MT network is observed at a lower temperature of 30°C, which should result in similar network structures but with slower assembly kinetics. At 30°C, thin and short MT filaments have already formed at the shortest time point of ~2 minutes. These are not isolated, but instead are loosely connected with each other, as indicated by the slow flow at large length scales shown in the Supplementary Movie 1. This also indicates that even at this short time point, the nucleation stage of the assembly process is mostly complete. A significant amount of free tubulin and tubulin aggregates are also present as indicated by the bright background fluorescence signal.
Over time, the fluorescence signal from the free tubulin and number of diffusing tubulin aggregates decreases as these structures are added to existing nucleation centres to make longer and thicker MT filaments. As the MT filaments grow, they become more connected throughout the sample by merging together or forming new connections, and after ~4–5 min the large scale flow stops. Our observation is consistent with previous studies on kinetically trapped actin/α-actinin and actin/filamin networks. In these cases, the self-assembly is accompanied by continuous, highly dynamic reorganization of previously-formed structures, resulting from an aggregation-controlled growth process out of thermal equilibrium 22–24.
Microrheology of crosslinked MT networks probed by magnetic tweezers
To determine the microscale mechanical properties of crosslinked MT networks, small magnetic beads of 4.5–μm diameter are embedded in the gels. Calibrated step forces ranging from 2.5 pN to 151 pN are applied to the beads, and the resultant strain responses are measured as a function of time and force. A typical creep response curve is shown in Fig. 1b. A force pulse is turned on by rapid motion of a NdFeB-based permanent magnet towards the sample. The bead jumps instantaneously by a distance d1 indicating an elastic response at short times. After several seconds, the bead displacement increases slowly and linearly indicating a long time creep regime characterized by an averaged velocity v. The force is maintained for a total time T of ~30–40 seconds, then turned off by sudden retraction of the magnet array away from the sample. The bead jumps back instantaneously by a distance d2, and finally returns to a position given by Δxf.
The bead size is much larger than the mesh size to ensure full engagement of the particle with the network under force. Thus, we do not believe that the residual displacement Δxf can be understood in terms of the bead shifting its position relative to a static network. Rather, we interpret Δxf as a measure of the plastic deformation of the network due to the reorganization of crosslinks and entanglement points under the applied load. Due to structural heterogeneity, the viscoelasticity measured is expected to vary somewhat with the local environment of tracked beads. As seen in Fig. 1a, beads tend to locate in the tubulin-rich regions or in the border areas between the tubulin-rich and tubulin poor regions after self-assemblies of the networks. The tubulin-rich regions are dense enough to be identified by brightfield microscopy (Fig. 1c, Fig. S1). For all mechanical measurements, we select beads surrounded by dense MT structures.
The effect of loading history is investigated by ramping the force up and then back down. We find no obvious hysteresis on measured mechanical properties after repeated loading. The displacement versus time plot demonstrates the reversible response at the same force (Fig. S3). To improve efficiency of data collection, in most cases, the measurements are performed by ramping up the force only.
Nonlinear elasticity in densely crosslinked networks
We choose to parameterize the elasticity of the crosslinked network by the network stiffness, which is estimated by the applied force F divided by the instantaneous jump d1 (Fig. 2). This choice distinguishes the microscale elastic response, which might depend on the geometry of the network-probe interface, from the scale-invariant continuum elastic modulus 16. As expected, we find that the overall stiffness at a particular force increases as the crosslinker concentration increases. Interestingly, the force-response is highly non-linear. The stiffness increases with force at small forces and then decreases with force at large forces for all crosslinker concentrations. We note that the estimated errors of the measured stiffnesses within the stiffening regions are large, mainly due to very small displacements of beads induced by small forces. In particular, values of F/d1 shown in open symbols are averaged from fewer data points, since a sizeable number of measurements (~50%) do not show any measureable bead displacement upon application of force. To further confirm the transition of stress stiffening to stress softening during the force range studied, a different method to determine the instantaneous jump distances d1 and d2 is used, and consistent results are obtained (see methods; data not shown). Despite the difficulties of measuring bead displacements at small forces, all resolved displacements obtained at all crosslinker concentrations show the same general trend: stiffening at small forces and softening at large forces.
Fig. 2.
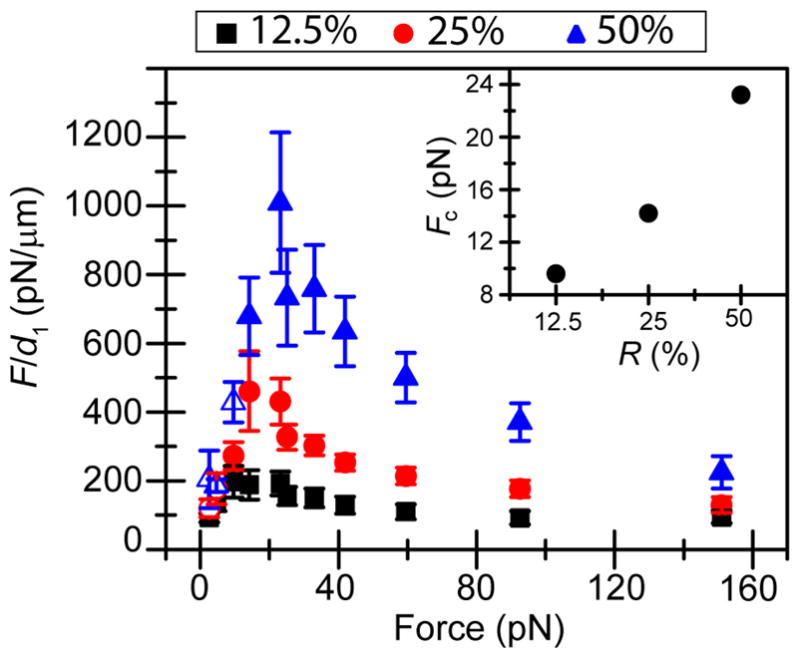
The stiffness of crosslinked MT networks is determined by dividing the applied force F by the initial elastic jump distance d1. We find stiffening at low forces and softening at high forces for all crosslinking concentrations. In some cases, at the smallest forces, the bead displacement is too small to resolve, and therefore only a subset of traces can be used to measure stiffness. Data points that are averaged from fewer than 50% of the traces used at large forces are represented by open symbols. Inset: the crossover force Fc from the stiffening to softening regimes increases with crosslinking density.
Stress-induced stiffening is frequently observed in biopolymers, such as actin and DNA, and is often attributed to the crossover from entropic to enthalpic elasticity, in which the end-to-end filament length is increased until it approaches the contour length, at which point the filament backbone becomes tensed 25–27. Because both the MTs and the crosslinks are rigid –i.e., dominated by enthalpic elasticity– the stiffening we observe must have a different origin. We suspect that the observed stiffening arises from filament alignment in the direction of force and a nonlinear increase in the number of engaged MT filaments with force, as the strain field propagates further into the network 3, 16, 28–32. We attribute the softening observed at large forces to the force-induced unbinding of individual streptavidin-biotin crosslinks. Before discussing the evidence for this interpretation, we note that while unbinding events are time-dependent and cannot strictly be considered part of the “instantaneous” response, experimental application of the mechanical load occurs on a finite time scale (on the order of 100 ms) which may be slower than that of unbinding. Thus some amount of unbinding may occur during the “ramping” of the load, contributing to the position jump of the bead upon force application. Furthermore, since the instantaneous response is observed to be reversible, the degree of crosslinker unbinding must be sufficient to allow the bead to move farther through the network, but not so extensive as to generate an appreciable plastic deformation. In other words, softening as measured by F/d1 occurs but the bead still returns to its initial position when the force is removed. We discuss this interpretation further after we review the numerical simulations; there, bond breaking can be directly studied.
In the crossover from stiffening to softening behaviour, the stiffness reaches a maximum value. The force at which this maximum occurs, which we call Fc, depends on the crosslinker concentration such that larger forces are required for more crosslinked networks (Fig. 2 inset). This is consistent with a softening transition driven by force-induced crosslinker unbinding, since in stiffer networks larger forces are required to break a sufficient number of bonds to allow bead motion through the meshwork. When stiffness is plotted versus force, the observed transition from stiffening to softening behaviour is fairly gentle. In fact a small, nearly linear regime can be observed around the crossover force for networks with R = 12.5% and 25%. When the force is removed, the bead abruptly returns to its initial position, with an elastic jump back distance given by d2 ≈ d1 for all forces and crosslinker concentrations (Fig. S4).
Long time creeping flow arises from force-induced bond breakage
After the initial elastic regime, there is a transition on a time scale of 5–10 seconds to a regime in which bead displacement increases linearly with time, indicating the onset of a creeping flow behaviour, which we characterize by the creep velocity v9, 16, 24, 33. The observed velocity increases with force and decreases with crosslinker concentration (Fig. 3). Interestingly, the creep velocity only becomes significantly larger than zero when the applied force exceeds Fc, the force at which we observe the onset of stress softening at short times, suggesting a common molecular mechanism (Fig. S5).
Fig. 3.

The natural logarithm of velocity is plotted as a function of force. At forces above Fc, the creep velocity v increases with force and decreases with R. According to the Bell model, ln(v) ~ F, and the slope gives an estimate of xβ, distance from the transition state to the bound state. We find xβ = 0.25 ± 0.06 nm when F ≤ 60 pN, and is ~0.05 nm when F >85 pN. Inset: The force-dependence is similar at each R, so to determine the effects of R on v, we divide the velocity at each force point by the velocity measured at R = 25%. This force-averaged velocity ratio decreases with increasing R. The experimental data are compared to that inferred from the simulation of the strain rate as a function of applied shear stress (green asterisks). To enable comparison, we rescaled the x-axis by 0.8 so that the data and simulation agreed at the lowest loading. The agreement over all loadings shows that the Bell model crosslinker unbinding in a filament network is sufficient to explain the experimentally observed dynamics.
To investigate the molecular origins of network softening and creep, we examine the force-dependence of v for F > Fc. In a simple scenario where force-induced bond breakage leads to bead displacement, we use the Bell model to estimate the bond dissociation rate , where is the dissociation rate in the absence of applied force, xβ is the distance between the bound and the transition state projected along the direction of applied force, and kBT is the thermal energy 19. Assuming that velocity scales proportionally with koff(F), this predicts that the creep velocity should increase exponentially with applied force. As shown in Fig. 3, our data shows good agreement with this model. When the natural log of velocity is plotted versus force, we find a linear relationship for Fc < F < ~60 pN, with similar slopes for different crosslinker concentrations. This is somewhat surprising. While the characteristic force scale in the Bell unbinding rate kBT/xβ is independent of R, one would naively expect the average force on a crosslink to scale inversely with the crosslink density, causing the unbinding rate to increase as the crosslinker concentration decreases. The apparent insensitivity of the average force per crosslinker on R may arise from the nonlinear mechanics of the system: in contrast to the response of linear elastic materials, the spatial extent of the strain field around the loaded bead could depend on the nonlinear modulus of the network.
An apparent slope change when F > ~60 pN may indicate that an outer energy barrier is overcome by force and an inner barrier becomes the decisive impedance to unbinding. From the averaged slopes, we obtain xβ ≈ 0.2 nm when F ≤ 60 pN and xβ ≈ 0.05 nm when F > 85 pN. For the typical macromolecular bond, the energy landscape along the reaction coordinate consists of a sequence of barriers due to numerous attractive interactions 34. For biotin-streptavidin bonds, an outer barrier at xβ ≈ 0.5 nm, and an inner barrier at xβ ≈ 0.12 nm have been identified by dynamic force spectroscopy 34. These transition states are consistent with the locations of major chemical barriers reported by molecular dynamics simulations of biotin-streptavidin rupture, although the barrier positions we determine are smaller than prior estimates by a factor of ~ 2.5 35. At F > Fc, we sometimes observe large discrete jumps of the beads through the network, which we exclude from our analysis of creep velocity. This may lead to a systematic underestimate of the creep velocity, and may result in a smaller xβ. Additionally, the loading scheme for our measurement leads to a distribution of force directions, and to the loading of multiple bonds at various distances from the bead surface. In particular, although forces are applied to the bead with known magnitudes and directions, the forces experienced by nearby crosslinkers will differ due to the geometry of the network connecting the two points. This may also lead to a smaller value of xβ. Interestingly, the absence of R dependence and the rough agreement of values of xβ both suggest that only a few bonds are under load. We take this to mean that the bead contacts the network in such a way as to localize the force.
To determine the effects of crosslinker density on velocity, we divide the velocity at each force point by the velocity measured at R = 25%, and average over all forces. This force-averaged velocity ratio decreases with increasing R (Fig 3 inset).
Bond breakage leads to discrete bead motions
We occasionally observe abrupt motions of the bead after the initial elastic jump (Fig. 4a). To investigate whether these jumps are related to bond breakage events, we developed an algorithm to determine the number and size of the jumps as a function of force and crosslinking density. The algorithm evaluates the pairwise distance difference between subsequent time points, and identifies distance differences greater than three times the standard deviation of the distance distribution as ‘jumps’. Although this automated algorithm identifies almost all obvious jumps in the data, it tends to find false steps from the relatively noisy traces obtained at low force. To avoid such false positives, force values less than ~14 pN are not analyzed.
Fig. 4.
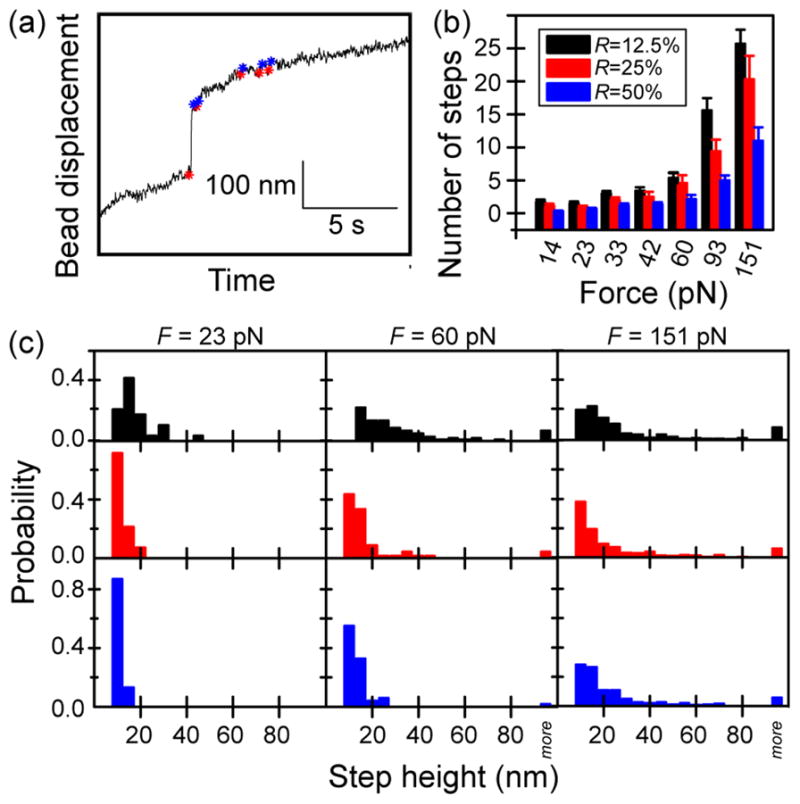
(a) A representative trace showing discrete jumps in bead motion through a crosslinked network with R = 12.5% and F = 25 pN. The start (red star) and the end (blue star) point of found steps are shown on the raw trace. (b) The number of jumps identified by an automated step finding algorithm is plotted for a range of force points. The number of identified steps increases with applied force and decreases with crosslinker concentration. (c) The distribution of step lengths is plotted for three representative forces. At high force, the distributions of step heights are wide and similar for networks of different crosslinker concentrations. At lower forces (23 pN and 60 pN), the distributions are narrower for more crosslinked networks, since small forces can only generate isolated unbinding events leading to small step displacements.
With this method, steps ranging from 5 nm to 1 μm are identified. The average number of identified steps increases with the force and decreases with the crosslinker concentration (Fig. 4b). Interestingly, the force-dependence of the step size distribution also changes with crosslinker concentration (Fig. 4c). For example, at a relatively small force of 23.2 pN, < 10% of steps are larger than 20 nm for networks with R = 25% or 50%. Whereas for networks with R = 12.5%, ~35% of steps are larger than 20 nm. At an intermediate force of 59 pN, < 15% steps are larger than 20 nm for networks of R = 50%, whereas ~ 25% of steps are larger than 20 nm for networks of R = 25%. Only at the highest force of 151 pN can a wide range of step sizes be observed for R = 50%, with > 45% steps measured to be larger than 20 nm.
We further analyze the jump distribution by calculating the distribution P(dx) of pairwise distance differences along the vector of the bead positions x, where dx =x(n+1) − x(n), where n is the frame number (the time between each frame is 1/60 s). To distinguish bead motions due to force-induced bond breakage from those due to normal thermal fluctuations, we calculate the distributions of displacements in the direction of applied force, called P+(dx) as well as the distribution of displacements in the opposite direction, which we call P−(dx). The difference of P+(dx) − P−(dx) gives the distribution of ‘excess’ fluctuations in the direction of applied force, which we attribute to bond breakage events (Fig. 5, and Fig. S6). We find that P+(dx) > P−(dx) for all forces and crosslinker concentrations, and that the number of bond breakage events increases with force and decreases with R. This suggests that bond breakage occurs even when discrete jumps cannot be identified. The distribution of P+(dx) − P−(dx) peaks at a small distance (this peak may arise from the limited resolution of our position detection), then decays roughly exponentially with bead displacement. This decay has a characteristic length of ~5–10 nm, is present at all conditions, and is most clearly seen at the largest forces. The meaning of this decay is not obvious; there are two appropriate length scales in the system. First, the decay length is similar in scale to the effective rupture length of an individual streptavidin-biotin bond (estimated to be ~1 nm36), suggesting that the jump size is indicative of the individual bond ruptures. Second, one can consider how far the bead of radius a might jump forward in the network of mesh size ξ ≈ 0.1a if a bond rupture simply removed one obstacle allowing the bead to move forward a distance sufficient to hit another filament. In that case typical jumps would be of size ξ 2/a ≈ 20 nm, and would depend on the bead’s radius.
Fig. 5.
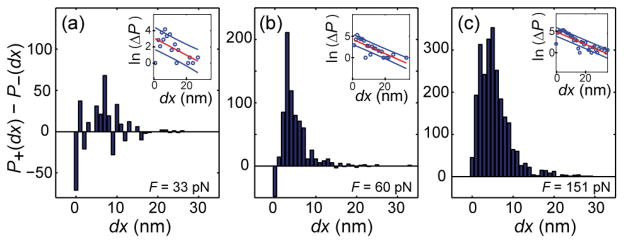
The difference P+(dx) − P−(dx) gives the distribution of ‘excess’ fluctuations in the direction of applied force, which we attribute to bond breakage events. Here, P+(dx) −P− (dx) is plotted for R = 25% and F = (a) 33 pN, (b) 60 pN, and (c) 151 pN. In each panel, the inset shows the natural log of the probability distribution, with a line fit (red) and 1-sigma confidence bounds (blue). In each case, the characteristic decay length is ~ 5–10 nm. Distributions for remaining conditions are shown in Fig. S6.
Recovery and reversibility
To investigate the ability of MT networks to recover after applied force, we compare the total creep distance Δxc = vT to the total distance the bead moves after one force pulse Δxf. For F < Fc, Δxc is small and comparable to the magnitude of the tracking error. Above Fc, both Δxc and Δxf increase with force and decrease with crosslinker concentration (Fig. 6). At small forces, Δxf and Δxc are comparable, whereas at large forces, Δxf is systematically smaller than Δxc. As expected for a bond-breaking based interpretation, the onset force for this enhanced creep increases with increasing R. We do find remarkable reversibility in network elasticity across all forces and crosslinking conditions, despite the nonlinear elastic response. Naively, it is hard to reconcile this elastic recovery with the strong evidence for bond rupture events, which would be expected to lead to plastic flow associated with irreversible changes to the network’s structure (Fig. S3).
Fig. 6.

Comparison of the creep displacement Δxc to the unrecovered displacement Δxf. (a) Both Δxc (open symbols, dashed lines) and Δxf (solid symbols, solid lines) increase monotonically with force and decrease with crosslinker concentration. Inset: Low force data is shown on a log-lin plot to emphasize monotonic increase. (b) For small forces, Δxf ≈ Δxc; at larger forces above Fc, Δxf is systematically smaller than Δxc.
We speculate that this issue can be resolved as follows. Although the bead creeps due to force-induced bond breakage, the system does not fully lose memory of its initial undeformed state because of the rigidity and length of the constituent filaments. Each filament has many (~30) crosslinks to the rest of the network. Under an applied load, some of these bonds can break, the filament can deform, and new crosslinks may even form in this strained state. But, as long as a sufficient number of the older crosslinks remain, the deformed filament retains a memory of its initial position and orientation in the unstrained network. When the load is removed, the new bonds should break, and the filaments, along with the bead, will return to their original position. Note that energy is still dissipated in this scenario – work used to break the original bonds is not recovered.
Results of simulations
To further explore the proposed crosslink unbinding mechanism for stress relaxation, we carry out numerical simulations of network rheology, modelling the MT networks as 2-D meshes of continuum elastic beams, crosslinked at intersection points. Crosslinks are treated as simple elastic springs that can unbind according to Bell’s model, with a probability pi = p0exp(fiδ/kBT), where fi is the force on link i and δ is the transition length-scale. The fundamental time scale in the simulations is set by the zero load unbinding rate of the Bell model crosslinkers. Since we assume that the mechanical relaxation of the network is arbitrarily fast in comparison, this is the only timescale in the problem. Consequently, we report all simulation dynamics in terms of simulation time defined as the reciprocal of this fundamental unbinding rate. The shear response of the simulated networks is plotted in Fig. 7, for a characteristic set of model parameters. The simulations show the same main qualitative features as the experiments: loading produces an instantaneous elastic strain followed by a creep regime in which the strain increases linearly in time; unloading triggers a partial elastic recovery followed by an additional exponential relaxation. The key utility of the simulations is that one has access to all crosslink breakage and formation events under load. In Fig. 7 we test our contention that the nonrecoverable strain, i.e., plastic deformation of the material can be understood in terms of bond breakage. We strained the network for three different lengths of time chosen so that nearly all (98%) of the original crosslinks were preserved (red), about half (54%) were preserved (green), or only a small fraction (18%) of them were preserved (blue). It is clear that the size of the unrecoverable strain in the network increases with the decreasing fraction of original crosslinkers preserved. Moreover the equivalence of the elastic jumps at the time of loading and unloading the system shows that the elasticity of the network is essentially unchanged by the bond breakage and reformation events. Only the original reference state of the elastic material has evolved in time. From these numerical results we propose that the bond breakage mechanism is sufficient to account for the observed data in the experimental system.
Fig. 7.

Numerical simulation of strained filament networks for three different loading times chosen to vary the number of surviving original crosslinkers N0 in the total number of crosslinkers NT. Simulation time is defined in terms of the Bell model crosslinker unbinding rate for unloaded bonds (see text). The loading times were chosen so as to preserve differing fractions of the original crosslinkers. For the shortest loading time (red), 98% of the original crosslinkers were preserved and the residual plastic deformation was unobservable. As the fraction of original crosslinkers decreased (longer force application times) the residual plastic deformation increased. Lower panel: Using the total creep distance and residual plastic deformation, we compute the analogues of the experimentally determined Δxf and Δxc. Their ratio is in good agreement with the experiment (see Fig. 6b).
We directly compare in Fig. 3 our simulation results for the dependence of the creep strain rate on applied shear stress (green asterisks, right ordinate axis) to the experimentally observed creep velocity of the bead (left ordinate) as a function of loading (common abscissa). Since the simulations involve an arbitrarily chosen fundamental time scale, and it is a complex problem in this nonlinear viscoelastic material to relate the local shear strain rate in the network to the bead’s velocity, there is an unknown conversion factor between the simulation and experimental data. Similarly there is a scaling factor between the shear stress and bead’s loading. We have made a single rescaling of the x-axis by 0.8 to make the results match at the lowest loading, and have plotted the strain rate data using the right y-axis. The overall agreement between the simulation and experiment over all loading regimes strongly supports our contention that a simple Bell model of crosslinker unbinding is sufficient to account for all of the observed creep dynamics. In both cases, the creep rate appears to be exponential for moderate loads, and then increases more slowly at higher loads. As discussed above, to eliminate both fitting parameters in our comparison of simulation and experiment one must either understand the solution of the hydrodynamic flow in this highly nonlinear and viscoelastic material, or directly simulate the motion of a bead in a model network, requiring much larger systems that are not currently feasible. In future work, we plan to build on the promising and suggestive correspondence between the bead pulling experiments and the simple shear simulations to develop a hydrodynamic theory of bead motion in the network.
In another point of agreement with the simulations and the experiments, the simulations yield incomplete recovery of networks after shear stress loading (Fig. 7). The permanent plastic deformation retained after unloading and relaxation is in the range of 50–75% of the creep deformation, meaning that about 25–50% of the viscous creep deformation is recoverable.
Discussion
We study densely crosslinked MT networks with fixed tubulin concentration of 25 μM and three crosslinker densities R = 12.5%, 25% and 50%. The crosslinked MT networks are characterized by highly heterogeneous structures containing tubulin-rich and tubulin-poor regions, and are reminiscent of functional cytoskeletal structures. By using time-lapsed confocal imaging, we find that the self-assembly is driven by a diffusion-limited aggregation (DLA) process. We have previously reported structural inhomogeneities for sparsely crosslinked MT networks (molar ratio of streptavidin to biotin is 1:10, R = 14%) although the MT density differences are smaller as the crosslinker density decreases 16. Consistent with DLA, we observe structural insensitivity at larger R. This is in agreement with prior studies of kinetically trapped actin/filamin bundle networks, where both fractal dimension of the clusters and the cluster mass distribution is undistinguishable for large R 22. Heterogeneity likely arises from kinetic trapping during self-assembly, which is intrinsic to the densely crosslinked networks formed by strong and rigid cross-links, such as the streptavidin-biotin bonds studied here, as well as with most flexible crosslinkers. Homogeneous and isotropic crosslinked networks are only expected at very low crosslink densities. Densely crosslinked actin/myosin (HMM) networks are exceptions, and are used as model systems for isotropic network formation 9, 37, 38. In the current study, magnetic beads are usually trapped in areas with dense structures. By applying external forces we are able to study microscale viscoelastic properties corresponding to these microstructures.
We parameterize the short time elastic response by stiffness, which we determine by dividing the applied force by the instantaneous bead displacement upon application of force. We observe nonlinear elastic response, in which the network stiffens at low forces and softens at large forces. A linear regime was observed in our previous study of sparsely crosslinked MT networks for forces up to 33 pN (the highest force investigated in that work due to the relative fragility of the networks)16. In the current study, a small linear region appears around the peak stiffness for small R, which might eventually replace the stiffening region at low forces if the crosslinking density were further reduced. Conventionally, stiffening in biopolymer gels is attributed to the bending (entropic) elasticity of an individual filament, or the flexibility of crosslinks resisting extension 1, 10, 26, 39. Because MT filaments are rigid rods mainly with enthalpic elasticity and the streptavidin-biotin crosslinks are also rigid, we attribute the stress stiffening to either the alignment of filaments in the force direction or piling up of filaments in front of the bead when bead displacement exceeds the distance between effective crosslinks. The argument is supported by previous experiments of entangled and sparsely crosslinked MT networks, in which the deformation of fluorescent MTs in the vicinity of the magnetic bead was observed using confocal microscopy and a portable magnetic tweezers device 16, 32. Unfortunately, the highly crosslinked networks are too stiff to allow measureable bead displacement and too dense to allow visualization of individual filaments using that technique.
The network elasticity is remarkably reversible, despite the non-linear response. This is probed by ramping force up to a maximum value of 151 pN, and then back down to the minimum applied force. At each force point, the network stiffnesses measured during ramp up or ramp down are comparable, for both the stress stiffening and softening regimes. Reversible stress softening was previously observed in dendritic actin networks by dual-cantilevered atomic force microscope, and was explained by reversible Euler buckling of individual filaments under compression 40. The critical buckling force, for filaments with both ends fixed, is given by FB = 4π2κ/L2 where κ is the bending modulus and L is the filament length. For actin filaments of 0.1–1 μm in contour length, FB is estimated to be 0.5–50 pN 40. For individual MT filaments with physiological length (~ 10 μm), buckling is easily induced by small force of order 1 pN 41. However, in crosslinked networks, the effective filament length is given by the mean distance between crosslinks, rather than the total contour length. For the MT networks probed in this study, buckling requires large force on the order of 1–100 nN, well beyond the highest force applied by the magnetic tweezers device. It is therefore unlikely that buckling plays an important role in the rheology of highly crosslinked MT networks.
An alternative mechanism for stress softening is force-induced crosslinker unbinding, which leads to stress softening and bead creep, both of which we observe above a critical force that depends on the crosslinking density 9, 33, 38. Through simulations, we tested a model system of highly crosslinked rigid rod polymers where each crosslinker is treated as an elastic spring with force-induced unbinding kinetics consistent with a Bell-type mechanism and found this model captures the key aspects of the experimental system. Creep velocity increases exponentially with force 19. The elastic energy is dissipated partially through unbinding events and/or re-bindings at different positions as indicated by small unrecovered Δxf. However, Δxf is equal to or smaller than the creep distance Δxc, a feature that is inconsistent with dissipation arising from hydrodynamics or filament contour fluctuations. The lack of dissipative mechanisms is also apparent in the loading history test, in which the elastic response is reversible, even in the stress-softening regime. We propose that the long persistence length of the MTs plays an important role, by driving the network back to its initial configuration, even when individual bonds have been broken at high force.
While our simulations do not reproduce the stress softening at large force observed in experiment, we do observe that bond-breakage proceeds on a very short time scale after load application in simulations– shorter than the time over which force ramping occurs experimentally. This separation of time scales implies that unbinding events may contribute to what appears as the “instantaneous” jump of the bead after loading, thereby softening the response.
The importance of single-filament mechanics and single bond breakage events to network rheology has previously been shown for isotropic actin gels 9, 38. Here, we demonstrate that single filament bending and bond breakage kinetics can dictate gel rheology in structured, heterogeneous gels, suggesting that modulation of filament and crosslinker properties is a robust means of controlling polymer mechanics.
Materials and Methods
Proteins
Unlabeled and rhodamine-labeled tubulin proteins are generously provided by Professor Leslie Wilson at University of California, Santa Barbara. Unlabeled tubulin is purified from bovine brain by cycles of assembly and disassembly and followed by phosphocellulose chromatography 42. Rhodamine-labeled tubulin is prepared by reaction with succinimidyl esters of carboxyrhodamine-6 G (C-6157; Invitrogen). Commercial biotinylated porcine brain tubulin (T333P; Cytoskeleton, Inc.) with ~1:1 labeling ratio of biotin to tubulin heterodimer is reconstituted to 10 mg/ml in G-PEM80 buffer (80 mM PIPES, 4 mM MgCl2, 1 mM EGTA and 1 mM GTP; pH = 6.9). Commercial streptavidin proteins (SA20; Prozyme) are used.
Preparation of crosslinked MT networks embedded with magnetic beads
Small volumes of MTs networks amenable to both confocal fluorescence imaging and manipulation by magnetic tweezer are prepared as previously described 16. Briefly, tubulin mixtures are made by combining the following reagents on ice: unlabeled tubulin, rhodamine-labeled tubulin, biotinylated tubulin, 1 mM GTP, 1 mM DTT, 10% (v/v) DMSO, 12.5 μM taxol, PEM80 (80 mM PIPES, 4 mM MgCl2, 1 mM EGTA; pH = 6.9), and ~106 beads/mL tosyl-activated magnetic beads with diameter of 4.5 μm (Dynabeads, Invitrogen). The total tubulin concentration is 25 μM, and the molar ratio of rhodamine-labeled tubulin to total tubulin is 1:6. The degree of crosslinking is controlled by varying the molar percentage of biotinylated tubulin to total tubulin, R, to be 12.5%, 25%, or 50%. Crosslinking is accomplished by first incubating the MTs mixtures at 35 °C for 3 minutes in a small microcentrifuge tube, then gently mixing in the streptavidin at a molar ratio of 1:2 to biotin-labeled tubulin by pipetting up and down 15 times using a cutoff p20 pipette tip. Samples are then loaded into capillary tubes (0.1 × 1 × 50 mm3; Friedrich & Dimmock, Inc), which are sealed by vacuum grease and incubated at 35 °C for ~1 hour under constant rotation to prevent the magnetic beads from settling, and immediately used. Prior to loading, the capillary tubes are pre-coated with reference beads with diameter of 5.43 μm (PS06N; Bangs Laboratories, Inc) to enable the subtraction of artefactual mechanical or thermal drift, or vibration of the sample and/or the stage from the real motion of the embedded magnetic particles.
Confocal imaging for structure characterization
Confocal microscopy images of crosslinked networks are obtained using an inverted Fluoview 500 laser scanning system (Olympus). Two-dimensional slices of rhodamine-labeled MT networks are imaged using 561 nm laser excitation and a 60× N.A. 1.4 oil-immersion objective, with scan size of 1024 × 1024 pixels2, scan rate of 9.59 seconds/scan, and magnification of 207.16 nm/pixel.
Time-lapsed images of the formation of crosslinked networks are obtained using an upright Fluoview 1000 laser scanning system (Olympus) with an environmental chamber to control the temperature. The formation of crosslinked networks are recorded at 30 °C or 35 °C using 559 nm laser excitation and a 25x, N.A. 1.05 water-immersion objective, with scan size of 1024 × 1024 pixels2, scan rate of 10 μs/pixel, and magnification of 124 nm/pixel. The interval between each frame is 15 or 30 seconds, and the recording time is ~10–20 minutes. Tubulin solutions are prepared within 1 hour of imaging, mixed with strepatvidin at the desired concentration, and kept on ice. The ice-cold solution is loaded into a capillary tube. The waiting time between the placement of the sample tube on the microscope and starting the recording is usually 2–3 minutes. Since the sample volume is small, it is assumed that temperature equilibration is fast, and that the assembly of the network starts immediately upon placing the tube inside the environmental control box.
Magnetic tweezers
A custom-built magnetic tweezers system enables precise manipulation of magnetic beads along the optical axis (the z-axis) and simultaneous three-dimensional tracking of bead position, as previously described16. Separation distances between the sample plane and magnet range from 0.5 mm – 24.5 mm. Forces are calibrated by measuring the Brownian motion of a magnetic bead tethered to the coverslip by a single DNA molecule, and thus acting as a simple inverted pendulum 43. Real-time tracking of the three-dimensional bead position is achieved using custom image analysis routines written in LABVIEW (National Instruments) 44. The intrinsic accuracy of the 3d tracking algorithms for beads immobilized in a low-contrast media (such as water) is ~ 1 nm 44, 45. When embedded in MT gels, additional noise sources are introduced both due to the thermal fluctuations of the bead and the light scattering from the dense MT network, which can degrade the diffraction of the bead, which is used for 3d tracking. For the networks presented here, we estimate our bead tracking accuracy to be <5 nm in all axes.
Analysis on mechanical properties of magnetic tweezers data
Mechanical parameters are measured from data traces as shown schematically in Fig 1. The bead motion under a force pulse is dissected into three distinct regimes, a short-time elastic jump, a relaxation transition, and a long-time creep regime. Creep velocity v is determined from the slope of a linear fit to bead displacement x versus time t for 10 – 20 seconds prior to the retraction of the magnetic force. The force-on (force-off) elasticity is measured by the distance d1 (d2) that the bead travels in the elastic regime due to the introduction (retraction) of the magnet array. The start point of the force-on (force-off) elastic regime is defined by the motion of the magnets toward (away) from the sample. The end point of the elastic regime is defined by the time at which the force settles to the commanded value. This time depends on the distance travelled by the magnet array, and the motor travel speed. For a typically travel distance of 15–24 mm at a speed of 50 mm/s, the settling time is ~300–480 ms. The total time between when the force is turned on and off is T. The total displacement of the bead due to creep is measured as Δxc= vT. The total displacement of the bead after the force pulse is measured as Δxf. All uncertainties are SEM. To check for possible artifacts in the determination of d1 and d2, which can be small for small forces and large R, a second method is also used to define the instantaneous elastic jump d1 and d2. In this case, the elastic regime starts when the force is turned on (off) and ends when the first order derivative of x(t)−vt reaches its maximum (minimum). No significant differences were found when the results of both methods were compared (data not shown).
Step-finding analysis of magnetic tweezers data
Sudden jumps of the bead after the elastic regime are identified using a step-finding algorithm. The data trace is first filtered using Savitzky-Golay filtering function in Matlab (order 3, window size is 21). Differences along the vector of the bead positions x, dx =x(n+1)− x(n)(n is the frame number), are calculated as the approximate derivative. Distributions of positive differences P+(dx) and distributions of negative differences P−(dx) are fitted to Gaussian distributions, and the standard deviations are reported as σ+ and σ− respectively. Variance σerr of the time-varying data trace is obtained using the algorithm estimatenoise.m (available from MathWorks.com). A step is identified for a region of ≥ 7 points where the dx are all larger than 3σ− and the step size is larger than 3σerr. Since the number of steps of a data trace is dependent on time, and the total time of each trace can vary from run to run each trace is trimmed to be 30 seconds long for this analysis.
Description of simulations
Simulated networks are constructed by placing 250 straight filaments of length 10 μm with uniformly random positions and orientations in a square simulation box of side length 25 μm. Opposite edges of the box were connected by periodic boundary conditions. Filaments were modeled as continuum linear elastic beams having stretching modulus μ = 1.3 × 10⁴ pN and bending modulus κ =LpkBT, with persistence length Lp = 2000 μm. The continuum strain energy was discretized by dividing the filaments into small segments of length Lo = 0.1 μm and approximating derivatives by finite differences, effectively placing linear springs of modulus Ks = μ/L0 along the segments, and angle springs of modulus Kb = κ/L0 between each pair of segments. Intersections of all filaments were identified as attachment sites for crosslinks, which connect the two intersecting segments of filaments. Crosslinks are modeled as linear springs with stiffness Kc = 105pN/μm.
Each simulation consisted of a sequence of time steps. During each step, intact crosslinks are randomly broken following Bell’s model pi = p0exp(fiδ/kBT) where fi is crosslink i’s internal force; while broken crosslinks are rebonded randomly following a fixed probability pf. Following the unbinding/binding step during each time step, the deformed state and forces/stresses in the filaments were computed by enforcing mechanical equilibrium. The equilibration time is short compared to bond breaking rate. To account for this in the simulation, we use an adaptive time step adjusted so that multiple bond breaking events do not occur in one step and mechanical equilibrium is established after each breaking event. In all simulations p0 = 0.2 and pf = 0.8.
Conclusions
Investigations of the mechanical and structural properties of densely crosslinked MT networks have revealed new insight into the molecular origins of time- and force-dependent network rearrangements in rigidly-crosslinked rigid rod networks. At short times, nonlinear elasticity is observed, which shows stiffening at small forces and softening at large forces. Interestingly, this elasticity is reversible, even in the softening regime, which we attribute to force-induced unbinding of crosslinks. At longer times, significant creep is observed consistent with bond unbinding. Our interpretation of these results is that for long rigid and semiflexible filaments having many crosslinks, it is possible to attribute dissipation to crosslink breakage and yet observe elastic behaviour, as long as most of the original crosslinks are preserved under the period of loading. The fact that, even after long loading times or higher forces where there is significant plastic flow, the system retains its elastic modulus shows that crosslinker breakage is balanced by the formation of new crosslinks in the network. Thus, the existence of plastic flow results from a competition between new and original crosslinkers. This view is supported by our numerical simulations and accounts in a semi-quantitative manner for both the observed plastic flow and the dependence of the creep velocity upon the applied force.
Bond unbinding is particularly important in understanding cell mechanics, where in vivo cytoskeletons are crosslinked by different flexible and transient crosslinks that can remodel the structure under external tension/compression or thermal excitation. Although this aspect of cytoskeletal dynamics has been imperfectly explored in controlled in vitro experiments, there are clear similarities between our results and those obtained using networks of crosslinked actin bundles, which also lack entropic elasticity. For those networks, it has also been argued that non-affine bending deformations control the onset of the nonlinear behaviour and that forced-induced crosslinker unbinding can limit network stiffening 46, 47. Unlike actin bundles, which can have variable diameter and composition, the single filament properties of MTs are well known, making them a model enthalpic polymer. While the simple system of crosslinked MTs lacks the chemical complexity and active dynamics of a physiological cytoskeleton, we propose that this simplified system serves as an important testing ground for understanding cytoskeletal remodelling due to an externally applied load.
Supplementary Material
Acknowledgments
Authors acknowledge support of a Burroughs Wellcome Fund Career Award at the Scientific Interface (to MTV), partial support from NSF grants DMR-0907212 (to AJL), CMMI-0748034 (to WSK) and DMR-1006128 (to WSK), and a NIH/NCRR Shared Instrumentation Grant (1S10RR017753-01). We thank Omar Saleh, UCSB, for providing laboratory access and technical support, and Leslie Wilson, UCSB for providing tubulin proteins.
Footnotes
Electronic Supplementary Information (ESI) available: See DOI: 10.1039/b000000x/
References
- 1.Gardel ML, Nakamura F, Hartwig JH, Crocker JC, Stossel TP, Weitz DA. Proceedings of the National Academy of Sciences of the United States of America. 2006;103:1762–1767. doi: 10.1073/pnas.0504777103. [DOI] [PMC free article] [PubMed] [Google Scholar]
- 2.Koenderink GH, Dogic Z, Nakamura F, Bendix PM, MacKintosh FC, Hartwig JH, Stossel TP, Weitz DA. Proceedings of the National Academy of Sciences of the United States of America. 2009;106:15192–15197. doi: 10.1073/pnas.0903974106. [DOI] [PMC free article] [PubMed] [Google Scholar]
- 3.Qi W, Janmey PA. Current Opinion in Solid State & Materials Science. 2011;15:177–182182. doi: 10.1016/j.cossms.2011.05.002. [DOI] [PMC free article] [PubMed] [Google Scholar]
- 4.Gardel ML, Valentine MT, Crocker JC, Bausch AR, Weitz DA. Phys Rev Lett. 2003;91:158302/158301–158302/4158302/4158304. doi: 10.1103/PhysRevLett.91.158302. [DOI] [PubMed] [Google Scholar]
- 5.Morse DC. Macromolecules. 1998;31:7044–7067. [Google Scholar]
- 6.Mackintosh FC, Kas J, Janmey PA. Phys Rev Lett. 1995;75:4425–4428. doi: 10.1103/PhysRevLett.75.4425. [DOI] [PubMed] [Google Scholar]
- 7.Schmidt FG, Hinner B, Sackmann E. Phys Rev E. 2000;61:5646–5653. doi: 10.1103/physreve.61.5646. [DOI] [PubMed] [Google Scholar]
- 8.Mizuno D, Head DA, MacKintosh FC, Schmidt CF. Macromolecules. 2008;41:7194–7202. [Google Scholar]
- 9.Lieleg O, Schmoller KM, Claessens M, Bausch AR. Biophysical Journal. 2009;96:4725–4732. doi: 10.1016/j.bpj.2009.03.038. [DOI] [PMC free article] [PubMed] [Google Scholar]
- 10.Broedersz CP, Storm C, MacKintosh FC. Physical Review E. 2009;79:11. doi: 10.1103/PhysRevE.79.061914. [DOI] [PubMed] [Google Scholar]
- 11.Yao NY, Becker DJ, Broedersz CP, Depken M, MacKintosh FC, Pollak MR, Weitz DA. Journal of Molecular Biology. 2011;411:1062–1071. doi: 10.1016/j.jmb.2011.06.049. [DOI] [PMC free article] [PubMed] [Google Scholar]
- 12.Stossel TP, Condeelis J, Cooley L, Hartwig JH, Noegel A, Schleicher M, Shapiro SS. Nat Rev Mol Cell Biol. 2001;2:138–145. doi: 10.1038/35052082. [DOI] [PubMed] [Google Scholar]
- 13.Levine AJ, MacKintosh FC. The Journal of Physical Chemistry B. 2009;113:3820–3830. doi: 10.1021/jp808192w. [DOI] [PubMed] [Google Scholar]
- 14.MacKintosh FC, Levine AJ. Physical Review Letters. 2008;100:018104. doi: 10.1103/PhysRevLett.100.018104. [DOI] [PubMed] [Google Scholar]
- 15.Lin YC, Koenderink GH, MacKintosh FC, Weitz DA. Macromolecules. 2007;40:7714–7720. [Google Scholar]
- 16.Yang YL, Lin J, Kaytanli B, Saleh OA, Valentine MT. Soft Matter. 2012;8:1776–1784. [Google Scholar]
- 17.Gittes F, Mickey B, Nettleton J, Howard J. J Cell Biol. 1993;120:923–934. doi: 10.1083/jcb.120.4.923. [DOI] [PMC free article] [PubMed] [Google Scholar]
- 18.Brangwynne CP, MacKintosh FC, Weitz DA. Proc Natl Acad Sci U S A. 2007;104:16128–16133. doi: 10.1073/pnas.0703094104. [DOI] [PMC free article] [PubMed] [Google Scholar]
- 19.Bell GI. Science. 1978;200:618–627. doi: 10.1126/science.347575. [DOI] [PubMed] [Google Scholar]
- 20.Doi M, Edwards SF. The theory of polymer dynamics. Oxford University Press; Oxford: 1986. [Google Scholar]
- 21.Hagan MF, Elrad OM, Jack RL. Journal of Chemical Physics. 2011;135:13. doi: 10.1063/1.3635775. [DOI] [PMC free article] [PubMed] [Google Scholar]
- 22.Schmoller KM, Lieleg O, Bausch AR. Biophysical Journal. 2009;97:83–89. doi: 10.1016/j.bpj.2009.04.040. [DOI] [PMC free article] [PubMed] [Google Scholar]
- 23.Schmoller KM, Lieleg O, Bausch AR. Soft Matter. 2008;4:2365–2367. [Google Scholar]
- 24.Lieleg O, Schmoller KM, Cyron CJ, Luan YX, Wall WA, Bausch AR. Soft Matter. 2009;5:1796–1803. [Google Scholar]
- 25.Blundell JR, Terentjev EM. Macromolecules. 2009;42:5388–5394. [Google Scholar]
- 26.Storm C, Pastore JJ, MacKintosh FC, Lubensky TC, Janmey PA. Nature. 2005;435:191–194. doi: 10.1038/nature03521. [DOI] [PubMed] [Google Scholar]
- 27.Stricker J, Falzone T, Gardel ML. Journal of Biomechanics. 2010;43:9–14. doi: 10.1016/j.jbiomech.2009.09.003. [DOI] [PMC free article] [PubMed] [Google Scholar]
- 28.Uhde J, Feneberg W, Ter-Oganessian N, Sackmann E, Boulbitch A. Physical Review Letters. 2005;94:4. doi: 10.1103/PhysRevLett.94.198102. [DOI] [PubMed] [Google Scholar]
- 29.Ter-Oganessian N, Pink DA, Boulbitch A. Physical Review E. 2005;72:9. doi: 10.1103/PhysRevE.72.041511. [DOI] [PubMed] [Google Scholar]
- 30.Ter-Oganessian N, Quinn B, Pink DA, Boulbitch A. Physical Review E. 2005;72:13. doi: 10.1103/PhysRevE.72.041510. [DOI] [PubMed] [Google Scholar]
- 31.Uhde J, Ter-Oganessian N, Pink DA, Sackmann E, Boulbitch A. Physical Review E. 2005;72:10. doi: 10.1103/PhysRevE.72.061916. [DOI] [PubMed] [Google Scholar]
- 32.Yang Y, Lin J, Meschewski R, Watson E, Valentine MT. BioTechniques. 2011;51:29–54. doi: 10.2144/000113701. [DOI] [PubMed] [Google Scholar]
- 33.Lee H, Ferrer JM, Lang MJ, Kamm RD. Physical Review E. 2010;82:4. doi: 10.1103/PhysRevE.82.011919. [DOI] [PMC free article] [PubMed] [Google Scholar]
- 34.Merkel R, Nassoy P, Leung A, Ritchie K, Evans E. Nature. 1999;397:50–53. doi: 10.1038/16219. [DOI] [PubMed] [Google Scholar]
- 35.Grubmuller H, Heymann B, Tavan P. Science. 1996;271:997–999. doi: 10.1126/science.271.5251.997. [DOI] [PubMed] [Google Scholar]
- 36.Moy VT, Florin EL, Gaub HE. Science. 1994;266:257–259. doi: 10.1126/science.7939660. [DOI] [PubMed] [Google Scholar]
- 37.Lieleg O, Claessens M, Luan Y, Bausch AR. Physical Review Letters. 2008;101:4. doi: 10.1103/PhysRevLett.101.108101. [DOI] [PubMed] [Google Scholar]
- 38.Tharmann R, Claessens MMAE, Bausch AR. Physical Review Letters. 2007;98:088103. doi: 10.1103/PhysRevLett.98.088103. [DOI] [PubMed] [Google Scholar]
- 39.Xu JY, Tseng Y, Wirtz D. Journal of Biological Chemistry. 2000;275:35886–35892. doi: 10.1074/jbc.M002377200. [DOI] [PubMed] [Google Scholar]
- 40.Chaudhuri O, Parekh SH, Fletcher DA. Nature. 2007;445:295–298. doi: 10.1038/nature05459. [DOI] [PMC free article] [PubMed] [Google Scholar]
- 41.Brangwynne CP, MacKintosh FC, Kumar S, Geisse NA, Talbot J, Mahadevan L, Parker KK, Ingber DE, Weitz DA. Journal of Cell Biology. 2006;173:733–741. doi: 10.1083/jcb.200601060. [DOI] [PMC free article] [PubMed] [Google Scholar]
- 42.Miller HP, Wilson L. In: Methods in Cell Biology, Vol 95: Microtubules, in Vitro. Wilson L, Correia JJ, editors. Vol. 95. Elsevier Academic Press Inc; San Diego: 2010. pp. 3–15. [Google Scholar]
- 43.Strick TR, Allemand JF, Bensimon D, Bensimon A, Croquette V. Science. 1996;271:1835–1837. doi: 10.1126/science.271.5257.1835. [DOI] [PubMed] [Google Scholar]
- 44.Gosse C, Croquette V. Biophys J. 2002;82:3314–3329. doi: 10.1016/S0006-3495(02)75672-5. [DOI] [PMC free article] [PubMed] [Google Scholar]
- 45.Ribeck N, Saleh OA. Rev Sci Instrum. 2008;79:6. doi: 10.1063/1.2981687. [DOI] [PubMed] [Google Scholar]
- 46.Lieleg O, Bausch AR. Physical Review Letters. 2007;99:158105. doi: 10.1103/PhysRevLett.99.158105. [DOI] [PubMed] [Google Scholar]
- 47.Lieleg O, Claessens MMAE, Heussinger C, Frey E, Bausch AR. Physical Review Letters. 2007;99:088102. doi: 10.1103/PhysRevLett.99.088102. [DOI] [PubMed] [Google Scholar]
Associated Data
This section collects any data citations, data availability statements, or supplementary materials included in this article.