

Abstract
A number of studies have demonstrated that the relative timing of audiovisual stimuli is especially important for multisensory integration of speech signals although the neuronal mechanisms underlying this complex behavior are unknown. Temporal coincidence and congruency are thought to underlie the successful merging of two inter-modal stimuli into a coherent perceptual representation. It has been previously shown that single neurons in the non-human primate prefrontal cortex integrate face and vocalization information. However, these multisensory responses and the degree to which they depend on temporal coincidence have yet to be determined. In this study we analyzed the response latency of ventrolateral prefrontal (VLPFC) neurons to face, vocalization and combined face–vocalization stimuli and an offset (asynchronous) version of the face–vocalization stimulus. Our results indicate that for most prefrontal multisensory neurons, the response latency for the vocalization was the shortest, followed by the combined face–vocalization stimuli. The face stimulus had the longest onset response latency. When tested with a dynamic face–vocalization stimulus that had been temporally offset (asynchronous) one-third of multisensory cells in VLPFC demonstrated a change in response compared to the response to the natural, synchronous face–vocalization movie. Our results indicate that prefrontal neurons are sensitive to the temporal properties of audiovisual stimuli. A disruption in the temporal synchrony of an audiovisual signal which results in a change in the firing of communication related prefrontal neurons could underlie the loss in intelligibility which occurs with asynchronous speech stimuli.
Keywords: frontal lobe, multisensory integration, vocalizations, faces, temporal coincidence, neurophysiology
INTRODUCTION
Timing is everything – not only in our interactions with the world around us but also during neuronal interactions within the brain. The timing of auditory and visual events is especially important during multisensory integration in which multiple sources of information may converge in the brain (Meredith et al., 1987; Schroeder et al., 2008; Lakatos et al., 2009). External factors, such as the timing in the presentation of an auditory and a visual stimulus, as well as internal factors, such as the synaptic transmission of information by the auditory and visual systems, can both affect the integration of audiovisual information in the cortex. It has been shown that external sensory stimuli with temporal and spatial coincidence (i.e. signals in close temporal and spatial proximity) are more readily fused into a single perceptual unit (Munhall et al., 1996; Bertelson and Radeau, 1981). Temporal coincidence or synchrony, is especially important for the integration of audiovisual speech signals (Dixon and Spitz, 1980; Munhall et al., 1996; de Gelder and Bertelson, 2003; Macaluso et al., 2004). In fact the temporal coincidence of conflicting crossmodal information contributes to the McGurk and ventriloquist effects (McGurk and MacDonald, 1976; Driver, 1996; Bertelson and Aschersleben, 2003) which demonstrate some important principles of audiovisual integration.
The neuronal mechanisms which underlie the integration of audiovisual information are less clear. Physiological recordings in a non-speech model system – the superior colliculus of the cat (Stein and Meredith, 1993), have delineated important features which may underlie sensory integration in a general sense. Stein and Meredith have determined that both stimulus congruence and temporal coincidence of audiovisual stimuli evoke characteristic neuronal changes which are correlated with optimum perception (Stein and Meredith, 1993). Recordings in the superior colliculus (Meredith et al., 1987; Rowland et al., 2007) which examined response latencies to simple auditory and visual stimuli, determined that in most cases, simultaneous presentation of multiple sensory stimuli results in optimal integration of these stimuli. In contrast, auditory and visual events that occur farther away in time (temporally disparate) evoke less optimal responses. Furthermore, it has been suggested that multisensory integration may result in shorter response latencies relative to the unimodal condition (Rowland et al., 2007). Understanding the relative neuronal timing of complex stimuli including faces and vocalizations as they converge on specific brain regions could aid in understanding the neuronal mechanisms which under-lie complex behaviors including communication and recognition which involve integration.
It has been previously shown that information regarding vocalizations and facial gestures combines to affect neuronal processing in single neurons of the primate auditory cortex, superior temporal sulcus and ventrolateral prefrontal cortex (Barraclough et al., 2005; Ghazanfar et al., 2005; Sugihara et al., 2006; Kayser et al., 2010). In the ventrolateral prefrontal cortex (VLPFC) studies have shown that neurons respond to species-specific vocalizations (Romanski et al., 2005) and to faces (O’Scalaidhe et al., 1999). Moreover, it has been shown that single neurons in the macaque VLPFC integrate species-specific faces with their corresponding vocalizations (Sugihara et al., 2006). Non-linear multisensory neurons exhibit enhancement or suppression to combined presentations of faces and corresponding vocalizations compared with their response to unimodal presentations (Sugihara et al., 2006).
Prefrontal neurons which integrate complex, socially relevant events such as faces and their corresponding vocalizations may be sensitive to large changes in the temporal synchrony, or simultaneous presentation, of a facial gesture and the corresponding vocalization. Stimuli which are not perceived as coincident or close in time may be perceived as being asynchronous and may not be integrated. For example it has been shown that increasing the naturally occurring stimulus onset asynchrony (SOA) between a speech sound and the accompanying visual mouth movement, can result in a loss of intelligibility of speech or a loss in the integration of sounds and visual stimuli (Massaro et al., 1996; van Atteveldt et al., 2007). It is possible that this lack of intelligibility and integration is due to a decrease in neuronal activity in areas which are essential in communication including VLPFC. For this reason we examined the response latency of prefrontal neurons to unimodal and multisensory stimuli and also asked whether prefrontal neurons were sensitive to changes in the synchronous onset of dynamic vocalization stimuli.
While in our previous study we have documented multisensory responsive neurons and the types of multisensory interactions which occur in ventral prefrontal cortex, in the current study, we have analyzed and documented the response timing of these neurons. Furthermore, we hypothesized that brain regions such as VLPFC which are involved in the perception and integration of audiovisual communication would have neurons which are sensitive to the synchrony of audiovisual stimuli. Our results show that in a proportion of VLPFC neurons, asynchronous audiovisual face–vocalization stimuli suppress multisensory responses.
EXPERIMENTAL PROCEDURES
Subjects and surgical methods
In the following study we have re-analyzed 487 cells from Sugihara et al. (2006) and have added 282 new cells (n=769 total cells), from the same three adult rhesus monkeys (Macaca mulatta), 1 female (6.7 kg) and 2 males (8.0 and 12.0 kg) previously recorded. All methods were in accordance with National Institutes of Health standards and all experimental protocols were approved by the University of Rochester Care and Use of Animals in Research committee. Recording cylinders were placed over VLPFC to maximize recordings in areas 12/47 and 45 (Preuss and Goldman-Rakic, 1991; Petrides and Pandya, 2002). Recordings were made in the left hemisphere of 2 animals and the right hemisphere of one of the animals.
Apparatus and general recording procedure
All training and recording was performed in a sound-attenuated room lined with Sonex (Acoustical Solutions). Auditory stimuli (65–75 dB SPL measured at the level of the subject’s ear) were presented by either a pair of Audix PH5-vs speakers (frequency response ±3 dB, 75–20,000 Hz) located on either side of a center computer monitor, or a centrally located Yamaha MSP5 monitor speaker (50–40,000 Hz), located 76 cm from the monkey’s head and placed just below the computer monitor.
Each day the animal subjects were brought to the laboratory where they performed perceptual and memory tasks for juice reward. In the present study animals performed a fixation task where auditory, visual or audiovisual stimuli were presented while animals maintained fixation. The trial began with a 500 ms pretrial fixation period where only the fixation point was visible on the screen followed by the stimulus presentation (which lasted 500–1100 ms), and then a 500 ms post-stimulus fixation period. A juice reward was delivered at the termination of the post-stimulus period, and the fixation requirement was released concurrently with the juice reward. A 2–3 s inter-trial interval preceded the start of the next trial which began by presenting the fixation point. When the subject voluntarily fixated the central point the trial would commence. Since we used fixation as a measure of attention, breaking fixation during the fixation or stimulus periods resulted in an aborted trial. The fixation window was 2–4 degrees during the pre-stimulus fixation period and enlarged during the stimulus period to the same size as the visual stimuli which subtended 7–10 degrees. Eye position was continuously monitored using an ISCAN infrared pupil monitoring system (ISCAN, Inc., Woburn, MA).
During recordings a parylene-coated Tungsten microelectrode (0.8–2.0 MΩ at 1 kHz) was lowered into the target region by a hydraulic microdrive (Narishige Mω-95C), which fit over the recording cylinder. The neuronal activity was amplified (BAK MD-4 amplifier), filtered (Krohn-Hite, 3500, Avon, MA), discriminated (BAK DIS-I Window Discriminator) and displayed on an oscilloscope. Discriminated spikes were digitized and saved online. Simultaneous isolation of two units was possible with dual window discriminators. The timing of the behavioral contingencies, acquisition and storage of TTL spike data, presentation of all stimuli, delivery of reward, and monitoring of eye position were controlled by a computer running CORTEX (NIH derived software, dual-computer mode).
Stimuli and testing
As described previously (Sugihara et al., 2006) the library of audiovisual stimuli consisted of the audio and video portions of short vocalization movies which were made from recordings of familiar conspecifics in our home colony or from familiar and unfamiliar humans. All stimuli were generated from digitally recorded movies and were processed using Adobe Premier (Adobe Systems, Inc.) and Jasc Animation studio (Jasc Software, Inc.), as well as several custom and freeware programs. Audio and visual components of recorded movies were divided into .wav and .mpeg streams for filtering. The auditory stimuli were filtered and edited using MATLAB (Mathworks, Inc.) and SIGNAL (Engineering Design, Cambridge, MA). Static visual images of monkey faces were created from single frames of the digital movies and were selected to represent the typical facial gesture of the vocalization they were taken from based on previous studies of rhesus macaques (Hauser and Marler, 1993; Partan, 2002).
We separated the audio and video components of each movie to create 6 stimuli:
Auditory (A) – this stimulus is the audio track of the vocalization movie. The original audio track of the full vocalization movie (AVm) contains some silence (the average amount of silence across the 22 monkey vocalization movies=15 ms) before the audible vocalization begins. Since we planned to measure the auditory response latency, the silent interval before the vocalization began was truncated.
Visual – static face (Vs) – the static face taken from the vocalization movie which portrays the prototypical facial expression (as previously described by Gouzoules et al. (1984), Hauser and Marler (1993) and Partan (2002)) for this vocalization gesture is presented.
Audiovisual (AVs) – the static face (stimulus Vs) presented simultaneously with the truncated vocalization (A). These 3 stimuli – A, Vs and AVs were used to calculate the multisensory latencies since the AVs condition is the combination of A and Vs and have no leading silence or extraneous motion to complicate measurement of the response latency.
Dynamic visual movie stimulus (Vm) – the video track of the vocalization movie, i.e. a “silent movie”.
Audio-visual dynamic movie (AVm) – the recorded audio-visual movie of the dynamic vocalization movie. We will use the term synchronous for this natural vocalization movie.
Asynchronous audio-visual movie (Async) – In this stimulus the truncated vocalization (A) was presented first, and then the video was followed 40 ms later. Therefore, the SOA between the audio and video tracks in this Async stimulus was 40-ms plus the duration of the truncated silence (Fig. 1). The range of the SOAs was from −40 ms to −290 ms with the negative sign indicating that for the Async stimulus, the vocalization preceded the dynamic face movie. We deliberately chose a large negative offset to increase the possibility of perturbing the neural response since it has been shown that longer offset intervals are more easily discriminated in studies of temporal order judgment in humans (Vatakis et al., 2008).
Fig. 1.

Audiovisual stimulus presentation. Short movies of vocalizations or other motion was dissected into auditory and visual components and presented. (a) Each cell was tested with the auditory alone (A), a static image from the movie (Vs), a combination of the auditory and the static image (AVs), a version of the movie without any sound (Vm) and the movie plus the sound (AVm); Adapted from Sugihara et al. (2006). (b) In addition each cell was tested with an offset audio-visual stimulus (Async) where the auditory stimulus, in this case, a vocalization, preceded the face movie stimulus.
Stimulus testing procedure
In the present study we isolated neurons in VLPFC and tested them with single and combined presentations of faces and corresponding vocalizations and analyzed their neuronal activity to determine onset latency and multisensory response. In a subset of cells (n=391 cells), the face–vocalization stimuli was offset and made asynchronous and was included in the testing stimulus battery.
As was described in Sugihara et al. (2006), cells were isolated and then briefly tested in a short (5 trials each) face– vocalization fixation task with a list of 10 different static faces and their congruent vocalization pairs so that a preferred stimulus could be selected for further testing in the fixation audiovisual task. If a cell showed no preference it meant there was no significant response above baseline to any of the face–voice pairs in the list presented and so a congruent face–vocalization pair was chosen at random. Cells were then tested with the stimulus set (see methods above) of the preferred face–vocalization pair described above and portrayed in Fig. 1: auditory alone (A), visual–static face (Vs), auditory+static face (AVs), video track of the movie (Vm), and the audio-visual movie (AVm). In a subset of cells, an asynchronous audio-visual movie (Async, as described above) was included in this list of stimuli. Each auditory, visual or combined stimulus was presented 10–12 times (1 per trial) in a randomized block. After a cell completed testing with the first face–vocalization block, a second stimulus pair was chosen and tested if the neuronal activity was stable. Upon completion, the electrode was advanced 200 μm and a new cell or pair of cells was isolated and tested.
When subjects completed recordings in all planned studies they were perfused with 4% paraformaldehyde and the brain was blocked, cryoprotected and sectioned on a cryostat at 40 μm. Nissl-stained coronal sections were charted and the locations of electrode trajectories were estimated from tracer injections and marker lesions placed in recording locations (Fig. 2).
Fig. 2.
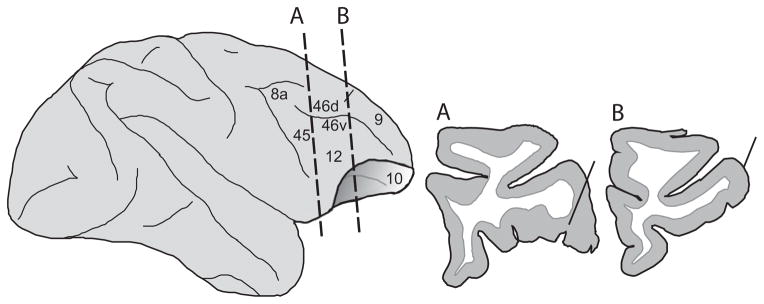
Location of recordings. A lateral schematic of the macaque frontal lobe with two coronal sections through the recording area are shown. The locations of two recording tracks through the caudal-ventral visual responsive region (A) and the anterolateral auditory responsive region (B) are shown in the two coronal sections taken from the histological analysis of one monkey in the present study. The locations of these two coronal sections are depicted on the lateral brain schematic with dotted lines. Unimodal and multisensory neurons from the present study were recorded across the region delimited by these two anterior and posterior sections and also caudally to the arcuate sulcus.
Data analysis
Four hundred and eighty-seven cells from Sugihara et al. (2006) and 282 new cells were recorded and analyzed (n=769 cells). These cells were characterized as auditory, visual or multisensory using a 3-way ANOVA as in Sugihara et al. (2006). The analysis window for the stimulus period began 50 ms after stimulus onset and included the entire duration of the auditory stimulus+250 ms (maximum window size=1000 ms). Spike counts were converted into rates. Spontaneous activity was measured during the 500 ms preceding the initiation of fixation and converted to a spike rate. The three-way ANOVA model assessed the responses of neurons to auditory (A), static visual stimuli (Vs), visual motion stimuli (Vm) or combined auditory-visual static (AVs) or auditory visual-motion (AVm) stimuli is given by: r = μ + αi + βj + γk + δi;j + εi;k + σ, where r is the response of the neuron on an individual trial, αi, βj, and γk refer to the main effects of A, Vs and Vm conditions respectively, μ is the intercept and σ is a Gaussian random variable. δi,j and εi,k refer to the interaction terms, which test the null hypothesis that the response in the multisensory condition (AVs or AVm) is the sum of the responses to the corresponding unimodal stimuli (A and Vs or A and Vm).
With this analysis we characterized task-responsive cells as unimodal auditory if they had a significant main effect of the auditory factor (A), but neither of the visual factors (Vs or Vm); unimodal visual if there was a significant main effect of one or both of the visual factors, but not the auditory factor; linear multisensory, if they had significant main effects of both the auditory condition, and one or both of the visual conditions; nonlinear multisensory if they had a significant interaction effect (A+Vs, or A+Vm). Cells which had a main effect of A and Vm or A and Vs, and no interaction effect, were considered linear multisensory since the multisensory response could be explained as a linear sum of the two unimodal responses. Neurons that had a significant interaction effect, either AVs (δi,j) or AVm (εi,k), in the ANOVA were categorized as non-linear multimodal. It is important to note that these interaction terms do not test for a significant response in the multisensory condition with respect to baseline, but rather test the null hypothesis that the response in the multisensory condition is equal to the linear sum of the responses in each of the unimodal conditions. Means were compared to assess suppression or enhancement of the AV response to the unimodal response. Bimodal neurons, also known as linear multisensory neurons, had a main effect of both A and V.
Latency analysis
We calculated the response onset latency for all stimulus conditions including: A (vocalization alone), Vs (static face), Vm (visual movie), AVs (vocalization plus the static face), AVm (audio-visual movie), and Async. However, to strictly compare unisensory to multisensory response latencies, we used the latency results for stimuli A, Vs and AVs since the AVs condition is the direct combination of A and Vs and there is no motion in the Vs condition which might evoke a different response. Comparison of the static face (Vs) and the video track of the movie of the facial gesture (Vm) were done to determine if there were differences during the visual motion stimulus since motion occurs at different times in different vocalization gestures and attention is drawn to different parts of the face during different gestures (Gothard et al., 2004). The static face stimulus can help us to reliably estimate the visual onset latency apart from facial motion while the other provides a latency estimate for a natural facial gesture stimulus. Comparison of the latencies for the synchronous (AVm) and the asynchronous (Async) stimuli was done to assess the response of VLPFC neurons to changes in the temporal synchrony of audiovisual stimuli. The latencies are reported in msec±sem (standard error of the mean).
We first determined if cells had a response during the stimulus period that was significantly different from background across any of the stimulus conditions using a Wilcoxon rank-sum test. Latencies for all stimulus conditions were then calculated. While we have used the traditional spike density function (SDF) based method, and the half-peak method for determining latency across an accumulation of trials, in the current study we employed a Poisson spike train analysis (Legendy and Salcman, 1985; Hanes et al., 1995). The Poisson spike train analysis allows for computation of single trial latencies which can be compared across different stimulus conditions by statistical tests and was therefore favored in the current study. The Poisson spike train analysis evaluates how unlikely it is that the number of spikes during a stimulation period occurs by chance, and defines it as the surprise index (SI), which is computed with the following formula:
P is the probability that n or more spikes are observed within a time interval of length T when the mean spike rate, r is assumed and is given by Poisson’s formula as
Therefore, SI becomes high if the probability of observing n or more spikes is low. In our study, this analysis was performed as follows. First, r was determined as the number of spikes in the spontaneous activity period divided by the duration of that period. Second, the spike train from the beginning of the stimulation period was examined through to the end of that period until finding the first two consecutive spikes which had a mean spike rate greater than or equal to r. The time between these two became the initial value of T. The remaining spikes were then indexed successively. The inter-spike interval (ISI) between each indexed spike and its previous spike was added to T until the end of the spike train and the SI was calculated after the addition of each ISI. The spike at the end of the interval T with the maximum SI value defined the end of the neural response to the stimulus. Next, SI was calculated for the time interval T from the first spike after stimulus presentation to the spike defining the end of the response period. The spikes from the first one in the spike train were then removed sequentially until reaching the end of the response period. Every time a spike was removed, the ISI between that spike and the next spike was subtracted from T and SI was calculated again. The spike at which the SI was maximized was defined as the beginning of the response period. Finally, the trial was regarded as having no response if the SI from the interval of the defined response period was not significant (P<0.05). After the latency of each trial was calculated, we estimated the latencies of cells in each stimulus condition by taking the median of the trial latencies in the condition. To increase the reliability of this estimation we employed a strict criterion that the latency of the cell was considered valid only when there were at least four trial latencies falling within 200-ms range from the cell latency. In the SDF-based estimation, the spike rate during the stimulus presentation was compared with the spontaneous rate. First the spike trains were smoothed with a Gaussian window (σ=30 ms) and the activity during 250 ms before the stimulus onset was taken as the baseline. Then, the latency was taken as the first time that the spike rate exceeded the baseline by 2 times its standard deviation (SD). The half-peak method was adopted from Lee et al. (2007). In this method, the peak rate was determined as the first maximum that the spike rate during the stimulus period exceeded the baseline by 3 times its SD and then, the latency was taken as the first time that the spike rate exceeded half the peak rate plus the spontaneous rate. In both SDF-based and half-peak, no latency was taken if the spike rate or the peak rate during the stimulus period was not significantly greater than the spontaneous rate by the above criteria. A table of the average latencies across conditions using different methods is shown (Table 1).
Table 1.
Response latencies of neurons that were auditory responsive or visual responsive (including unimodal and multisensory cells) are shown in the top part of the table. The latencies calculated using Poisson, Half-peak and SDF-based methods are given in ms ± the standard error of the mean (SEM). In the lower part of the table the latencies for multisensory neurons with estimates for A, V and AV conditions in more than 4 trials are given as mean ± SEM
| Vocalization | Face (Static) | FACE+VOC | |
|---|---|---|---|
| Response latencies of VLPFC cells | |||
| Poisson | 160±10 (n=76) | 223±8 (n=168) | |
| Half-peak | 197±15 (n=71) | 241±10 (n=178) | |
| SDF | 178±14 (n=67) | 219±10 (n=174) | |
| Multisensory cells | |||
| Poisson | 168±17 (n=35) | 202±15 (n=35) | 192±18 (n=35) |
| Half-peak | 208±28 (n=30) | 235±26 (n=30) | 220±32 (n=30) |
| SDF | 181±25 (n=27) | 205±27 (n=27) | 186±33 (n=27) |
Analysis of the effect of asynchronous audiovisual stimuli
The effect of the asynchronous (Async) stimulus on neuronal firing was compared to the synchronous AVm vocalization in both spike rate and response latency. First we defined a fixed time window of 800 ms (starting at the beginning of the stimulus period) and separated it into two 400-ms bins and a one-way MANOVA was performed comparing the response of the synchronous (AVm) movie with the asynchronous movie (Async) with the 2 time bins as dependent measures. For each cell, we also compared the trial-by-trial latencies which were calculated in the Poisson spike train analysis between the normal, synchronous (AVm) movie and the asynchronous movie (Async) with a Wilcoxon Rank-Sum test. The latency measure we employed was the Poisson method since we could compare single trial latencies.
RESULTS
Response latencies of auditory, visual and audio-visual responses in ventrolateral prefrontal cortex
We recorded the responses of single units in VLPFC of three animals during the presentation of auditory, visual and combined audio-visual stimuli during a fixation task (Fig. 1). The recordings reported here in the primate VLPFC include an anterolateral region where auditory responsive cells have been localized (Romanski et al., 2005) corresponding to area 12/47 (Preuss and Goldman-Rakic, 1991; Petrides and Pandya, 2002) and the region posterior to this which contains neurons responsive to complex visual stimuli, including faces (O’Scalaidhe et al., 1997) which includes portions of area 12 and area 45. In Fig. 2, the lateral brain schematic shows the location of two reconstructed electrode tracks through the VLPFC in this study. Our recordings spanned the area from the arcuate sulcus (posterior to the electrode track in Fig. 2A) to the level depicted in the anterior coronal section in Fig. 2B, which was confirmed with histology.
We examined the responses of 769 cells which were recorded during an audiovisual fixation task. In a subset of these cells (n=413) the stimulus testing battery included an offset, asynchronous face–vocalization movie stimuli described above. We used a 3-way ANOVA to characterize neurons as auditory, visual, or multisensory (as described above and in Sugihara et al., 2006). Multisensory neurons were defined as linear multisensory if they were responsive to the unimodal auditory and responsive to one or more of the unimodal visual stimuli, but did not have an interaction effect of the auditory and visual stimuli as defined above (Methods). Non-linear multisensory responsive neurons had an interaction effect in the 3-way ANOVA of auditory and visual stimuli. Of 769 recorded cells, 471 cells had a main effect of Auditory, Visual or an interaction effect of AV and were examined further. We calculated the latencies to the auditory (A), the static visual (face) stimulus (Vs) and the combined auditory+face stimulus (AVs), the visual motion stimulus of the dynamic movie (Vm) and the dynamic audiovisual movie (AVm) as described above (see Methods) for these cells using the Poisson spike train analysis method. Auditory responsive cells, including both unimodal and multisensory neurons, in which there were latency estimates for at least 4 trials during the auditory stimulus presentation (see Methods above) (n=76 cells) had an average response latency of 160±10 (mean± SEM) ms. The range was 29–330 ms. Half-peak and SDF latency calculation methods for the same cells revealed average latencies of 197±15 and 178±14 ms respectively and are summarized in Table 1. The onset latency response for visually responsive neurons which had a main effect of the static face stimulus Vs (n=168 cells) averaged 223±8 (sem) ms, range 32–446 ms. In a subset of cells (n=107) that had a significant response to both a static face and to the dynamic movie containing the face we calculated the latency to both static and dynamic visual stimuli. The response latency to the visual motion stimulus (the silent movie) Vm, averaged 232±10 ms, while the response to the static face in these same cells averaged 212±9 ms. These two visual latencies were significantly different (paired t-test, P<0.01).
There were 259 neurons characterized as either linear or non-linear multisensory based on their response in the three-way ANOVA. Linear neurons had a main effect of the auditory stimulus and a main effect of the visual stimulus (Sugihara et al., 2006) while non-linear cells had an interaction effect of the auditory and visual stimulus. The linear multisensory neuron depicted in Fig. 3A had a response to a vocalization and the corresponding face where the onset latency for the vocalization was 57 ms and to the face was 164 ms and the response to the combined face–vocalization stimulus was 123 ms. In Fig. 3B the robust response to the face had a latency of 174 ms and the combined face–vocalization response latency was 165 ms. Non-linear multisensory neurons, which have a response to the combined auditory and visual stimulus that could not be accounted for by a response to one of the unimodal components or the linear sum of the unimodal conditions (Sugihara et al., 2006), exhibited suppression during the combined stimulus presentation (Fig. 3B, C) or enhancement (Fig. 3D, E) when compared with the unimodal response. In calculating the response latency for a non-linear multisensory neuron it is important to note that one of the unimodal components may not evoke a significant response on its own (and therefore not have a measurable latency estimate) but a strong response can be evoked when the two unimodal components are combined (Fig. 3E). Across all multisensory cells the latency for the response to the vocalization stimulus was 171±10 ms (n=88 cells), to the face was 216±9 ms (n=102 cells) and to the combined face+vocalization stimulus was 209±11 ms (n=104 cells). In order to compare the response to the vocalization and face stimuli in the same cells we confined our calculations to only those cells in which we could estimate the response latency to all three stimuli (A, V and AV). For 35 multisensory cells we estimated the response latency to the vocalization as 168±17 ms, to the face as 202±15 ms and to the combined face+vocalization stimulus as 192±18 ms. In VLPFC multisensory cells, the auditory stimulus elicited the fastest latency more frequently than visual or the combined audiovisual stimulus (Fig. 4). This faster auditory response latency has been shown in other sites of audiovisual convergence including the superior colliculus and in the superior temporal cortex (Meredith et al., 1987; Barraclough et al., 2005; Ghazanfar et al., 2005).
Fig. 3.

Raster and spike density functions are plotted for 5 single units in A–E to the vocalization (A), static face (V) and the combined vocalization and face (AV) stimulus. The onset of the stimuli was at time 0. The static face stimulus lasted 1s in both the V and AV conditions. On each spike density curve, for each stimulus panel, the latencies determined by the Poisson spike train method are shown as filled black circles on the SDF curve with the corresponding latencies listed. The latencies determined by the half-peak method and the SDF-based method are shown with open circles and a triangle respectively. The cell in A was a linear multisensory cell with responses that were significantly increased compared to baseline in both A and V conditions (P <0.001). The single units in B–E were non-linear multisensory cells and had a significant response to the interaction of A and V. The response to AV in B and C (P<0.05) was suppressed compared to the greatest unimodal response. In D and E, the response to AV was enhanced compared to the best unimodal response (P<0.05).
Fig. 4.

The bar graph portrays the number of cells which had an onset latency to the auditory stimulus (A) that was more or less than the onset response latency to the combined face–vocalization (AV) stimulus (black bars), and the number of cells which had an onset latency to the visual stimulus (V) that was more or less than the onset response latency to the combined face–vocalization (AV) stimulus (white bars). In this population of cells the auditory stimulus evoked the shortest latency in most cells and the visual stimulus elicited the longest latency.
Effects of asynchronous stimuli
To further understand the role of prefrontal neurons in sensory integration we investigated the sensitivity of prefrontal neurons to asynchronous audio-visual vocalizations. In a subset (n=391) of the recorded cells an asynchronous version of the audiovisual movie stimulus was included in the stimulus list. The Async stimulus was created by playing the truncated vocalization (A) first followed 40 ms later by the dynamic video of the vocalization (Vm). Thus the alteration of the normal SOA of the vocalization where visual motion of the mouth precedes vocalization was reversed so that the vocalization preceded the onset of the visual movie component as depicted in Fig. 1b. This introduced a large and reversed, stimulus onset asynchrony (SOA) which has been shown to be easily discriminated by human subjects in studies of temporal order judgment (Vatakis et al., 2008). Cells were tested as before with unimodal auditory, unimodal visual, synchronous audiovisual and the asynchronous audiovisual stimuli which was added to the testing battery.
We compared the magnitude and the timing of the neural response to the original AVm movie with that of the Async stimulus. A one-way MANOVA of spike rate in two 400-ms bins during the stimulus period was performed. 78 cells demonstrated a significant change in response to the Async stimulus. Of these 78 cells, 34 cells were classified as multisensory, 22 unimodal visual, 1 unimodal auditory and 21 uncharacterized cells which had been unresponsive to either the unimodal components or the multisensory comparisons but showed a significant response to the Async stimulus when compared with the synchronous AVm stimulus. It is difficult to classify these cells as multisensory since their response could simply be due to a change in the timing of the unimodal component that they are sensitive to. However, it is also possible their response could be due to the change in the timing relationship of the auditory to the visual stimulus – a temporal multisensory response, where a cell is sensitive to the relative timing of the components to one another. Of the 391 neurons tested with the Async stimulus, 97 were multisensory and 35% (34/97) showed a significant change in spike rate to the asynchronous stimuli compared to the synchronous AVm stimulus (Fig. 5). 11/34 cells had a significant change which occurred in the first 400-ms bin of the response period and in 16/34 cells a significant change was present in the latter half of the response period. For most neurons the Async stimulus elicited a decrease in neuronal firing (20/34 cells) compared to the synchronous AVm movie (Figs. 5A, B and 6). In a smaller proportion of cells the Async stimulus elicited a significant enhancement (Fig. 5C, D).
Fig. 5.

Effects of asynchronous stimuli on multisensory prefrontal cells. The neural response to a synchronous face–vocalization movie (AVm) and the same movie with the auditory and visual components presented offset from the original AVm movie stimulus (Async) is shown in 4 single units in A–D. The latency estimated for each condition is shown as on the spike density curve. In A, B, the Async stimulus significantly suppressed the neuronal response compared to the synchronous face–vocalization movie (A, P<0.001; B, P=0.029) and in C, D, the Async stimulus elicited a significantly enhanced response (P<0.05), as analyzed in our MANOVA. In addition, the cells in C, D, also demonstrated a significant change in the onset response latency to the Async stimulus which had a shorter latency than the synchronous AVm stimulus (Wilcoxon Rank Sum test, P<0.05). Latency symbols: filled circle, Poisson; open circle, Half Peak; triangle, SDF based method.
We also compared the response latency for the Async stimuli to the latency for the synchronous AVm audiovisual movie using the Poisson spike train analysis as above. We were able to calculate a latency estimate in 85 cells, and compared the AVm latency to Async latency (Wilcoxon Rank Sum test). A total of 20 cells had a difference in response latency to the Async stimulus. 11 cells were multisensory and 7 were unimodal visual neurons which, as expected, showed a longer latency response to the Async stimulus where the auditory stimulus occurs earlier and the visual stimulus occurs later. Two multisensory cells are shown which demonstrated a significant change in latency and a significant increase in response magnitude (Fig. 5C, D).
Not surprisingly, multisensory cells were more likely to show a change in response magnitude or latency compared to unimodal cells with presentation of the Async stimulus. However there were 21 cells, mentioned above, which had not been classified as unimodal or multisensory and only showed a significant response when the Async stimulus response was compared with the AVm stimulus. Thus, testing cells with audiovisual stimuli of different SOAs may reveal additional multisensory interactions. Multisensory cells more frequently responded to an asynchronous stimulus with a change in response magnitude (35% of multisensory cells) than a change in onset response latency (11%). Thus an overall change in response magnitude might be evidence of integration of the audiovisual components rather than merely a shift in the timing of the response to one of the unimodal components.
DISCUSSION
In this study we analyzed the response latencies of prefrontal neurons to auditory, visual, combined audiovisual and an offset (asynchronous) version of the audiovisual stimuli. For most VLPFC multisensory neurons the auditory stimulus, which was a vocalization in the present study, elicited the shortest latency, and in our population, the face stimulus had the longest latency. We also hypothesized that VLPFC neurons which process and integrate audiovisual communication stimuli would be sensitive to the synchrony of audiovisual stimuli. We demonstrated that one-third (34/97) of the multisensory neurons recorded detect asynchronous audiovisual face–vocalization stimuli and the majority of them (20/ 34) showed a decrease in response magnitude compared to the naturally occurring, synchronous face–vocalization stimuli.
Response latencies of prefrontal neurons to unimodal auditory and visual stimuli
The area we have recorded from in the current study, the macaque VLPFC, is a heterogeneous area with a small, vocalization-responsive region located anterolateral in area 12/47 (Romanski and Goldman-Rakic, 2002; Romanski et al., 2005; Romanski, 2007). Visual responsive neurons predominate across the VLPFC areas 45 and 12/47 and face cells have been localized in both 12/47 and in area 45 (O’Scalaidhe et al., 1997; Sugihara et al., 2006; Romanski and Diehl, 2011) while face-responsive patches have been demonstrated in areas 45 and lateral orbital cortex area 12 (Tsao et al., 2008). We computed onset response latency estimates for a population of VLPFC cells with the Poisson spike train method in response to face, vocalization and combined face–vocalization stimuli. The average onset latency for all vocalization-responsive neurons averaged 160±10 ms (range 29–330 ms) and was shortest compared to the visual and combined audiovisual stimulus for the majority of cells (Fig. 4). The onset latency across all visually responsive cells to the face stimuli was 223±8 ms on average (range 32–471 ms). Interestingly, latency responses to static faces and the dynamic movie stimulus (latency=233±8 ms) differed significantly across responsive cells. It is possible that the response to the face movie peaks later than the response to the static face and our latency methods are sensitive to this peak in response. Alternatively the static face stimuli we utilized, which was a frame taken from the vocalization movie and was the prototypical image of the facial gesture accompanying the vocalization, actually occurs midway through the vocalization and could imply inherent motion and command a similar response as the dynamic movie stimulus but could elicit this response earlier since it is present at onset.
Comparison of the current latencies to face stimuli to previous studies reveals a similar range of latencies. O’Scalaidhe et al. (1999) examined the responses to faces in VLPFC and orbitofrontal neurons and calculated an average latency of 138 ms (range 70–400 ms) in a subset of face-preferring cells using the SDF method while a study of orbitofrontal responses to faces recorded latencies of 130–220 ms (Rolls et al., 2006). Responses to non-face visual stimuli recorded in Rosenkilde et al. (1981) ranged from 100–300 ms. Most of these studies relied on an SDF-based latency calculation which often estimates a shorter latency (Bell et al., 2005). Our estimate for visual response onset latency was 223 ms with the Poisson method and 219 ms with the SDF-based method (Table 1), which are both slightly longer than previous studies. However, in O’Scalaidhe et al. (1999), latency estimates were made in face-selective cells with tests for optimum stimuli, which would elicit a more robust and faster response than less optimum stimuli. In contrast, our neurons were tested with a small set of face stimuli and were responsive, though not selective, for faces. Extrastriate areas which project to VLPFC and which are likely to be driving VLPFC face responses, such as inferotemporal cortex and the dorsal bank of the STS, have response latencies to faces between 80 and 160 ms (Baylis et al., 1985). The timing of these latencies is consistent with IT and the STS providing “face” information to VLPFC neurons at the latencies recorded.
The VLPFC auditory response latencies reported in the current study ranged from 29–288 ms, with an average of 160 ms across both unimodal and multisensory cells. Inspection of data from Russ et al. (2008) depicts neuronal response latencies of approximately 100–300 ms which is within a similar range as the current cells. There are a number of auditory association areas that project to VLPFC including the anterior belt and parabelt, the rostral superior temporal gyrus as well as STS regions TAa and TPO (Romanski et al., 1999a,b). Ghazanfar et al. (2005) reported median peak (not onset) latencies for lateral belt neurons of 93.5 ms (range ~30– 350 ms), from recordings of local field potentials for both multisensory and unimodal auditory responses. A median response latency of 79 ms was reported by Kikuchi et al. (2009), for lateral belt neurons. These short latencies would certainly allow for transmission of auditory signals to VLPFC neurons given the timing that we have calculated for the average response to auditory stimuli by VLPFC neurons.
We were particularly interested in the temporal response profiles of multisensory VLPFC neurons to the unimodal and combined stimulus components. It has been suggested that multisensory integration may result in a shortening of response latencies (Rowland et al., 2007) and studies have shown that in the superior colliculus, simple cross-modal stimuli may elicit faster, more robust, responses compared to the unimodal component stimuli (Rowland et al., 2007). Rowland also showed that response enhancement was greatest in the early part of the response period. However, in the current population of multisensory neurons the auditory stimulus, a vocalization, elicited the shortest latency most frequently and the visual stimulus, a face, elicited the longest latency. In approximately one-third of the multisensory neurons the onset response latency to the combined face–vocalization stimulus was shortest, while in most cells the latency to the combined face–vocalization stimulus lay between that of the auditory and the visual latencies. A similar result was found in Barraclough et al. (2005) where latencies to the auditory stimulus was shortest compared to the latencies for visual or combined audiovisual stimuli. In the STS, the response to a complex unimodal visual stimulus (face, hands, object) resulted in response latencies of 156±16 ms, while the response to a complex auditory stimulus was 114±25 ms and to the combined audiovisual stimulus was 134±19 ms (all values calculated with an SDF based method). The time course in Barraclough et al. (2005) where the auditory component is quickest, followed by the combined AV stimulus, and the visual stimulus is slowest, is similar to the results of the current study. A critical difference between the studies in the superior colliculus and the studies in the STS, auditory cortex and the VLPFC (Barraclough et al., 2005; Ghazanfar et al., 2005; Sugihara et al., 2006) is the use of complex face–vocalization stimuli. Integration of complex stimuli most likely involves a longer time course and may not follow the same principles of integration as described for simple stimuli in superior colliculus neurons (Ross et al., 2007). Importantly the sensory afferents that reach the colliculus versus those that innervate VLPFC originate earlier in the auditory and visual pathways.
Effects of asynchronous stimuli on prefrontal neurons
It has been suggested that the timing of multisensory events is largely constrained by the arrival of visually driven inputs (Musacchia and Schroeder, 2009) where auditory information has arrived first (Cappe et al., 2010). It has also been shown that the timing of the visual stimulus can determine whether a multisensory interaction is enhanced or suppressed with near-simultaneous presentation of auditory and visual stimuli typically leading to the greatest enhancement in superior colliculus neurons (Meredith et al., 1987). Optimal timing of auditory and visual stimuli has also been shown to dictate the occurrence and magnitude of multisensory integration in cortical neurons (Ghazanfar et al., 2005; Lakatos et al., 2007, 2009). In the current study, VLPFC neurons responded to an asynchronous face–vocalization movie with a change in response magnitude, which was typically suppression. This confirms the importance of timing of unisensory components for the prefrontal cortex and other areas involved in complex processing just as it has been shown for the processing of simpler stimuli in the superior colliculus (Meredith et al., 1987).
A number of studies have now examined the importance of temporal coincidence or the synchronous occurrence of the unisensory components of more complex audiovisual stimuli, including speech and gestures. Temporal coincidence and congruency are thought to underlie the successful merging of crossmodal stimuli into a coherent perceptual representation (Senkowski et al., 2007). Temporal coincidence of cross-modal stimuli can even override a spatial discrepancy, as seen in the Ventriloquist effect (Bertelson and Radeau, 1981). While the temporal synchrony of audiovisual speech stimuli is important for perceptual fusion (Dixon and Spitz, 1980; Munhall et al., 1996; de Gelder and Bertelson, 2003; Macaluso et al., 2004) there is some tolerance to small amounts of asynchrony. In typical human speech, the audible, auditory component lags behind the onset of the movement of the lips. Tolerance to a small amount of asynchrony in human speech may be partly due to the fact that the mouth movement and vocal signal share a common referent when speech stimuli are matched (congruent) compared to when the mouth movement and vocalization are mismatched (incongruent) (Vatakis and Spence, 2007) or are not speech stimuli (Vatakis et al., 2008). As a result, perceptual fusion of the two related crossmodal stimuli can be perceived at larger spatiotemporal disparities. Perturbations of facial and vocalization temporal synchrony that exceeds this tolerance can alter the percept of a speech stimulus (Munhall et al., 1996; van Wassenhove et al., 2007; Miller and D’Esposito, 2005). Perception of asynchronous audio-visual speech stimuli has been shown to activate a number of brain regions including the STS and the ventral frontal lobe (Bushara et al., 2001; Miller and D’Esposito, 2005; Stevenson et al., 2010). Miller and D’Esposito (2005) found that subject-reported un-fused speech–gesture stimuli resulted in increased activation in ventral prefrontal regions, while fused percepts resulted in decreased activation in prefrontal areas. This may have resulted from the increased attention that temporally asynchronous stimuli evoke or from the enhanced effort of comprehension that is necessary to understand temporally offset speech stimuli (Munhall et al., 1996; van Wassenhove et al., 2007). In the current study a subset of VLPFC neurons gave a similar response and were enhanced by asynchronous stimuli. Other neuroimaging studies of asynchronous speech stimuli have noted a decrease in activity in most cortical areas (Calvert, 2001), which is in agreement with the findings presented here where more VLPFC neurons were suppressed by asynchronous stimuli. The exact conditions which result in VLPFC multisensory suppression or enhancement are not yet clear and are in need of further study.
In the current study, we recorded from single prefrontal neurons while non-human primates were presented with asynchronous face–vocalization stimuli. We hypothesized that the decrease in speech intelligibility and decreased comprehension that have been noted in human studies of asynchronous speech stimuli, could be due to a decrease or change in ventral frontal lobe neuronal activity. Our results, that asynchronous face–vocalization movies evoke significant decreases or increases in the neuronal response of VLPFC multisensory neurons, is in agreement with this hypothesis. Moreover, VLPFC neurons more frequently showed a significant change in response magnitude than in response latency to the asynchronous stimuli. This sensitivity to stimulus asynchrony may be indicative of the neuron’s ability to integrate carefully timed inputs into a fused percept, rather than to merely register a change in the onset time of one component of a bimodal stimulus. If an intended bimodal transmission was somehow made asynchronous, due to external stimulus events or due to a lag in processing time within the brain, neuronal transmission might fail and the communication message would not be perceived accurately. The change in neuronal response to asynchronous stimuli in VLPFC neurons may underlie this failed transmission and the reduced comprehension that is seen with asynchronous communication stimuli. Hence, the fidelity in the transmission of synchronous audiovisual communication stimuli may be crucial for optimum integration by prefrontal neurons.
Fig. 6.
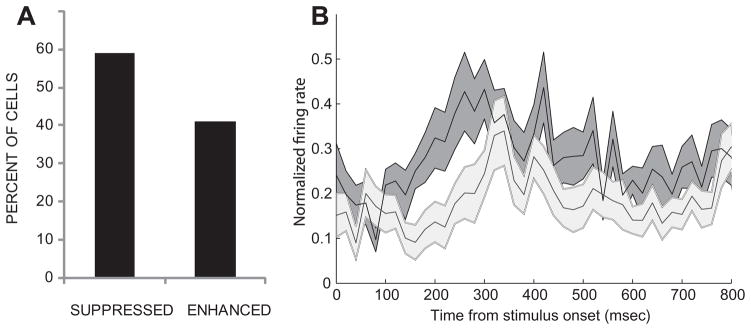
Effects of asynchronous stimuli on prefrontal cells. In A, the bar graph depicts the percent of multisensory cells which exhibited suppression (n=20/35 cells) or enhancement (n=15/35 cells) in response to the Asynchronous face–vocalization stimulus. In B, the neuronal response to synchronous (AVm, dark gray) and asynchronous (Async, light gray) audiovisual stimuli is shown as the normalized and averaged SDF (±SEM) from the responses of (n=18) multisensory neurons which had a response to the Async stimulus.
Acknowledgments
The authors would like to thank Mark Diltz for his technical assistance in the execution of the experiments and assistance with programming; DinaJo Knoedl for assistance with animal care; and Drs. Christos Constantinidis, William O’Neill, Maria Diehl and Laura Silverman for their helpful comments on the manuscript.
This work was supported by grants to L.M.R. from Cure Autism Now, NIH/NIDCD and the Schmitt Foundation for Integrative Brain Research.
Abbreviations
- A
auditory
- AVs
auditory plus static visual image
- AVm
audio-visual dynamic movie
- Async
asynchronous audio-visual movie
- ISI
inter-spike interval
- SDF
spike density function
- SD
standard deviation
- SOA
stimulus onset asynchrony
- SI
surprise index
- VLPFC
ventrolateral prefrontal cortex
- Vm
dynamic visual movie stimulus
- Vs
visual–static face
References
- Barraclough NE, Xiao D, Baker CI, Oram MW, Perrett DI. Integration of visual and auditory information by superior temporal sulcus neurons responsive to the sight of actions. J Cogn Neurosci. 2005;17:377–391. doi: 10.1162/0898929053279586. [DOI] [PubMed] [Google Scholar]
- Baylis GC, Rolls ET, Leonard CM. Selectivity between faces in the responses of a population of neurons in the cortex in the superior temporal sulcus of the monkey. Brain Res. 1985;342:91–102. doi: 10.1016/0006-8993(85)91356-3. [DOI] [PubMed] [Google Scholar]
- Bell AH, Meredith MA, Van Opstal AJ, Munoz DP. Crossmodal integration in the primate superior colliculus underlying the preparation and initiation of saccadic eye movements. J Neurophysiol. 2005;93:3659–3673. doi: 10.1152/jn.01214.2004. [DOI] [PubMed] [Google Scholar]
- Bertelson P, Aschersleben G. Temporal ventriloquism: crossmodal interaction on the time dimension. 1. Evidence from auditory-visual temporal order judgment. Int J Psychophysiol. 2003;50(1–2):147–155. doi: 10.1016/s0167-8760(03)00130-2. [DOI] [PubMed] [Google Scholar]
- Bertelson P, Radeau M. Cross-modal bias and perceptual fusion with auditory-visual spatial discordance. Percept Psychophys. 1981;29:578–584. doi: 10.3758/bf03207374. [DOI] [PubMed] [Google Scholar]
- Bushara KO, Grafman J, Hallett M. Neural correlates of auditory-visual stimulus onset asynchrony detection. J Neurosci. 2001;21:300–304. doi: 10.1523/JNEUROSCI.21-01-00300.2001. [DOI] [PMC free article] [PubMed] [Google Scholar]
- Calvert GA. Crossmodal processing in the human brain: insights from functional neuroimaging studies. Cereb Cortex. 2001;11:1110–1123. doi: 10.1093/cercor/11.12.1110. [DOI] [PubMed] [Google Scholar]
- Cappe C, Thut G, Romei V, Murray MM. Auditory-visual multisensory interactions in humans: timing, topography, directionality, and sources. J Neurosci. 2010;30:12572–12580. doi: 10.1523/JNEUROSCI.1099-10.2010. [DOI] [PMC free article] [PubMed] [Google Scholar]
- De Gelder B, Bertelson P. Multisensory integration, perception and ecological validity. Trends Cogn Sci. 2003;7(10):460–467. doi: 10.1016/j.tics.2003.08.014. [DOI] [PubMed] [Google Scholar]
- Dixon NF, Spitz L. The detection of auditory visual desynchrony. Perception. 1980;9(6):719–721. doi: 10.1068/p090719. [DOI] [PubMed] [Google Scholar]
- Driver J. Enhancement of selective listening by illusory mislocation of speech sounds due to lip-reading. Nature. 1996;381:66–68. doi: 10.1038/381066a0. [DOI] [PubMed] [Google Scholar]
- Ghazanfar AA, Maier JX, Hoffman KL, Logothetis NK. Multisensory integration of dynamic faces and voices in rhesus monkey auditory cortex. J Neurosci. 2005;25:5004–5012. doi: 10.1523/JNEUROSCI.0799-05.2005. [DOI] [PMC free article] [PubMed] [Google Scholar]
- Gouzoules S, Gouzoules H, Marler P. Rhesus monkey (Macaca mulatta) screams: representational signaling in the recruitment of agonistic aid. Anim Behav. 1984;32:183–193. [Google Scholar]
- Gothard KM, Erickson CA, Amaral DG. How do rhesus monkeys (Macaca mulatta) scan faces in a visual paired comparison task? Anim Cogn. 2004;2004(7):25–36. doi: 10.1007/s10071-003-0179-6. [DOI] [PubMed] [Google Scholar]
- Hauser MD, Marler P. Food associated calls in rhesus macaques (Macaca mulatta) I. Socioecological factors. Behav Ecol. 1993;4:194–205. [Google Scholar]
- Hanes DP, Thompson KG, Schall JD. Relationship of presaccadic activity in frontal eye field and supplementary eye field to saccade initiation in macaque: Poisson spike train analysis. Exp Brain Res. 1995;103(1):85–96. doi: 10.1007/BF00241967. [DOI] [PubMed] [Google Scholar]
- Kayser C, Logothetis NK, Panzeri S. Visual enhancement of the information representation in auditory cortex. Curr Biol. 2010;20:19–24. doi: 10.1016/j.cub.2009.10.068. [DOI] [PubMed] [Google Scholar]
- Kikuchi Y, Lawson M, Horwitz B, Mishkin M, Rauschecker JP. Society for Neuroscience Abstracts. 2009. Neuronal representation of harmonics in monkey auditory cortex. [Google Scholar]
- Lakatos P, Chen CM, O’Connell MN, Mills A, Schroeder CE. Neuronal oscillations and multisensory interaction in primary auditory cortex. Neuron. 2007;53:279–292. doi: 10.1016/j.neuron.2006.12.011. [DOI] [PMC free article] [PubMed] [Google Scholar]
- Lakatos P, O’Connell MN, Barczak A, Mills A, Javitt DC, Schroeder CE. The leading sense: supramodal control of neurophysiological context by attention. Neuron. 2009;64(3):419–430. doi: 10.1016/j.neuron.2009.10.014. [DOI] [PMC free article] [PubMed] [Google Scholar]
- Lee J, Williford T, Maunsell JH. Spatial attention and the latency of neuronal responses in macaque area V4. J Neurosci. 2007;27(36):9632–9637. doi: 10.1523/JNEUROSCI.2734-07.2007. [DOI] [PMC free article] [PubMed] [Google Scholar]
- Legendy CR, Salcman M. Bursts and recurrences of bursts in the spike trains of spontaneously active striate cortex neurons. J Neurophysiol. 1985;53(4):926–939. doi: 10.1152/jn.1985.53.4.926. [DOI] [PubMed] [Google Scholar]
- Macaluso E, George N, Dolan R, Spence C, Driver J. Spatial and temporal factors during processing of audiovisual speech: a PET study. Neuroimage. 2004;21(2):725–732. doi: 10.1016/j.neuroimage.2003.09.049. [DOI] [PubMed] [Google Scholar]
- Massaro DW, Cohen MM, Smeele PM. Perception of asynchronous and conflicting visual and auditory speech. J Acoust Soc Am. 1996;100:1777–1786. doi: 10.1121/1.417342. [DOI] [PubMed] [Google Scholar]
- McGurk H, MacDonald J. Hearing lips and seeing voices. Nature. 1976;264(5588):746–748. doi: 10.1038/264746a0. [DOI] [PubMed] [Google Scholar]
- Meredith MA, Nemitz JW, Stein BE. Determinants of multisensory integration in superior colliculus neurons. I. Temporal factors. J Neurosci. 1987;7:3215–3229. doi: 10.1523/JNEUROSCI.07-10-03215.1987. [DOI] [PMC free article] [PubMed] [Google Scholar]
- Miller LM, D’Esposito M. Perceptual fusion and stimulus coincidence in the cross-modal integration of speech. J Neurosci. 2005;25:5884–5893. doi: 10.1523/JNEUROSCI.0896-05.2005. [DOI] [PMC free article] [PubMed] [Google Scholar]
- Munhall KG, Gribble P, Sacco L, Ward M. Temporal constraints on the McGurk effect. Percept Psychophys. 1996;58(3):351–362. doi: 10.3758/bf03206811. [DOI] [PubMed] [Google Scholar]
- Musacchia G, Schroeder CE. Neuronal mechanisms, response dynamics and perceptual functions of multisensory interactions in auditory cortex. Hear Res. 2009;258:72–79. doi: 10.1016/j.heares.2009.06.018. [DOI] [PMC free article] [PubMed] [Google Scholar]
- O’Scalaidhe SP, Wilson FAW, Goldman-Rakic PS. Areal segregation of face-processing neurons in prefrontal cortex. Science. 1997;278:1135–1138. doi: 10.1126/science.278.5340.1135. [DOI] [PubMed] [Google Scholar]
- O’Scalaidhe SP, Wilson FAW, Goldman-Rakic PS. Face-selective neurons during passive viewing and working memory performance of rhesus monkeys: Evidence for intrinsic specialization of neuronal coding. Cereb Cortex. 1999;9:459–475. doi: 10.1093/cercor/9.5.459. [DOI] [PubMed] [Google Scholar]
- Partan SR. Single and multichannel signal composition: facial expressions and vocalizations of rhesus macaques (Macaca mulatta) Behaviour. 2002;139:993–1028. [Google Scholar]
- Petrides M, Pandya DN. Comparative cytoarchitectonic analysis of the human and the macaque ventrolateral prefrontal cortex and corticocortical connection patterns in the monkey. Eur J Neurosci. 2002;16:291–310. doi: 10.1046/j.1460-9568.2001.02090.x. [DOI] [PubMed] [Google Scholar]
- Preuss TM, Goldman-Rakic PS. Myelo- and cytoarchitecture of the granular frontal cortex and surrounding regions in the strepsirhine primate Galago and the anthropoid primate Macaca. J Comp Neurol. 1991;310:429–474. doi: 10.1002/cne.903100402. [DOI] [PubMed] [Google Scholar]
- Rolls ET, Critchley HD, Browning AS, Inoue K. Face-selective and auditory neurons in the primate orbitofrontal cortex. Exp Brain Res. 2006;170(1):74–87. doi: 10.1007/s00221-005-0191-y. [DOI] [PubMed] [Google Scholar]
- Romanski LM. Representation and integration of auditory and visual stimuli in the primate ventral lateral prefrontal cortex. Cereb Cortex. 2007;17(Suppl 1):i61–i69. doi: 10.1093/cercor/bhm099. [DOI] [PMC free article] [PubMed] [Google Scholar]
- Romanski LM, Averbeck BB, Diltz M. Neural representation of vocalizations in the primate ventrolateral prefrontal cortex. J Neurophysiol. 2005;93(2):734–747. doi: 10.1152/jn.00675.2004. [DOI] [PubMed] [Google Scholar]
- Romanski LM, Bates JF, Goldman-Rakic PS. Auditory belt and parabelt projections to the prefrontal cortex in the rhesus monkey. J Comp Neurol. 1999a;403:141–157. doi: 10.1002/(sici)1096-9861(19990111)403:2<141::aid-cne1>3.0.co;2-v. [DOI] [PubMed] [Google Scholar]
- Romanski LM, Diehl MM. Neurons responsive to face-view in the primate ventrolateral prefrontal cortex. Neuroscience. 2011;189:223–235. doi: 10.1016/j.neuroscience.2011.05.014. [DOI] [PMC free article] [PubMed] [Google Scholar]
- Romanski LM, Goldman-Rakic PS. An auditory domain in primate prefrontal cortex. Nat Neurosci. 2002;5:15–16. doi: 10.1038/nn781. [DOI] [PMC free article] [PubMed] [Google Scholar]
- Romanski LM, Tian B, Fritz J, Mishkin M, Goldman-Rakic PS, Rauschecker JP. Dual streams of auditory afferents target multiple domains in the primate prefrontal cortex. 1999b;2:1131–1136. doi: 10.1038/16056. [DOI] [PMC free article] [PubMed] [Google Scholar]
- Rosenkilde CE, Bauer RH, Fuster JM. Single cell activity in ventral prefrontal cortex of behaving monkeys. Brain Res. 1981;209:375–394. doi: 10.1016/0006-8993(81)90160-8. [DOI] [PubMed] [Google Scholar]
- Ross LA, Saint-Amour D, Leavitt VM, Javitt DC, Foxe JJ. Do you see what I am saying? Exploring visual enhancement of speech comprehension in noisy environments. Cereb Cortex. 2007;17:1147–1153. doi: 10.1093/cercor/bhl024. [DOI] [PubMed] [Google Scholar]
- Rowland BA, Quessy S, Stanford TR, Stein BE. Multisensory integration shortens physiological response latencies. J Neurosci. 2007;27(22):5879–5884. doi: 10.1523/JNEUROSCI.4986-06.2007. [DOI] [PMC free article] [PubMed] [Google Scholar]
- Russ BE, Ackelson AL, Baker AE, Cohen YE. Coding of auditory-stimulus identity in the auditory non-spatial processing stream. J Neurophysiol. 2008;99(1):87–95. doi: 10.1152/jn.01069.2007. [DOI] [PMC free article] [PubMed] [Google Scholar]
- Schroeder CE, Lakatos P, Kajikawa Y, Partan S, Puce A. Neuronal oscillations and visual amplification of speech. Trends Cogn Sci. 2008;12(3):106–113. doi: 10.1016/j.tics.2008.01.002. [DOI] [PMC free article] [PubMed] [Google Scholar]
- Senkowski D, Talsma D, Grigutsch M, Herrmann CS, Woldorff MG. Good times for multisensory integration: effects of the precision of temporal synchrony as revealed by gamma-band oscillations. Neuropsychologia. 2007;45(3):561–571. doi: 10.1016/j.neuropsychologia.2006.01.013. [DOI] [PubMed] [Google Scholar]
- Stein BE, Meredith MA. The merging of the senses. Cambridge: MIT Press; 1993. [Google Scholar]
- Stevenson RA, Altieri NA, Kim S, Pisoni DB, James TW. Neural processing of asynchronous audiovisual speech perception. Neuroimage. 2010;49:3308–3318. doi: 10.1016/j.neuroimage.2009.12.001. [DOI] [PMC free article] [PubMed] [Google Scholar]
- Sugihara T, Diltz MD, Averbeck BB, Romanski LM. Integration of auditory and visual communication information in the primate ventrolateral prefrontal cortex. J Neuroscience. 2006;26:11138–11147. doi: 10.1523/JNEUROSCI.3550-06.2006. [DOI] [PMC free article] [PubMed] [Google Scholar]
- Tsao DY, Schweers N, Moeller S, Freiwald WA. Patches of face-selective cortex in the macaque frontal lobe. Nat Neurosci. 2008;11:877–879. doi: 10.1038/nn.2158. [DOI] [PMC free article] [PubMed] [Google Scholar]
- van Atteveldt NM, Formisano E, Blomert L, Goebel R. The effect of temporal asynchrony on the multisensory integration of letters and speech sounds. Cereb Cortex. 2007;17:962–974. doi: 10.1093/cercor/bhl007. [DOI] [PubMed] [Google Scholar]
- van Wassenhove V, Grant KW, Poeppel D. Temporal window of integration in auditory-visual speech perception. Neuropsychologia. 2007;45(3):598–607. doi: 10.1016/j.neuropsychologia.2006.01.001. [DOI] [PubMed] [Google Scholar]
- Vatakis A, Ghazanfar AA, Spence C. Facilitation of multisensory integration by the “unity effect” reveals that speech is special. J Vis. 2008;8(9):14.1–1411. doi: 10.1167/8.9.14. [DOI] [PubMed] [Google Scholar]
- Vatakis A, Spence C. Crossmodal binding: evaluating the “unity assumption” using audiovisual speech stimuli. Percept Psychophys. 2007;69(5):744–756. doi: 10.3758/bf03193776. [DOI] [PubMed] [Google Scholar]