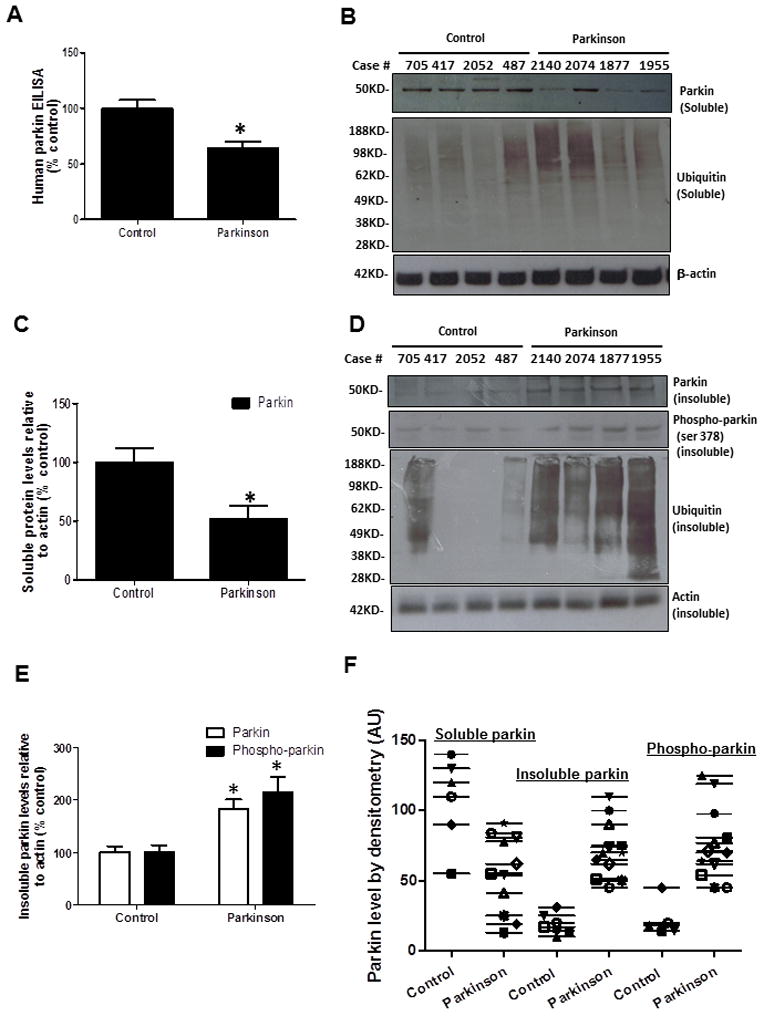
Figure 1. Parkin is insoluble in post-mortem striatum of human PD patients.

A). Histograms represent ELISA measurement of human parkin in the caudate of PD patients and control subjects. B). WB analysis on 4–12% SDS-NuPAGE gel of soluble human post-mortem striatal lysates in PD patients and control subjects, showing parkin (1st blot) and ubiquitinated proteins (2nd blot) compared to actin loading control. C). Histograms represent quantification of blots. D). WB analysis on 4–12% SDS NuPAGE gel showing the levels of insoluble parkin (1st blot), phospho-parkin (2nd blot), ubiquitinated proteins (3rd blot), and actin (4th blot). E). Histograms represent quantification of blots. Asterisks indicate significantly different. F). Box plot represents individual samples of human PD patients and age-matched controls. Histograms are mean±SD expressed as % to control. ANOVA, Neumann Keuls with multiple comparison, or non-parametirc t-Test. P<0.05. N=12 PD patients and 7 control subjects.
