

Abstract
Part- and whole-task conditions were created by manipulating the presence of certain components of the Space Fortress video game. A cognitive model was created for two-part games that could be combined into a model that performed the whole game. The model generated predictions both for behavioral patterns and activation patterns in various brain regions. The activation predictions concerned both tonic activation that was constant in these regions during performance of the game and phasic activation that occurred when there was resource competition. The model’s predictions were confirmed about how tonic and phasic activation in different regions would vary with condition. These results support the Decomposition Hypothesis that the execution of a complex task can be decomposed into a set of information-processing components and that these components combine unchanged in different task conditions. In addition, individual differences in learning gains were predicted by individual differences in phasic activation in those regions that displayed highest tonic activity. This individual difference pattern suggests that the rate of learning of a complex skill is determined by capacity limits.
INTRODUCTION
A basic assumption in many information-processing approaches to cognition is that tasks can be decomposed into sets of primitive mental operations. Although hardly unchallenged, this serves as the basis for the additive factors approach to the study of RT (Roberts & Sternberg, 1993; Sternberg, 1969) and various methodologies for interpreting neuroimaging research (Amaro & Barker, 2006; Friston, 2006; Sidtis, Strother, Anderson, & Rottenberg, 1999). Extending this idea to complex tasks, Anderson (2002) articulated the Decomposition Hypothesis that competences like those taught in mathematics or those involved in dynamic tasks like air traffic control could be decomposed into sets of primitive mental operations. We have obtained evidence for this, using measures such as latency (e.g., Anderson et al., 2004), eye movements (e.g., Lee & Anderson, 2001), neural imaging (e.g., Anderson, 2005), and learning rates (e.g., Corbett, Anderson, & O’Brien, 1995). We have also developed ACT-R (Anderson, 2007; Anderson et al., 2004), a theory of cognition that incorporates this hypothesis, and used the decomposition assumption to map the activity of various modules in ACT-R onto the activity in specific brain regions.
In the light of the evidence for the Decomposition Hypothesis, it might seem striking that there has been such spotty evidence for the success of part-to-whole transfer in training of complex tasks (van Merriënboer, 1997; Hodge et al., 1995; Adams, 1987; Naylor & Briggs, 1963). It would seem that one should be able to isolate the specific components of a complex skill and train these separately. Failure of a part task to transfer to a whole task can be seen as an instance of the failure of pure insertion (Donders, 1869), the idea that one process can be simply omitted or added to a larger process without changing anything else in the larger process. However, when there is such a failure, the question remains of whether this is because the Decomposition Hypothesis is wrong (i.e., the whole is truly more than the sum of its parts) or because an informal task decomposition led to the wrong identification of part tasks (i.e., they were not actually parts of the whole). To test the viability of the Decomposition Hypothesis, one needs a rigorous model of the tasks that identifies the components and how they participate in the various part and whole tasks. Then one could determine whether a componential approach can predict the performance in both the part tasks and the whole tasks.
This article takes the first step in this direction, testing whether a model-based approach can predict the relationship between part-task performance and whole-task performance. We will not only attempt to predict the behavioral patterns, but also the neural signatures of a complex task and part tasks constructed out of it. The task is the Space Fortress video game, developed by Donchin and colleagues and first used in the 1980s by a wide consortium of researchers (e.g., Donchin, 1989; Frederiksen & White, 1989; Gopher, Weil, & Siegel, 1989). Figure 1 shows a schematic of the Space Fortress video game. The player is supposed to try to keep a ship flying between the two hexagons. This is challenging because the ship is flying in a frictionless space and so there is no braking system for navigation. Thus, to navigate the player must combine thrusts in various directions to achieve the circular orbit. While doing so, they need to shoot at the fortress and avoid being shot by it. In addition, the player must deal with mines that appear at regular intervals. Critical to processing the mines is a distinction between “foe” and “friendly” mines, which require different processing and must be properly identified by a set of letters that appear under Identify Friend or Foe (IFF) in the bottom (before each game, the player learns three letters that will indicate foe mines for that game). Finally, potential bonus symbols appear on the screen below the fortress. If two dollar signs appear in a row, the player can request bonus points or ammunition.
Figure 1.
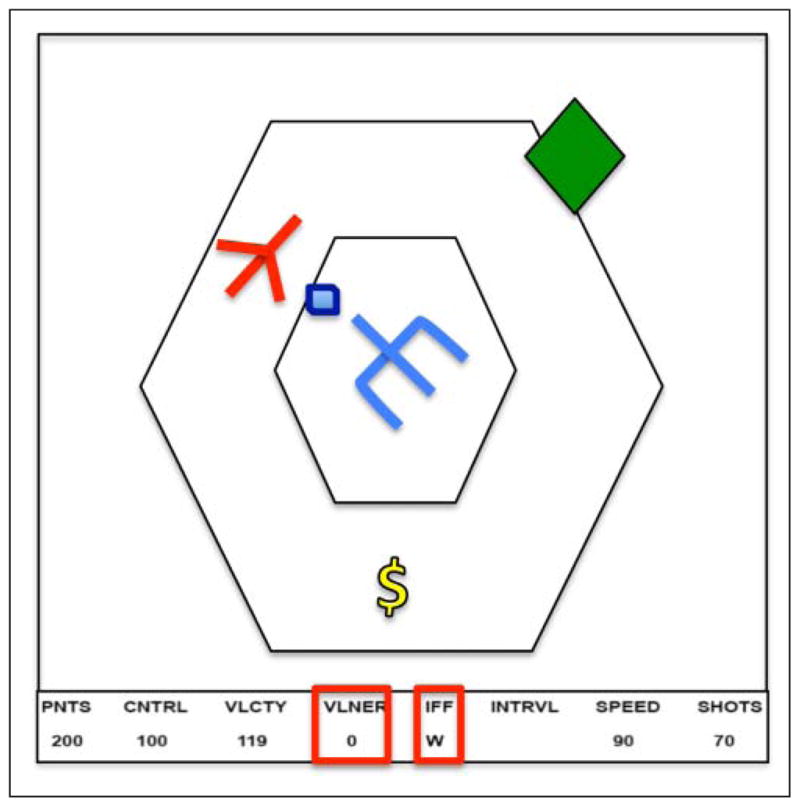
A schematic of the screen for Space Fortress. The ship (indicated in red) is controlled by the user and must circle the fortress (in blue) staying within the two hexagons. The hexagon (in green) represents a mine coming at the ship. At the bottom of the screen is an information bar that displays critical information. The red highlighted vulnerability information keeps track of the number of times the fortress has been hit and the highlighted IFF information contains a letter that identifies whether the mine is friend or foe. The dollar sign (yellow) is one of a sequence of symbols that must be tracked for bonus points.
The player interacts with the ship by pressing six keys with their ring, middle, and index fingers on both hands.1 The left hand uses the three keys involved in ship control—they turn clockwise, counterclockwise, and thrust. The left hand needs to master the correct execution of thrusts and turns to maintain a circular orbit in the frictionless space. The right hand controls the firing and response to various critical information events. Timing of right-hand keys is particularly important. Shots at the fortress must satisfy a number of timing constraints—at least 250 msec between shots up until the fortress is vulnerable for a “kill shot,” which requires a pair of shots under 250 msec. Identification of foe mines requires a double click with another right-hand finger and must be between 250 and 400 msec.
The players are trying to optimize their point totals, which is a sum of points for navigating, processing the fortress, processing the mines, and responding to the bonus opportunities (see the Appendix for the point structure). Because of the game’s complexity, it is natural to try to train parts of the task separately. Two of the original regimens for training involved alternative approaches to this. Frederiksen and White’s (1989) Hierarchical Part-Task Method explicitly trained part tasks, whereas Gopher et al.’s (1989) Emphasis Change Method emphasized different parts of the game at different times but participants always played the full game. Gopher, Weil, and Bareket (1994) argued that the success of their procedure depended on the fact that it did not isolate the parts. There have been a number of efforts in which participants were explicitly trained to perform only certain components of the whole task. For instance, in the team training research (Shebilske, Regian, Arthur, & Jordan, 1992), one participant was responsible for navigation and handling the fortress, whereas another participant was assigned responsibility for other aspects of the game. The research to be reported here will use a somewhat related task decomposition.
There is now a substantial literature on the impact of video game playing on basic cognitive and psychomotor skills (e.g., Spence & Feng, 2010; Boot, Kramer, Simons, Fabiani, & Gratton, 2008; Green & Bavelier, 2008; Ferguson, 2007). To really understand the basis of these effects, one needs to understand in detail the cognitive processes involved in the performance of these games but their complexity makes such an understanding very difficult to achieve. Unlike most video games, Space Fortress is just simple enough that cognitive models have been produced capable of simulating human performance in detail. Thus, Space Fortress offers the opportunity to bring precise task analysis to bear on understanding the effects of video games.
The principal goal of this research will be to test the Decomposition Hypothesis by seeing whether it can predict performance when different parts of a complex task are isolated and when they are combined. Table 1 shows the four conditions of the experiment. Unlike most part-task approaches to Space Fortress, in this study all tasks include navigation. In the Orbit condition, this is all participants have to do and they receive points for keeping the ship within the hexagon at appropriate speeds. The Mines-Only condition adds the processing of mines and the participants receive additional points for successfully destroying mines and lose points if the mine destroys them. The Fortress-Only condition adds the processing of the Fortress to the Orbit condition, and participants receive additional points for destroying the fortress and loose points if the fortress shoots them. The Both condition is the original Space Fortress game, and participants are able to get points for all three—navigation, mines, and fortress. As Table 1 illustrates, these conditions are in a 2 × 2 factorial design where the factors are the presence of mines and the presence of the fortress.
Table 1.
Different Game Conditions
| No Mines Present | Mines Present | |
|---|---|---|
| No fortress present | Orbit | Mines-Only |
| Fortress present | Fortress-Only | Both |
Bothell (2010) has developed a model in the ACT-R architecture (Anderson, 2007; Anderson et al., 2004) that was capable of performing the task.2 The model was tuned to fit the behavioral results in the Fortress-Only and Mine-Only conditions. The same components can be deployed to perform the task when neither mines nor fortress are present (the Orbit condition) and when both are present (Both condition). Thus, a test of the Decomposition Hypothesis is how well the model matches behavior in the Orbit and Both conditions, given that it was tuned to the other two conditions. Furthermore, the mapping between components in the ACT-R architecture and brain regions (Anderson, Carter, Fincham, Ravizza, & Rosenberg-Lee, 2008; Anderson, Fincham, Qin, & Stocco, 2008; Anderson, 2007) enables predictions about the activity in these regions. The more demanding test of the Decomposition Hypothesis is how well the model matches the patterns of brain activity in all of the conditions, because the model was not tuned to fit the imaging data in any condition. We conceive of this as more of a test of the Decomposition Hypothesis than of the ACT-R theory per se, because it seems likely that many fully specified models based on the Decomposition Hypothesis would make similar predictions. Nonetheless, the ACT-R model provides a rigorous way to derive these predictions.
The ACT-R architecture consists of a set of modules (not to be confused with a model that specified how the modules interact in a task), which are active in parallel to perform a complex task like this video game. Figure 2A illustrates the modules of relevance to the model for Space Fortress, and Figure 2B illustrates how they are deployed in the 2 sec after a mine appears. During this 2 sec, the visual module is encoding the letter to identify the mine; the imaginal module determines how to aim at the mine, the goal module switches focus from processing a fortress to processing the mine, the declarative module retrieves information about the letters that identify a foe, and the manual module is executing the double tap needed to enable a shot at the foe mine. The coordination of these modules is controlled by a set of production rules (procedural module), which respond to the state of modules and that make requests of various other modules. Although each of these modules can proceed in parallel with the other modules, activities within any module are executed serially. Critical to the model’s predictions are the occasions when different tasks make simultaneous demands on the modules. Such a period is illustrated in Figure 2B where the activities associated with the mine take precedence over the activities associated with the fortress because the mine is more time critical. This means that mine activities will block fortress activities in any module where they make simultaneous demands. There are many such conflicting demands during the approximately 2 sec that mines are on the screen. For instance, the left hand is no longer turning the ship to fly around the fortress, but rather aiming the ship to shoot the mine. At a more cognitive level, the imaginal module has given up tracking number of hits on the fortress to determine the aim at the mine.
Figure 2.

(A) The interaction of the ACT-R modules during the presentation of a mine. Beside each module is an example of its activity during this period. (B) A swimlane representation of the activity of the ACT-R modules during the 2 sec after a mine appears. Note that the manual module consists of left and right submodules.
We will postpone discussing detailed predictions from the model until the Results section, but here we describe two general categories of predictions that motivated the general design and analysis of the experiment. To test these predictions, we decomposed the brain imaging data into tonic activation when a mine is not present and phasic activation in response to appearance of a mine.
1. Predictions of Tonic Activation
Tonic activation can be viewed as a condition-specific baseline activation, which we predict to be considerably above baseline in rest periods. The model makes module-specific predictions about how much more tonic activation there should be in conditions when the fortress is present. However, it predicts that the presence of mines will have no affect on tonic activation in any module, because there is no module activity in anticipation of a mine’s appearance. This is a somewhat surprising prediction given that other research has shown that responsibility for one task can affect the performance of a second task (e.g., Salvucci & Taatgen, 2010; Schneider & Fisk, 1982). For instance, performance is often worse in task repetition blocks when switches could occur (Rubin & Meiran, 2005; Los, 1996). Such effects will only sometimes occur and, as Salvucci and Taatgen show, the way to determine when is by tracking the demands they make on various cognitive resources within a model.
2. Predictions of Phasic Activation
When the mines appear, they take precedence and module resources are devoted to them first. The model tries to dispose of the mine as quickly as possible and so there is increased demand on the modules. During any slack time, the model will also process the fortress. For instance, if the fortress temporarily blocks a shot at the mine, the model will continue to shoot at the fortress until the mine comes into line of sight. The net effect is that there is increased activity in many modules during the presence of mines. The model makes module-specific predictions about the increased activity produced by the appearance of a mine and for some modules predicts a subadditive interaction between Mine and Fortress factors. The subadditive prediction occurs when mine activity pushes out fortress activity. Then the net increase in activity in the Both condition will be less than in the Mines-Only condition, where fortress activity is not being replaced. For instance, in the Mines-Only condition the appearance of the mine will drive a major increase in imaginal activity over the Orbit condition to imagine the mine’s trajectory. Although there will be this same activity in the Both condition to track the mine, it will take away from some of the tracking of hits on the fortress, resulting in a smaller net increase.
METHODS
Participants
Twenty right-handed participants (8 women and 12 men, 18–29 years, mean = 23.6 years) were recruited from the Pittsburgh community. All had some video game experience, but it varied with five assessed as low, nine as medium, and six as high. They participated in a 5-day experiment in which they performed two 1-hr sessions on each day. The second session of the first and fifth day was performed in an fMRI magnet.
Experimental Procedure
In all sessions, participants responded with three fingers (ring, middle, and index) in two data gloves. The left hand was used for navigation with the ring finger controlling counterclockwise turns, the middle finger thrust, and the index finger clockwise turns. On the right hand, the index finger was for shooting, the middle finger for identifying foe mines, and the ring finger for collecting bonus points. In each session, they performed eight 2-game blocks. Figure 3 illustrates the structure of these blocks. There were 20-sec fixation periods at the beginning of the block, between games, and at the end of the block. Before each game, participants were given 10 sec to memorize the three letters that would be used to identify “foe” mines in that game. Then they were informed for 10 sec of the condition (Table 1) of the upcoming game. This was followed by a 3-min game. In mine conditions, the first mine came up after 10 sec, and an additional mine came up every 20 sec later. The first eight mines define eight 20-sec periods, which are used as the basic units of analysis. Even when mines were not present, we analyzed the data according to these 20-sec periods. Each game was followed by 10 sec of feedback in which they could see their score broken down into the categories of control, velocity, speed, and points. In a session, there were four games in each of the four conditions. Each game would appear once in random order in each quarter of a session.
Figure 3.
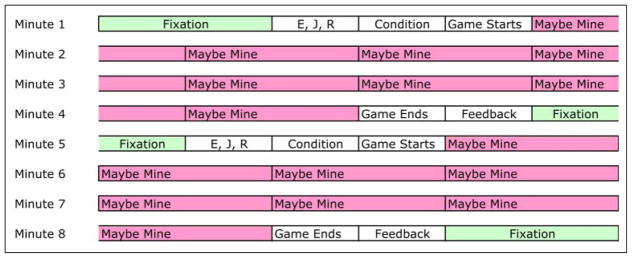
Allocation of time during an 8-min scanning block.
Imaging Analysis
Functional images were acquired using gradient EPI on a Siemens 3T Allegra Scanner (Brain Imaging Research Center, Pittsburgh, PA) using a standard radio frequency (RF) head coil (quadrature birdcage), with 2-sec repetition time, 30-msec echo time, 70° flip angle, and 20-cm field of view. The experiment acquired 34 axial slices on each repetition time using a 3.2-mm-thick, 64 × 64 matrix. Slices were acquired in interleaved order. The AC–PC line was on the eleventh slice from the bottom scan slice. Anatomical scans (34 slices) were acquired using a standard T1-weighted pulse sequence, with the middle of the eleventh slice from the bottom through the AC–PC line.
Acquired images were analyzed using the Neuroimaging Software system (kraepelin.wpic.pitt.edu/nis). Functional images were motion-corrected using a six-parameter 3-D registration (AIR; Woods, Grafton, Holmes, Cherry, & Mazziotta, 1998). All images were then coregistered to a common reference structural MRI by means of a 12-parameter 3-D registration and smoothed with a 6-mm FWHM 3-D Gaussian filter to accommodate individual differences in anatomy.
Bilateral regions of the secondary auditory cortex (regions 5 × 5 × 4 voxels centered at Talairach coordinates ±42, −61, −9) were identified. These correspond to the aural module in the ACT-R theory (Anderson, 2007). Because this module is not engaged in the Space Fortress model, activity in this brain region was used to identify brain-wide variations that were not task related (for instance, because of changes in breathing patterns; Birn, Smith, Jones, & Bandettini, 2008). Our analyses will be of the activity in other regions after regressing out the activity of this region. We regressed the full 8-min BOLD response in ROIs against the BOLD response in these reference regions. The corrected activity for an ROI was the residual BOLD response not predicted plus the mean BOLD signal in that region for that 8-min period. This does not change the direction of any of the effects but does increase the significance of many, giving more power to detect nonadditivity.
The average of the last six scans (12 sec) in each fixation period (Figure 3) were averaged to calculate a baseline. The baseline for any scan in the first game of a block was calculated as the linear trend between the first and second means and the baseline for the second game was calculated as the linear trend between the second and third means. The BOLD response on any game scan was calculated as its percent change from its baseline. Thus, the data used in all analysis is percent signal change. Note that there was no temporal smoothing beyond this baseline adjustment.
The imaging data were organized according to the 10-scan (20 sec) periods that were defined by the potential appearance of mines (see Figure 3). For each participant and each condition, we regressed the BOLD response on these scans with a hemodynamic profile that would be generated by activity occupying the first 2-sec scan (assuming the standard SPM hemodynamic response; Friston et al., 1998). This first 2 sec was of interest because it was approximately the time spent processing a mine when it did come up (see Figure 2B). This regression yields an intercept and a slope. The intercept corresponded to the activity throughout the 20-sec interval, whereas the slope corresponded to the extra activity evoked by processing the mine.3 We will refer to these as measures of tonic activity and phasic activity. We predict tonic activity will not be affected by the presence of a mine, whereas the phasic activity should show an effect of Mines. Furthermore, we predict the phasic activity will show subadditive interactions between Fortress and Mines in specific brain regions. This is because this is the only period when there is resource competition in the model (Figure 4).
Figure 4.
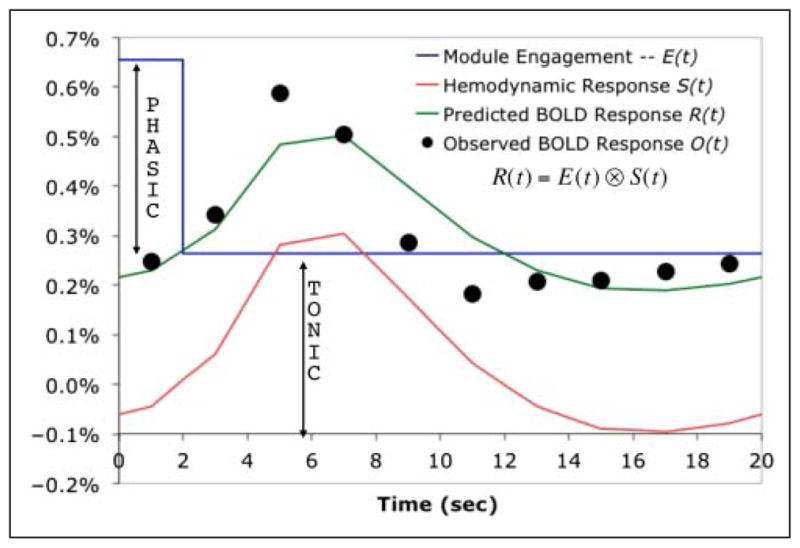
Extraction of phasic and tonic components from 20 sec of BOLD data. The module engagement E(t) is modeled as a boxcar consisting of a constant tonic engagement plus a phasic engagement during the first 2 sec. Convolving this with a hemodynamic response function S(t) would yield a predicted BOLD response R(t). By regressing the observed BOLD response O(t) against the hemodynamic function reflecting activity for the first 2 sec, one obtains an estimate of the tonic response as intercept and the phasic response as slope.
Much of the analyses will involve looking at activity in predefined regions of theoretical significance. However, to determine what other effects might be happening, we performed exploratory analyses on percent signal change, looking for regions that showed a significant interaction between Mines and Fortress for either tonic or phasic activity. Spatial F-maps were generated using random effects ANOVA. The threshold for significance for the interaction was at least 10 contiguous voxels at a voxel-wise alpha of p < .0001. Spatial smoothness of these data was computed over the residuals and used as input for simulation to estimate brain-wise alpha to be less than .01 (Cox & Hyde, 1997; Cox, 1996).
RESULTS
Behavioral
Figure 5 displays the total point score for participants and how this varied over sessions. All main effects and interactions were highly significant (at the .0001 level) except for the three-way interaction between Mines, Fortress, and Session, which was not significant (F(9, 171) = 0.80). Of particular relevance is the two-way interaction between Mines and Fortress (F(1, 19) = 106.87). This reflects the fact that the advantage of the Both condition over the Fortress-Only condition is less than the advantage of the Mines-Only condition over the Orbit condition, although both comparisons involve the same addition of mines. In the first session, the Both condition is actually below the other conditions reflecting the difficulty participants are having in putting it all together. However, the interaction is present during all sessions, including both scanner sessions (Session 2 with F(1, 19) = 28.20 and Session 10 with F(1, 19) = 33.87). The lack of a three-way interaction with Session is evidence that this effect does not substantially change over the course of the experiment. Note that the interaction occurs, although total possible points are additive—that is, Orbit + Both = Mines-Only + Fortress-Only for total possible points. The interaction reflects the fact that processing mines takes time away from accumulating fortress points. For instance, participants hit the fortress 10 fewer times per game in the Both condition than the Fortress only condition (t(19) = 3.86; p ~ .001).
Figure 5.

Total points earned per game as a function of Session for each condition. The Xs during Session 9 show the performance of the model. The maximum possible in the Orbit condition is 2275, which are awarded for maintaining good control and velocity. These same points are available in the other conditions. If the condition also involves mines, there is the potential for 4500 more points, but this total is not physically realizable because it would require instantaneous response. If the condition involves the fortress, there is approximately 12,000 more points possible, assuming participants could achieve perfect timing of keypresses.
In addition, it can be seen that participants reach near asymptote relatively rapidly in the Orbit and Mines-Only conditions, which do not involve the fortress, although they show continued improvement in the Fortress-Only and Both conditions, which they achieve by destroying more fortresses. Note that there is a dip in the last session reflecting a performance deficit often seen in scanner conditions. The score on Session 2 may also be depressed because of the scanner, but participants are on such a steep portion of the learning curve that performance still increases from Session 1 to Session 2. The figure also compares the performance of the model with participants on Session 9. We chose this day for comparison because the model is not a learning model but rather an expert model. Note that the model also predicts the subadditivity in points because it is also unable to gain points by shooting at the fortress while it is processing the mines.
Figure 6 shows the number of left-hand and right-hand keypresses in the four conditions and how they change over the course of the experiment. With respect to left keypresses that control navigation, there is no significant effect of Fortress (F(1, 19) = 0.16), a marginal negative effect of Mines (F(1, 19) = 4.23, p < .1), and no interaction (F(1, 19) = 0.02). Therefore, Figure 6 aggregates the conditions for the left-hand keys. There is a significant effect of Session on left-hand keys (F(9, 171) = 11.82, p < .001), which reflects a gradual increase plus the dips on the scanner Sessions 2 and 10. With respect to right-hand keypresses that control the response to Mines and Fortress, all main effects are significant: Mines (F(1, 19) = 4.49, p < .05), Fortress (F(1, 19) = 337.75, p < .0001), and Session (F(9, 171) = 23.65, p < .001). There is a highly significant interaction for right keypresses between Mines and Fortress (F(1, 19) = 16.73, p < .001) such that mines produce an extra 43 keypresses per game when there is no fortress (Mines-Only vs. Orbit) but actually 15 less keypresses when there is the fortress (Both vs. Fortress-Only). This was the expected interaction where processing of the mines is taking away from processing of the fortress. Note the sheer number of keypresses. In the Fortress and Both conditions, participants are averaging 1.5 keypresses per hand per second. This high rate of interaction is not unusual for video games.
Figure 6.
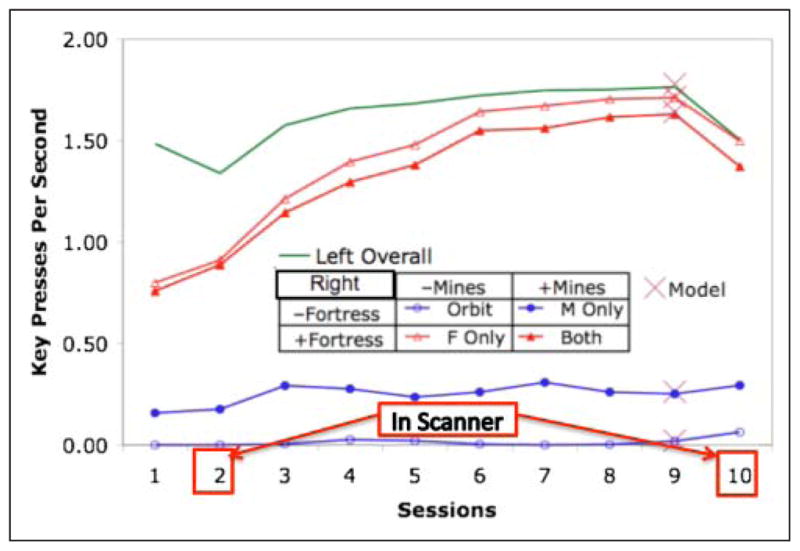
The overall mean number of left-hand keypresses and the mean number of right-hand keypresses for each of the conditions of the experiment. The Xs during Session 9 show the performance of the model.
Again note the predictions of the model for Session 9 in Figure 6. Although the model was only fit to the Mines-Only and Fortress-Only conditions, it predicts the number of keypresses for the other conditions. Its prediction of near-zero right-hand keypresses in the Orbit condition is not surprising, because there are no required right-hand activities in this condition. It also predicts the right-hand keypresses will be less in the Both condition than the Fortress-Only conditions. This is because the time it takes to process the mine (orient to hit, shoot, and return to an orbiting path around the fortress) takes away the opportunity for right-hand shots at the Fortress.
The model provides a relatively good fit to these behavioral measures and a good many others (see act-r.psy.cmu.edu/publications/pubinfo.php?id=974). This was done with default parameters in ACT-R with one notable exception. The default parameters were used because they have already been tuned to capture the general human perceptual and motor latencies. However, we had to estimate motor-timing parameters to control the duration that keys were held down and the variability in these times. The correct timing is critical to reproduce the circular orbits around the fortress while maintaining aim at the fortress. This basic navigation pattern is critical to success and characterized all participants. The variation from ideal timing allows us to capture the variability we saw in participants.
Imaging Data
The model makes predictions for the seven regions specified in Table 2 (all but ACC illustrated in Figure 7). Figure 8 shows the BOLD response for these regions as a function of the 10 scans that occupy a mine period (see Figure 3) and experimental condition. Reasonably, in conditions where mines do not appear the response is flat over scans, whereas all regions show some effect of scan when the mines are present. The mine appears at the beginning of the block of ten 2-sec scans. As described in the Methods section, we extracted two activity measures for each participant, each region, and each condition. The tonic measure is an estimate of activity throughout the 20 sec, and the phasic measure is an estimate of activity during the first 2 sec when participants were handling the mine. Because of the sluggish nature of the hemodynamic response, the effect of the phasic activity shows up as the rise in the BOLD response spread across a number of scans. For each region, we performed a repeated measure ANOVA on both the tonic and phasic activity, where the factors were Session, Mines, and Fortress (see Table 1). Table 2A provides the main effects for the tonic activity, and Table 2B for the phasic activity. Generally, the effects that are apparent in Figure 8 are statistically strong.
Table 2.
Coordinates and Statistics for Predefined Regions (see Figure 7)
| ROIs | Brodmann Area(s) | Talairach Coordinates (x,y,z) | Voxel Count | Sessions | Mines | Fort | Mines × Fort | Learn Corr | Magnitude |
|---|---|---|---|---|---|---|---|---|---|
| (A) Tonic Activity | |||||||||
| 1. L Motor | 1,2,3 | +41,20,50 | 100 | −0.35 | −0.71 | 8.65*** | 0.03 | 0.136 | 0.27% |
| 2. R Motor | 1,2,3 | −41,20,50 | 100 | −0.14 | −0.34 | 3.44** | −0.50 | 0.202 | 0.84% |
| 3. L,R ACC | 24,32 | ±7,10,39 | 120 | 2.76* | 0.18 | 5.32*** | −0.98 | 0.299 | 0.33% |
| 4. L,R PPC | 37,39 | ±23,−63,40 | 200 | −0.71 | 2.17* | 2.54 | 0.33 | 0.240 | 0.39% |
| 5. L,R LIPFC | 9,46 | ±43,23,24 | 200 | 1.54 | 1.81 | −0.11 | −2.3* | 0.107 | 0.00% |
| 6. L,R Caudate | – | ±14,10,7 | 128 | −0.01 | −1.19 | 1.99 | −0.86 | 0.155 | 0.16% |
| 7. L,R Fusiform | 37 | ±42,−61,−9 | 150 | 3.37** | 0.39 | 3.38** | −1.17 | 0.191 | 0.61% |
| (B) Phasic Activity | |||||||||
| 1. L Motor | 1,2,3 | +41,−20,50 | 100 | 3.88** | 12.5*** | −11.0*** | 9.42*** | 0.143 | 0.39% |
| 2. R Motor | 1,2,3 | −41,20,50 | 100 | −1.30 | 3.68** | −3.12 | 2.93 | 0.632** | 0.08% |
| 3. L,R ACC | 24,32 | ±7,10,39 | 120 | −0.79 | 12.6*** | −8.12*** | 8.47*** | 0.379 | 0.42% |
| 4. L,R PPC | 37,39 | ±23,−63,40 | 200 | 1.13 | 9.77*** | −2.30* | 2.32* | 0.503* | 0.31% |
| 5. L,R LIPFC | 9,46 | ±43,23,24 | 200 | 3.37** | 5.84*** | 3.64** | −3.0** | −0.045 | 0.16% |
| 6. L,R Caudate | – | ±14,10,7 | 128 | 0.25 | 6.99*** | −4.74*** | 3.49** | 0.046 | 0.18% |
| 7. L,R Fusiform | 37 | ±42,−61,−9 | 150 | 0.43 | 7.37*** | −2.72* | 4.42*** | 0.573** | 0.39% |
Sessions = t values for the main effect of Sessions (Session 2 minus Session 10); Mines = t values for the main effect of Mines (mine − no mine); Fort = t values for the main effects of Fortress (fortress minus no fortress); Mines × Fort = t values for interaction (Fortress + Mines minus Orbit −Both); Learn Corr = correlation of residual measure of learning gain with Session 2 activity (mean of all conditions for tonic activity, mean of Mines and Both for phasic activity); Magnitude = mean percent over 10 scans.
p < .05.
p < .01.
p < .001.
Figure 7.
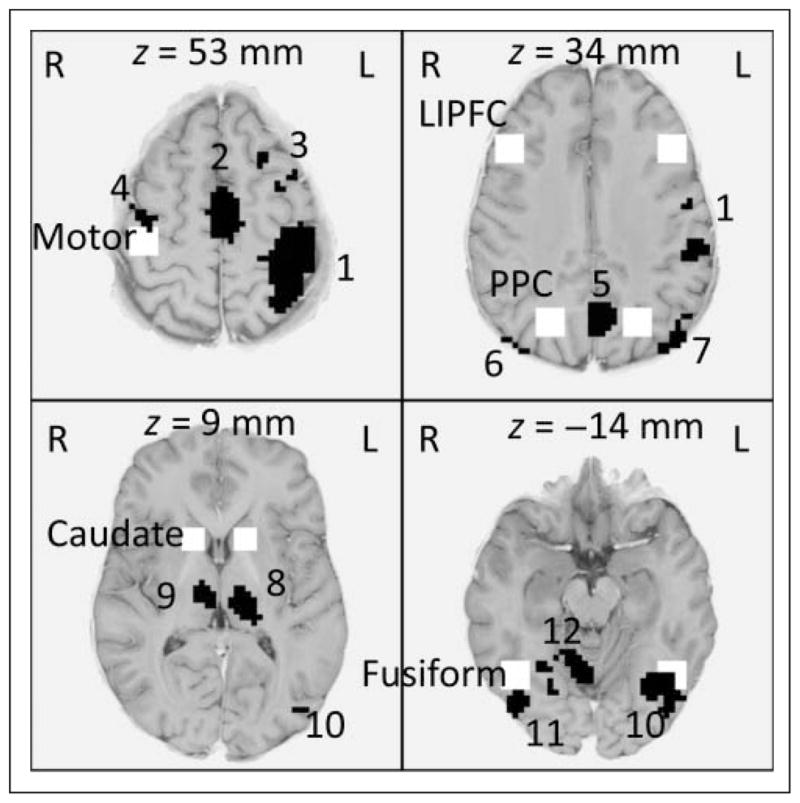
Predefined regions (white, named; Table 2) and exploratory regions (black, numbered; Table 3). The predefined ACC is between the first and second displayed slices. z Values for the slices (radiological convention: image left = participant’s right) are at x = y = 0 in Talairach coordinates.
Figure 8.
Percent change in the BOLD response in the predefined regions (see Figure 7) for the four conditions as a function of the ten 2-sec scans (marked on the x axis for each region) that begin with appearance of a mine (see Figure 3). Data are averaged over Sessions 2 and 10.
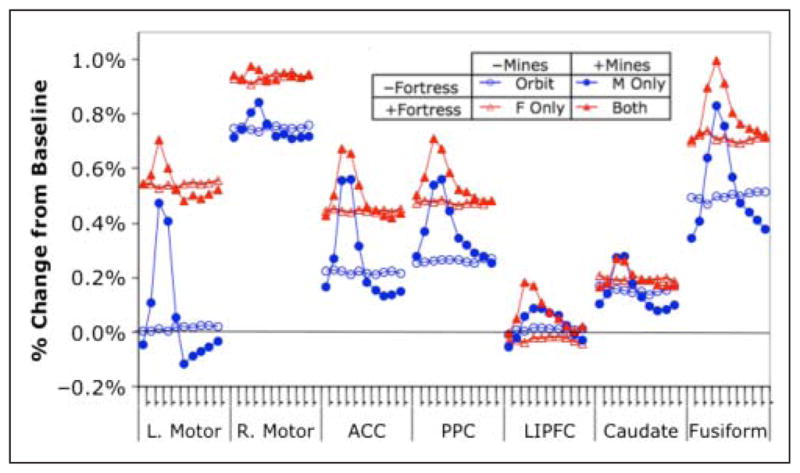
Figure 9 (A and B) shows the tonic and phasic activity for each condition in each region. According to the ACT-R model, these values reflect the proportion of time the ACT-R modules (see Figure 2) were engaged during each of the 20-sec periods after a mine appeared. The average engagement during the last 18 sec is reflected in the tonic activity. The difference between baseline and the activity in the first 2 sec is reflected in the phasic activity. Figure 9 (C and D) presents the proportion engagement of the model during these periods. The percent change in BOLD responses (Figure 9A and B) and the proportion of time engaged in the model are on different scales, and thus, we estimated region-specific multiplicative parameters to get Figure 9C and D.4 Certain predictions do not depend on these parameters because the parameters are just multipliers. In particular, whenever a module has zero engagement, there should be zero activity in the corresponding region. Within a region–module pair, the relative orderings of the conditions and their differences should be preserved. Finally, when the model predicts no difference in the engagement among two or more conditions for a module, there should be no difference among the conditions for the corresponding region.
Figure 9.

The decomposition of the BOLD responses in Figure 9 into a tonic component (A) and a phasic component (B). The predictions of the model (C and D).
Before discussing the detailed predictions for each region, it is worth noting some general features of the predictions. The model predicts zero phasic activity in the Orbit and Fortress-Only conditions. This prediction should trivially be supported because there are no mines to make the first 2 sec of the interval special in these conditions. The fact that this prediction is so cleanly supported in the data speaks to the effectiveness of the methodology for extracting out phasic and tonic components. Of theoretical significance, the model also predicts no effect of Mines on tonic activity in any region and this nontrivial prediction is confirmed. Thus, pure insertion is supported with respect to tonic activity. On the other hand, the model does predict a number of regions will show reduced phasic activity in the Both condition relative to the Mines-Only condition. These predictions of nonadditivity are confirmed, indicating that pure insertion does not hold in many regions when a mine appears. Some modules cannot simultaneously deal with the demands of Fortress processing and Mine processing. For many modules, the model predicts zero or even negative phasic activity in the Both condition, indicating that it is not able to recruit any additional resources. In contrast, some positive phasic activation is found in all regions in the Both condition.
Below we discuss the results for the specific regions.
1. Left Motor Region (Right Manual Module)
The manual module is responsible for programming hand movements. It is associated with the activity of the region along the central sulcus where the hand is represented. This includes parts of the motor and sensory cortex. The model’s predictions for both the left and right motor regions are largely a function of the predicted number of key-presses in the various conditions with the corresponding hand (Figure 6). The left motor region controls the right hand, which is involved in shooting at the fortress, processing the mines when they appear and collecting bonus points. This is the source of the main effect of Fortress on tonic activation and the main effect of Mines on phasic activation. The model correctly predicts no tonic activation in the Orbit and Mines-Only conditions. It also correctly predicts the subadditive interaction between Mines and Fortress for phasic activity because it is not possible to simultaneously shoot at the mines and the fortress—a failure of pure insertion.
2. Right Motor Region (Left Manual Module)
The right region controls the left hand, which is constantly involved in navigating the ship. The model predicts an effect of Fortress on tonic activity. This might seem surprising because Fortress did not have a significant effect on number of left-hand keypresses. However, when the fortress is present, the left-hand navigation keys have to be interspersed with right-hand fire keys and it takes longer to program a cross-hand action (a prediction that ACT-R inherits from the origin of its manual module in the EPIC theory; Meyer & Kieras, 1997). The small phasic effect in the right motor reflects the need to aim the ship at the mine and, after shooting the mine, the need to correct the orbit of the ship, which will have drifted from the desired path.
3. Anterior Cingulate Cortex (Goal Module)
The goal module is concerned with setting the different goals of the game and focusing attention on these goals. This is associated with the ACC. This is the same region that other theories see as playing a central role in exerting cognitive control over behavior (e.g., Botvinick, Braver, Carter, Barch, & Cohen, 2001; D’Esposito et al., 1995; Posner & Dehaene, 1994). The destruction of fortresses and appearances of mines cause new goals to be created in the model and so the model predicts the effect of Fortress on tonic activity and Mines on phasic activity. Again the phasic component is much reduced (Mines-by-Fortress interaction) in the Both condition because of resource competition.
4. Posterior Parietal Cortex (Imaginal Module)
The imaginal module is responsible for transformations to problem representations. The imaginal module is associated with a region of the posterior parietal cortex (PPC). This association is roughly consistent with the research of others who have found that this area is involved in spatial processing (e.g., Dehaene, Piazza, Pinel, & Cohen, 2003; Reichle, Carpenter, & Just, 2000) and verbal encoding (Clark & Wagner, 2003; Davachi, Maril, & Wagner, 2001). The model predicts similar effects for the PPC as for ACC. When there is a fortress, this module is used to keep track of the number of times the fortress has been hit and the bonus symbols—this produces an effect of Fortress on tonic activation. When there is a mine, it is used to imagine to trajectory of the mine to determine the appropriate aim to hit the mine—this produces an effect of Mines on phasic activity. The model also predicts a Mine-by-Fortress interaction in phasic activity because responding to the mines prevents shooting at the fortress and monitoring the hit count.
5. Lateral Inferior Prefrontal Cortex (Retrieval Module)
The retrieval module is concerned with controlled retrieval of declarative facts. Although many regions, including the hippocampus and other regions of the inferior temporal lobes, are crucial in the storage and consolidation of memories, there is substantial evidence that the lateral inferior pFC (LIPFC) also plays a critical role in the effortful retrieval of learned information (e.g., Danker, Gunn, & Anderson, 2008; Wheeler & Buckner, 2003; Badre & Wagner, 2002; Cabeza, Dolcos, Graham, & Nyberg, 2002; Thompson-Schill, D’Esposito, Aguirre, & Farah, 1997). This task is rather different than most we have studied (Anderson, 2007) in that the only memory retrieval occurs during the processing of mines when it is necessary to retrieve the letters to identify friend versus foe. Thus, the model correctly predicts that this region will show no significant tonic activity (t(19) = −.02) but will show significant phasic activity (t(19) = 6.52, p < .001). Because the fortress conditions make no demands on retrieval, the model also predicts that this region will not display the subadditive interaction between Mines and Fortress that is observed in other regions. However, there is a Mine-by-Fortress interaction for phasic activity in the opposite direction of the other regions—greater phasic activity in the presence of the fortress. This may reflect less opportunity to rehearse the identifying letters in the Both condition, making the retrieval more difficult.
6. Caudate (Procedural Module)
The procedural module consists of production rules that make requests of the various other modules to perform tasks (Stocco, Lebiere, & Anderson, 2010). The caudate is associated with rule execution in the ACT-R theory, consistent with a number of views of the caudate (e.g., Frank, Loughry, & O’Reilly, 2001; Poldrack, Prabakharan, Seger, & Gabrieli, 1999). It is heavily occupied in all conditions. Because the presence of either the fortress or mines drives its activity toward saturation, the model predicts no phasic activation for the Both condition. This region shows the predicted effects, although the effect of Fortress on tonic activity is only marginally significant. Of the regions, this is the one that shows the poorest correspondence between region and data (r = .671, whereas the average correlation for the rest is .942).
7. Fusiform (Visual Module)
The visual module is associated with recognizing the identity of objects. Although large portions of the brain are devoted to processing visual information, researchers have found that the fusiform gyrus plays a critical role in the recognition of visual objects (Grill-Spector, Knouf, & Kanwisher, 2004; McCandliss, Cohen, & Dehaene, 2003). Some of the Space Fortress activities, including navigation and aiming, do not involve detailed recognition of object identity. However, other activities do. For instance, in processing mines, it is necessary to read the identifying information at the bottom of the screen to decide whether the mine is friend or foe. The fortress conditions also pose a demand on the visual module, both to identify the bonus symbol and to read information about the vulnerability of the fortress. The model again predicts the large effect of Fortress on tonic activity, the effect of Mines on phasic activity, and the sub-additive interaction in phasic activity.
Figure 9 only shows the regions associated with modules in ACT-R. One can ask how representative these patterns are of what is happening in the full brain. As described in the Methods section, we did brain-wide exploratory analyses looking for regions showing significant Mine-by-Fortress interaction with respect to tonic or phasic activity. As expected by the model, no region showed a significant Mine-by-Fortress interaction on tonic activity—even if the brain-wide threshold for significance as described in the Methods section was raised from .01 to .1. On the other hand, numerous regions show a significant interaction in phasic activity. Table 3 gives the 12 regions that involved at least 35 contiguous voxels. Because of the high threshold to avoid false positives, some of the predefined regions that showed significant effects were not identified. However, regions were identified that overlapped with the left and right motor regions (Regions 1 and 4 in Table 3) with ACC (Region 2) and with the left and right fusiform (Regions 11 and 12). All the positive responding regions showed subadditive phasic interactions between Mines and Fortress. In contrast, except for one just-significant effect (Region 11 in Table 3), there were no tonic interactions for these regions. Thus, it appears that the nonadditivity is restricted to the moment when the mines appear and generally reflects the resource competition at that point. Particularly noteworthy are the left and right thalamic regions (Regions 8 and 9), which along with the caudate are part of the loop attributed to procedural execution in ACT-R.
Table 3.
Statistics for Exploratory Regions (see Figure 7) Showing Significant Mine-by-Fortress Interactions in Phasic Activity
| Regions of Interest | Brodmann Area(s) | Talairach Coordinates (x,y,z) | Voxel Count | Sessions | Mines | Fort | Mines × Fort | Learn Corr | Magnitude |
|---|---|---|---|---|---|---|---|---|---|
| (a) Tonic Activity | |||||||||
| 1. L. Pre/Postcentral | 3,4 | −39,−26,53 | 705 | 0.45 | −0.62 | 10.7*** | 0.29 | 0.119 | 0.37% |
| 2. M. Frontal/ACC | 6,24 | 0,−3,49 | 388 | 2.63* | −0.73 | 9.22*** | −0.87 | 0.375 | 0.65% |
| 3. L. SPFG (below) | 6 | −26,17,53 | 61 | 0.80 | −0.11 | −2.40* | −1.82 | 0.275 | −0.11% |
| 4. R. Pre/Postcentral | 4 | 40,−9,53 | 38 | 2.46* | 0.05 | 5.36*** | −1.66 | 0.120 | 0.93% |
| 5. R. Precuneus | 7 | −3,−59,41 | 49 | −1.04 | 3.20** | 1.56 | 0.08 | −0.251 | 0.03% |
| 6. L. Angular Gyrus | 39 | −43,−70,37 | 108 | −1.51 | −1.01 | −5.57*** | −0.84 | 0.138 | −0.24% |
| 7. R. Angular Gyrus | 39 | 47,−70,37 | 88 | −0.67 | 1.43 | −0.53 | −0.10 | 0.045 | −0.15% |
| 8. L. Thalamus | – | −12,−19,10 | 101 | 3.47 | −0.86 | 10.9*** | −1.71 | −0.008 | 0.27% |
| 9. R. Thalamus | – | 10,−16,9 | 51 | 3.74** | −0.07 | 7.58*** | −1.19 | 0.162 | 0.34% |
| 10. L. Occip/Temporal | 19/39 | −39,−71,4 | 283 | 3.73** | 0.49 | 6.07*** | −1.71 | 0.254 | 0.62% |
| 11. R. Occip/Temporal | 19/39 | 41,−74,3 | 180 | 1.63 | 0.58 | 3.37** | −2.1* | 0.319 | 0.56% |
| 12. R. Culmen | – | 13,−55,−9 | 163 | 2.79* | 1.37 | 7.13*** | 0.49 | 0.177 | 0.28% |
| (b) Phasic Activity | |||||||||
| 1. L. Pre/Postcentral | 3,4 | −39,−26,53 | 705 | 3.50** | 16.5*** | −9.88*** | 10.2*** | 0.282 | 0.41% |
| 2. M. Frontal/ACC | 6,24 | 0,−3,49 | 388 | −0.99 | 11.8*** | −10.9*** | 10.9*** | 0.319 | 0.37% |
| 3. L. SPFG (below) | 6 | −26,17,53 | 61 | 3.69** | −2.50* | 7.01*** | −7.2*** | 0.079 | −0.10% |
| 4. R. Pre/Postcentral | 4 | 40,−9,53 | 38 | 0.95 | 8.86*** | −5.83*** | 7.43*** | 0.523* | 0.36% |
| 5. R. Precuneus | 7 | −3,−59,41 | 49 | 3.30** | 5.44** | 3.71** | −6.1*** | 0.292 | 0.24% |
| 6. L. Angular Gyrus | 39 | −43,−70,37 | 108 | 3.63** | −5.3*** | 8.22*** | −7.1*** | −0.052 | −0.21% |
| 7. R. Angular Gyrus | 39 | 47,−70,37 | 88 | 3.08** | −5.8*** | 7.91*** | −7.4*** | −0.180 | −0.21% |
| 8. L. Thalamus | – | −12,−19,10 | 101 | 0.22 | 24.4*** | −10.6*** | 12.4*** | 0.143 | 0.35% |
| 9. R. Thalamus | – | 10,−16,9 | 51 | −1.61 | 21.0*** | −9.88*** | 10.0*** | 0.204 | 0.33% |
| 10. L. Occip/Temporal | 19/39 | −39,−71,4 | 283 | −1.02 | 12.8*** | −7.30*** | 10.4*** | 0.680*** | 0.45% |
| 11. R. Occip/Temporal | 19/39 | 41,−74,3 | 180 | −2.3* | 9.3*** | −6.30*** | 7.94*** | 0.449* | 0.32% |
| 12. R. Culmen | – | 13,−55,−9 | 163 | 1.81 | 13.9*** | −6.95*** | 8.33*** | 0.342 | 0.45% |
See Table 2 for explanation of the statistics.
SPFG = superior prefrontal gyrus.
p < .05.
p < .01.
p < .001.
Figures 8 and 9 average over the effect of Sessions, but Tables 2 and 3 indicate which regions show significant changes from Session 2 to Session 10. The fusiform and ACC show significant decreases in tonic activity, whereas the left motor and LIPFC show significant decreases in phasic activity. There were only two significant interactions involving Session: Both motor regions show a significant Fortress-by-Session interaction in tonic activity (t(19) = −2.61, p < .01 for both left and right) such that activity decreases from Sessions 2 to 10 in the absence of the fortress but increases in its presence. This is related to the trend in Figure 6 for keying rate to stay relatively constant in the absence of fortress but to increase in is presence.
Does tonic or phasic activity in any of these regions predict learning in the task? In particular, we looked at whether the average tonic and phasic activity on Session 2 would predict how much participants learned by Session 9. We chose Session 9 because of the evidence for depression of scores in Session 10. To get a measure of Session 9 performance that corrected for individual differences in initial ability, we calculated the residual Session 9 scores after regressing out Session 1 scores.5 We then correlated these residual scores with measures of phasic and tonic activity during Session 2. These residual scores failed to correlate significantly with any of the measures of tonic activity with the largest correlation being .299 (see Table 2A). On the other hand, there were relatively strong correlations between phasic activity and residual scores (see Table 2B) with the largest being in the right motor (r = .632, t(18) = 3.45, p < .005) and the fusiform (r = .573, t(18) = 2.96, p < .01). Figure 10A illustrates how we can predict the Session 9 score from a combination of the Session 1 score, the Session 2 phasic activity in right motor, and the Session 2 phasic activity in fusiform. Note that all three of these predictor variables are nearly independent (rs < .25) and each bears a fairly strong relationship to the Session 9 score (rs > .45). The figure plots the Session 9 score simply as the sum of the z scores of the three variables. Adding any of these three variables introduces a significant improvement to the regression equation over the other two. No other measure of phasic or tonic activity offers further improvement.
Figure 10.
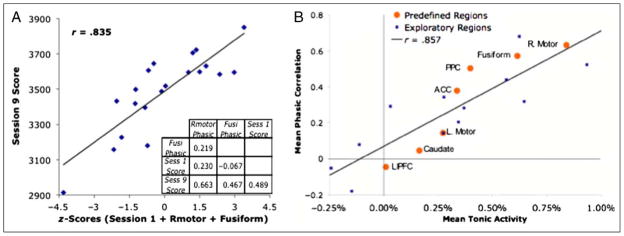
(A) Session 9 performance predicted from z scores for Session 1 performance and phasic right motor and fusiform activity during Session 2. The 20 points represent the 20 participants. The embedded matrix shows the intercorrelations among the measures. (B) The relationship between mean tonic activity in a region and that correlation of that region’s phasic activity with individual differences in residual learning scores.
It is noteworthy that the two regions, the right motor and the fusiform that show the strongest relationship between phasic activation and learning, were also the two regions that showed the greatest tonic activation. Indeed, as illustrated in Figure 10B, there is a perfect rank order correlation between the tonic activation of the various predefined regions and the correlation of their phasic activity with learning gain. The figure also shows the relationship between mean tonic activation and the phasic correlation for the 12 exploratory regions—they all seem to be part of the same linear function. One interpretation is that the more demand the task places on a region for tonic activity, the more important it becomes to have still more capacity to respond to the phasic demands.
DISCUSSION
A model based on the behavioral data in the Mines-Only and Fortress-Only conditions yielded predictions for both behavioral and imaging data in all conditions. The model predicted additivity except at the point of a mine’s appearance in the Both condition where the model was forced to make a choice between processing the fortress and processing the mines. These predictions are supported both by the lack of interaction between Mines and Fortress for tonic activity and the predicted subadditive interactions in phasic activity.
Beyond the general predictions, there was a fairly detailed correspondence between the predictions of model and the data for phasic and tonic components (the overall correlation between prediction and observation in Figure 9 was .963). The only real discrepancies concerned under-prediction of phasic activity in the Both condition. For instance, the model predicted 0 or negative phasic activity in the motor and caudate regions whereas participants always showed some positive phasic activity. It also failed to predict that LIPFC phasic activity would be greater in the Both condition than the Mines-Only condition. We could have modified the model to reflect the second fact by adding in a rehearsal component, but we chose not to for two reasons. First, this tact would move the research effort from its prediction goal to a data-fitting goal. Second, this would only be polishing the basic predictions of the model, which were that there would be no effect of Mines on the tonic response and that the phasic component would show sub-additive effects for those components where there were resource conflicts. The general success of the model predictions indicates that the whole is just the sum of its parts when these parts are properly counted.
The validity of the division into tonic and phasic components was further supported by the evidence that phasic activation predicted learning gains and that these phasic correlations were strongest in regions that had highest tonic activation. The critical factor seemed to be the ability to make additional phasic activation available in the presence of high tonic demands. Although this result was not predicted, it suggests a Saturation Hypothesis—that learning is hindered when the task demands push the capacity of a critical module to full capacity. Sweller (e.g., Sweller, van Merrienboer, & Paas, 1998) has developed at length the argument that high cognitive load is detrimental to learning, but his demonstrations are typically with respect to academic tasks. The fact that learning gains in this task were related to phasic activation in regions of high tonic activation is consistent with possibility that learning may be impacted by cognitive load. Thus, the Saturation Hypothesis may provide an fMRI operationalization of Sweller’s cognitive load hypothesis.
Erickson et al. (2010) report a rather different basis for predicting learning gains in the Space Fortress task. They found that anatomical volume of the caudate predicted learning improvement; whereas we found very little relationship between activity in the caudate and learning improvement. In another analysis, these researchers (Vo et al., 2011) used multivoxel pattern analysis of time-averaged T2*-weighted activity in the caudate to predict learning. There are a number of reasons why these results are rather incomparable with the current results. First, they are using very different predictor measures (volume or overall raw fMRI signal vs. our percent signal change). Second, Erickson et al. only found this correlation in the varied priority practice condition of Gopher et al. (1989, 1994) where participants are asked to focus on different aspects of the game at different points. Our learning condition conforms more closely to their fixed priority practice condition that did not show such a relationship.
The research reported here is related to dual-task research where people are asked to do two different tasks at once. Indeed, the only difference between a dual-task study and a part-task study might be conceived as where the design of the experiment begins: In a dual-task study, one starts with two separate tasks and creates a combined task, whereas in a part-task study, one starts with a whole task breaks it into subtasks. However, typically the single tasks in dual-task research are deliberately designed to be unrelated, whereas the part tasks are typically related, as in this study. There have been numerous imaging studies of dual-task performance (see Szameitat, Schubert, & Müller, 2011, for a review). Sometimes subadditivity is found (e.g., Just et al., 2001), sometimes additivty, and sometimes overadditivity (e.g., Szameitat, Schubert, Müller, & von Cramon, 2002). As illustrated in this article, a model-based approach allows one to predict when and where such effects are going to be found. Borst, Taatgen, Stocco, and Van Rijn (2010) present a similar model-based approach to predicting effects in a more traditional dual-task experiment.
Finally, we would like to return to the question of part-task training. All components in the model for the whole task were present in either the Mines-only condition or the Fortress-Only condition. As a consequence, performance in the whole task was predictable from performance in the subtasks through the lens of the cognitive model. However, this does not imply that a training regimen that consisted of only the Mines-Only and Fortress-Only conditions would be as effective as a training regimen that consisted on entirely of the Both condition (i.e., the full game). In fact, the whole task offers more training opportunities per unit time. If part-task training proves to be superior, it would be because learning is less efficient at points of high cognitive load, which is what the Saturation Hypothesis suggests.
Acknowledgments
This work was supported by ONR grant N00014-09-1-0402 and the National Institute of Mental Health grant MH068243 to J. R. A. We would like to thank Julie Fiez Wayne Gray for their comments and advice on this research.
APPENDIX: THE SPACE FORTRESS SCORE STRUCTURE
PNTS
Destroying the Fortress = +100 points
Energizing a friendly mine = +20 points
Destroying a foe mine = +30 points
Collecting a point option when a bonus is available = +100 points
Firing a missile when you have none left = −3 points
If the Fortress or mine damages your ship = −50 points
If your ship is destroyed = −100 points
CNTRL
When your ship is flying within the hexagon boundary = 6 points per second
When your ship is flying outside the hexagon boundary = 3 points per second
If your ship flies across one edge of the screen=−35 points
If your ship collides with the Fortress (surround by the smaller hexagon) = −5 points
VLCTY
If your ship is moving at an intermediate velocity = +7 points per second
If your ship is moving too fast or too slow = −7 points per second
SPEED
−50 to +100 points depending on how quickly and appropriately you deal with a mine.
Footnotes
Our implementation uses the Pygame version of Destefano and Gray (2008) and involves a significant simplification over the original task, which required mastering a second-order, acceleration control joystick.
The runnable model and a detailed description of that model and its behavioral correspondence are available in the supplementary materials and at act-r.psy.cmu.edu/publications/pubinfo.php?id=974. Also we have placed at the Web site experimental software that runs with human subject or model.
This is equivalent to having two regressors in a design matrix, one regressor for the 2-sec Mine-Only task period and the second regressor being the constant.
One parameter per region to minimize squared deviation between Figure 9A and B and Figure 9C and D.
That is, residual score = Day 9 − (a + b × Day 1) where a and b are slope and intercept in the regression equation.
References
- Adams JA. Historical review and appraisal of research on the learning, retention, and transfer of human motor skills. Psychological Bulletin. 1987;101:41–74. [Google Scholar]
- Amaro E, Jr, Barker GJ. Study design in fMRI: Basic principles. Brain Cognition. 2006;60:220–232. doi: 10.1016/j.bandc.2005.11.009. [DOI] [PubMed] [Google Scholar]
- Anderson JR. Spanning seven orders of magnitude: A challenge for cognitive modeling. Cognitive Science. 2002;26:85–112. [Google Scholar]
- Anderson JR. Human symbol manipulation within an integrated cognitive architecture. Cognitive Science. 2005;29:313–342. doi: 10.1207/s15516709cog0000_22. [DOI] [PubMed] [Google Scholar]
- Anderson JR. How can the human mind occur in the physical universe? New York: Oxford University Press; 2007. [Google Scholar]
- Anderson JR, Bothell D, Byrne MD, Douglass S, Lebiere C, Qin Y. An integrated theory of mind. Psychological Review. 2004;111:1036–1060. doi: 10.1037/0033-295X.111.4.1036. [DOI] [PubMed] [Google Scholar]
- Anderson JR, Carter CS, Fincham JM, Ravizza SM, Rosenberg-Lee M. Using fMRI to test models of complex cognition. Cognitive Science. 2008;32:1323–1348. doi: 10.1080/03640210802451588. [DOI] [PubMed] [Google Scholar]
- Anderson JR, Fincham JM, Qin Y, Stocco A. A central circuit of the mind. Trends in Cognitive Science. 2008;12:136–143. doi: 10.1016/j.tics.2008.01.006. [DOI] [PMC free article] [PubMed] [Google Scholar]
- Badre D, Wagner AD. Semantic retrieval, mnemonic control, and prefrontal cortex. Behavioral and Cognitive Neuroscience Review. 2002;1:206–218. doi: 10.1177/1534582302001003002. [DOI] [PubMed] [Google Scholar]
- Birn RM, Smith MA, Jones TB, Bandettini PA. The respiration response function: The temporal dynamics of fMRI signal fluctuations related to changes in respiration. Neuroimage. 2008;40:644–654. doi: 10.1016/j.neuroimage.2007.11.059. [DOI] [PMC free article] [PubMed] [Google Scholar]
- Boot WR, Kramer AF, Simons DJ, Fabiani M, Gratton G. The effects of video game playing on attention, memory, and executive control. Acta Psychologica. 2008;129:387–398. doi: 10.1016/j.actpsy.2008.09.005. [DOI] [PubMed] [Google Scholar]
- Borst JP, Taatgen NA, Stocco A, Van Rijn H. The neural correlates of problem states: Testing fMRI predictions of a computational model of multitasking. PLoS ONE. 2010;5:e12966. doi: 10.1371/journal.pone.0012966. [DOI] [PMC free article] [PubMed] [Google Scholar]
- Bothell D. Modeling Space Fortress: CMU effort. 2010 act-r.psy.cmu.edu/workshops/workshop-2010/schedule.html.
- Botvinick MM, Braver TS, Carter CS, Barch DM, Cohen JD. Conflict monitoring and cognitive control. Psychological Review. 2001;108:624–652. doi: 10.1037/0033-295x.108.3.624. [DOI] [PubMed] [Google Scholar]
- Cabeza R, Dolcos F, Graham R, Nyberg L. Similarities and differences in the neural correlates of episodic memory retrieval and working memory. Neuroimage. 2002;16:317–330. doi: 10.1006/nimg.2002.1063. [DOI] [PubMed] [Google Scholar]
- Clark D, Wagner AD. Assembling and encoding word representations: fMRI subsequent memory effects implicate a role for phonological control. Neuropsychologia. 2003;41:304–317. doi: 10.1016/s0028-3932(02)00163-x. [DOI] [PubMed] [Google Scholar]
- Corbett AT, Anderson JR, O’Brien AT. Student modeling in the ACT Programming Tutor. In: Nichols P, Chipman S, Brennan B, editors. Cognitively diagnostic assessment. Hillsdale, NJ: Erlbaum; 1995. pp. 19–41. [Google Scholar]
- Cox R. AFNI: Software for analysis and visualization of functional magnetic resonance neuroimages. Computers and Biomedical Research. 1996;29:162–173. doi: 10.1006/cbmr.1996.0014. [DOI] [PubMed] [Google Scholar]
- Cox R, Hyde JS. Software tools for analysis and visualization of fMRI data. NMR in Biomedicine. 1997;10:171–178. doi: 10.1002/(sici)1099-1492(199706/08)10:4/5<171::aid-nbm453>3.0.co;2-l. [DOI] [PubMed] [Google Scholar]
- Danker JF, Gunn P, Anderson JR. A rational account of memory predicts left prefrontal activation during controlled retrieval. Cerebral Cortex. 2008;18:2674–2685. doi: 10.1093/cercor/bhn027. [DOI] [PMC free article] [PubMed] [Google Scholar]
- Davachi L, Maril A, Wagner AD. When keeping in mind supports later bringing to mind: Neural markers of phonological rehearsal predict subsequent remembering. Journal of Cognitive Neuroscience. 2001;13:1059–1070. doi: 10.1162/089892901753294356. [DOI] [PubMed] [Google Scholar]
- Dehaene S, Piazza M, Pinel P, Cohen L. Three parietal circuits for number processing. Cognitive Neuropsychology. 2003;20:487–506. doi: 10.1080/02643290244000239. [DOI] [PubMed] [Google Scholar]
- D’Esposito M, Piazza M, Detre JA, Alsop DC, Shin RK, Atlas S, et al. The neural basis of the central executive of working memory. Nature. 1995;378:279–281. doi: 10.1038/378279a0. [DOI] [PubMed] [Google Scholar]
- Destefano M, Gray WD. Progress report on Pygame Space Fortress. Troy, NY: Rensselaer Polytechnic Institute; 2008. [Google Scholar]
- Donchin E. The learning-strategies project: Introductory remarks. Acta Psychologica. 1989;71:1–15. [Google Scholar]
- Donders FC. On the speed of mental processes. In: Koster WG, editor. Attention and Performance II Acta Psychologica. Vol. 30. 1869. pp. 412–431. [DOI] [PubMed] [Google Scholar]
- Erickson KI, Boot WR, Basak C, Neider MB, Prakash RS, Voss MW, et al. Striatum volume predicts level of video game skill acquisition. Cerebral Cortex. 2010;20:2522–2530. doi: 10.1093/cercor/bhp293. [DOI] [PMC free article] [PubMed] [Google Scholar]
- Ferguson CJ. The good, the bad and the ugly: A meta-analytic review of positive and negative effects of violent video games. Psychiatric Quarterly. 2007;78:309–316. doi: 10.1007/s11126-007-9056-9. [DOI] [PubMed] [Google Scholar]
- Frank MJ, Loughry B, O’Reilly RC. Interactions between the frontal cortex and basal ganglia in working memory: A computational model. Cognitive, Affective, and Behavioral Neuroscience. 2001;1:137–160. doi: 10.3758/cabn.1.2.137. [DOI] [PubMed] [Google Scholar]
- Frederiksen JR, White BY. An approach to training based upon principled task decomposition. Acta Psychologica. 1989;71:89–146. [Google Scholar]
- Friston KJ. Statistical parametric mapping: The analysis of functional brain images. London: Academic Press; 2006. [Google Scholar]
- Friston KJ, Fletcher P, Josephs O, Holmes AP, Rugg MD, Turner R. Event-related fMRI: Characterising differential responses. Neuroimage. 1998;7:30–40. doi: 10.1006/nimg.1997.0306. [DOI] [PubMed] [Google Scholar]
- Gopher D, Weil M, Bareket T. Transfer of skill from a computer game trainer to flight. Human Factors. 1994;36:387–405. [Google Scholar]
- Gopher D, Weil M, Siegel D. Practice under changing priorities: An approach to training of complex skills. Acta Psychologica. 1989;71:147–178. [Google Scholar]
- Green CS, Bavelier D. Exercising your brain: A review of human brain plasticity and training-induced learning. Psychology and Aging. 2008;23:692–701. doi: 10.1037/a0014345. [DOI] [PMC free article] [PubMed] [Google Scholar]
- Grill-Spector K, Knouf N, Kanwisher N. The fusiform face area subserves face perception, not generic within-category identification. Nature Neuroscience. 2004;7:555–562. doi: 10.1038/nn1224. [DOI] [PubMed] [Google Scholar]
- Hodge KA, Rothrock L, Kirlik AC, Walker N, Fisk AD, Phipps DA, et al. Tech Rep No HAPL-9501. Atlanta, GA: Georgia Institute of Technology, School of Psychology, Human Attention and Performance Laboratory; 1995. Trainings for tactical decision making under stress: Towards automatization of component skills. [Google Scholar]
- Just MA, Carpenter PA, Keller TA, Emery L, Zajac H, Thulborn KR. Interdependence of nonoverlapping cortical systems in dual cognitive tasks. Neuroimage. 2001;14:417–426. doi: 10.1006/nimg.2001.0826. [DOI] [PubMed] [Google Scholar]
- Lee FJ, Anderson JR. Does learning of a complex task have to be complex? A study in learning decomposition. Cognitive Psychology. 2001;42:267–316. doi: 10.1006/cogp.2000.0747. [DOI] [PubMed] [Google Scholar]
- Los SA. On the origin of mixing costs: Exploring information processing in pure and mixed blocks of trials. Acta Psychologica. 1996;94:145–188. [Google Scholar]
- McCandliss BD, Cohen L, Dehaene S. The visual word form area: Expertise for reading in the fusiform gyrus. Trends in Cognitive Sciences. 2003;7:293–299. doi: 10.1016/s1364-6613(03)00134-7. [DOI] [PubMed] [Google Scholar]
- Meyer DE, Kieras DE. A computational theory of executive cognitive processes and multiple-task performance: Part 1. Basic mechanisms. Psychological Review. 1997;104:2–65. doi: 10.1037/0033-295x.104.1.3. [DOI] [PubMed] [Google Scholar]
- Naylor JC, Briggs GE. Effects of task complexity and task organization on the relative efficiency of part and whole training methods. Journal of Experimental Psychology. 1963;65:217–224. doi: 10.1037/h0041060. [DOI] [PubMed] [Google Scholar]
- Poldrack RA, Prabakharan V, Seger C, Gabrieli JDE. Striatal activation during cognitive skill learning. Neuropsychology. 1999;13:564–574. doi: 10.1037//0894-4105.13.4.564. [DOI] [PubMed] [Google Scholar]
- Posner MI, Dehaene S. Attentional networks. Trends in Neurosciences. 1994;17:75–79. doi: 10.1016/0166-2236(94)90078-7. [DOI] [PubMed] [Google Scholar]
- Reichle ED, Carpenter PA, Just MA. The neural basis of strategy and skill in sentence-picture verification. Cognitive Psychology. 2000;40:261–295. doi: 10.1006/cogp.2000.0733. [DOI] [PubMed] [Google Scholar]
- Roberts S, Sternberg S. The meaning of additive reaction-time effects: Tests of three alternatives. In: Meyer D, Kornblum S, editors. Attention and performance XIV. Cambridge, MA: MIT Press; 1993. pp. 611–653. [Google Scholar]
- Rubin O, Meiran N. On the origins of the task mixing cost in the cuing task-switching paradigm. Journal of Experimental Psychology: Learning, Memory, and Cognition. 2005;31:1477–1491. doi: 10.1037/0278-7393.31.6.1477. [DOI] [PubMed] [Google Scholar]
- Salvucci D, Taatgen NA. The multitasking mind. New York: Oxford University Press; 2010. [Google Scholar]
- Schneider W, Fisk AD. Concurrent automatic and controlled visual search: Can processing occur without resource cost? Journal of Experimental Psychology: Learning, Memory, and Cognition. 1982;8:261–278. [Google Scholar]
- Shebilske WL, Regian JW, Arthur W, Jordan JA. A dyadic protocol for training complex skills. Human Factors. 1992;34:369–374. [Google Scholar]
- Sidtis JJ, Strother SC, Anderson JR, Rottenberg DA. Are brain functions really additive? Neuroimage. 1999;9:490–496. doi: 10.1006/nimg.1999.0423. [DOI] [PubMed] [Google Scholar]
- Spence I, Feng J. Video games and spatial cognition. Review of General Psychology. 2010;14:92–104. [Google Scholar]
- Sternberg S. The discovery of processing stages: Extensions of Donders’ method. Acta Psychologica. 1969;30:276–315. [Google Scholar]
- Stocco A, Lebiere C, Anderson JR. Conditional routing of information to the neocortex: A network model of basal ganglia function. Psychological Review. 2010;117:540–574. doi: 10.1037/a0019077. [DOI] [PMC free article] [PubMed] [Google Scholar]
- Sweller J, van Merrienboer J, Paas F. Cognitive architecture and instructional design. Educational Psychology Review. 1998;10:251–296. [Google Scholar]
- Szameitat AJ, Schubert T, Müller HJ. How to test for dual-task specific effects in brain imaging studies—An evaluation of potential analysis methods. Neuroimage. 2011;54:1765–1773. doi: 10.1016/j.neuroimage.2010.07.069. [DOI] [PubMed] [Google Scholar]
- Szameitat AJ, Schubert T, Müller K, von Cramon DY. Localization of executive functions in dual-task performance with fMRI. Journal of Cognitive Neuroscience. 2002;14:1184–1199. doi: 10.1162/089892902760807195. [DOI] [PubMed] [Google Scholar]
- Thompson-Schill SL, D’Esposito M, Aguirre GK, Farah MJ. Role of left inferior prefrontal cortex in retrieval of semantic knowledge: A reevaluation. Proceedings of the National Academy of Sciences, USA. 1997;94:14792–14797. doi: 10.1073/pnas.94.26.14792. [DOI] [PMC free article] [PubMed] [Google Scholar]
- van Merriënboer JJG. Training complex cognitive skills: A four-component instructional design model for technical training. Englewood Cliffs, NJ: Educational Technology Publications; 1997. [Google Scholar]
- Vo LTK, Walther DB, Erickson KI, Boot WR, Voss MW, Prakash RS, et al. Predicting individuals’ learning success from patterns of prelearning MRI activity. PLoS One. 2011;6:1–9. doi: 10.1371/journal.pone.0016093. [DOI] [PMC free article] [PubMed] [Google Scholar]
- Wheeler ME, Buckner RL. Functional dissociations among components of remembering: Control, perceived oldness, and content. Journal of Neuroscience. 2003;23:3869–3880. doi: 10.1523/JNEUROSCI.23-09-03869.2003. [DOI] [PMC free article] [PubMed] [Google Scholar]
- Woods RP, Grafton ST, Holmes CJ, Cherry SR, Mazziotta JC. Automated image registration: I. General methods and intrastudent intramodality validation. Journal of Computer Assisted Tomography. 1998;22:139–152. doi: 10.1097/00004728-199801000-00027. [DOI] [PubMed] [Google Scholar]